| Param | Original file | Final file |
|---|---|---|
| Filename | modeM0/AS1A11_075T01_9000005342_37660cztM0_level2.evt | modeM0/AS1A11_075T01_9000005342_37660cztM0_level2_quad_clean.evt |
| Size (bytes) | 442,402,560 | 57,435,840 |
| Size | 421.9 MB | 54.8 MB |
| Events in quadrant A | 3,117,221 | 340,119 |
| Events in quadrant B | 2,925,744 | 344,176 |
| Events in quadrant C | 2,852,871 | 343,091 |
| Events in quadrant D | 4,116,620 | 314,356 |
| Mode SS | |||
|---|---|---|---|
| Quadrant | BADHDUFLAG | Total packets | Discarded packets |
| A | 0 | 116 | 0 |
| B | 0 | 116 | 0 |
| C | 0 | 116 | 0 |
| D | 0 | 116 | 0 |
| Mode M0 | |||
|---|---|---|---|
| Quadrant | BADHDUFLAG | Total packets | Discarded packets |
| A | 0 | 12590 | 3 |
| B | 0 | 12160 | 2 |
| C | 0 | 11749 | 2 |
| D | 0 | 15935 | 2 |
| Mode M9 | |||
|---|---|---|---|
| Quadrant | BADHDUFLAG | Total packets | Discarded packets |
| A | 0 | 20 | 0 |
| B | 0 | 20 | 0 |
| C | 0 | 20 | 0 |
| D | 0 | 21 | 0 |
| Quadrant | Total seconds | Saturated seconds | Saturation percentage |
|---|---|---|---|
| A | 5675 | 30 | 0.528634% |
| B | 5675 | 59 | 1.039648% |
| C | 5675 | 18 | 0.317181% |
| D | 5675 | 351 | 6.185022% |
Noise dominated data is calculated using 1-second bins in cleaned event files. If a bin has >2000 counts, and if more than 50% of those come from <1% of pixels, then it is considered to be noise-dominated and hence unusable.
| Quadrant | # 1 sec bins | Bins with >0 counts | Bins with >2000 counts | High rate bins dominated by noise | Noise dominated (total time) | Noise dominated (detector-on time) | Marked lightcurve |
|---|---|---|---|---|---|---|---|
| A | 7259 | 5676 | 20 | 20 | 0.28% | 0.35% | 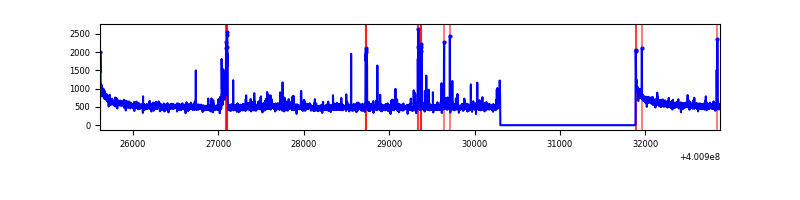 |
| B | 7258 | 5674 | 44 | 44 | 0.61% | 0.78% | 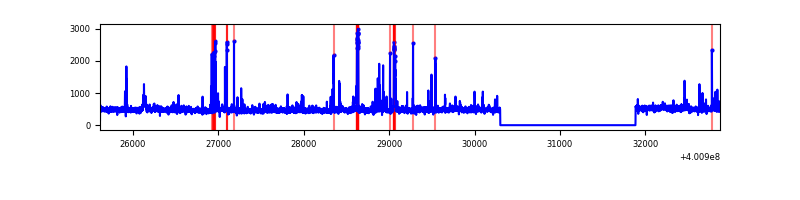 |
| C | 7258 | 5674 | 9 | 9 | 0.12% | 0.16% | 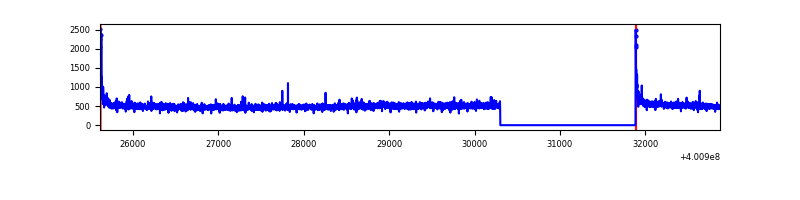 |
| D | 7258 | 5674 | 344 | 344 | 4.74% | 6.06% | 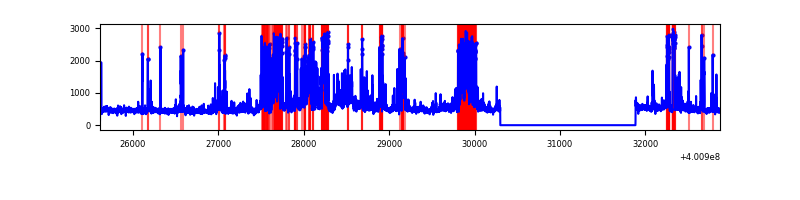 |
Top three noisy pixels from each quadrant. If the there are fewer than three noisy pixels in the level2.evt file, extra rows are filled as -1
| Pixel properties | Quadrant properties | ||||||
|---|---|---|---|---|---|---|---|
| Quadrant | DetID | PixID | Counts | Sigma | Mean | Median | Sigma |
| A | 10 | 83 | 333719 | 2484.57 | 664 | 650 | 134.1 |
| A | 9 | 143 | 66359 | 490.16 | 664 | 650 | 134.1 |
| A | 13 | 248 | 62549 | 461.74 | 664 | 650 | 134.1 |
| B | 5 | 172 | 169086 | 1322.94 | 656 | 636 | 127.3 |
| B | 0 | 230 | 43191 | 334.21 | 656 | 636 | 127.3 |
| B | 5 | 200 | 38928 | 300.73 | 656 | 636 | 127.3 |
| C | 15 | 214 | 261405 | 1757.02 | 642 | 645 | 148.4 |
| C | 0 | 10 | 63491 | 423.46 | 642 | 645 | 148.4 |
| C | 14 | 254 | 10972 | 69.58 | 642 | 645 | 148.4 |
| D | 4 | 239 | 643810 | 4159.18 | 629 | 609 | 154.6 |
| D | 2 | 250 | 321629 | 2075.84 | 629 | 609 | 154.6 |
| D | 2 | 249 | 221870 | 1430.76 | 629 | 609 | 154.6 |
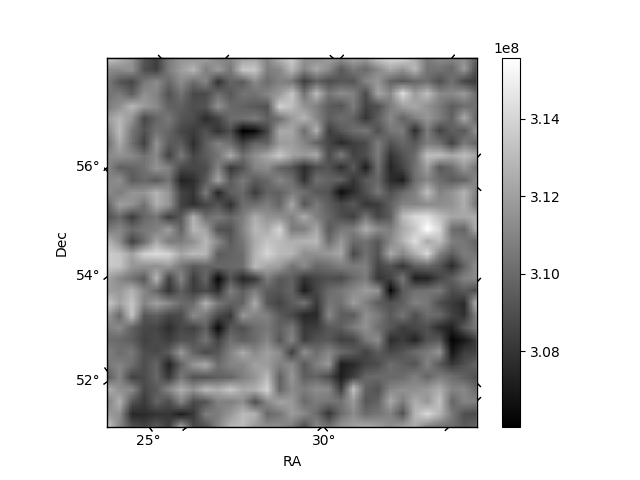
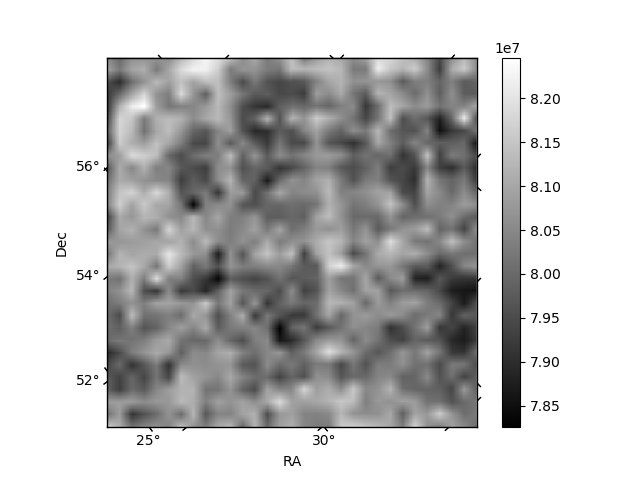
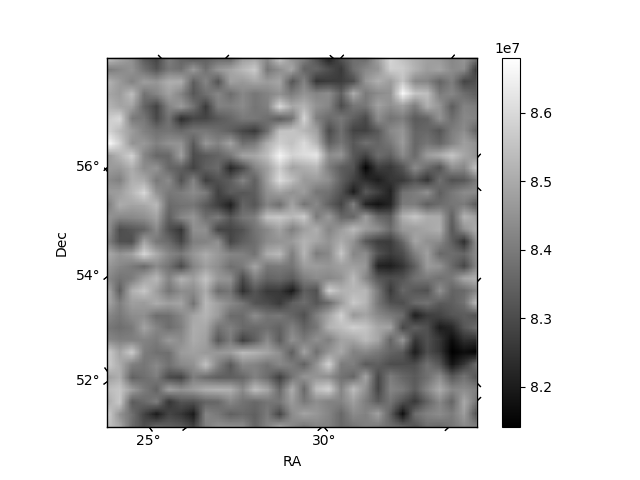
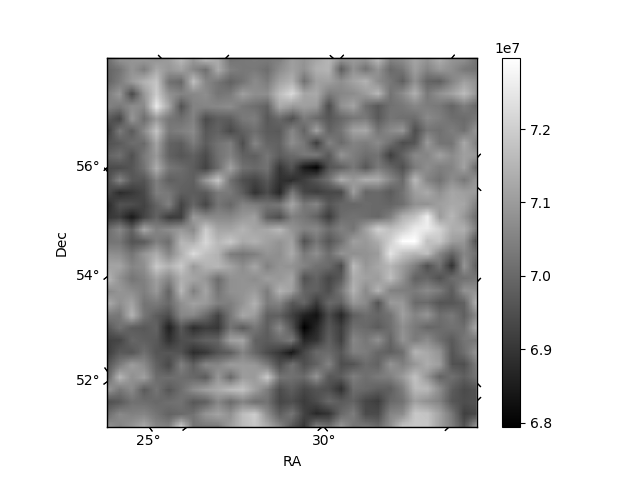
Histogram calculated using DETX and DETY for each event in the final _common_clean file
| Quadrant A | 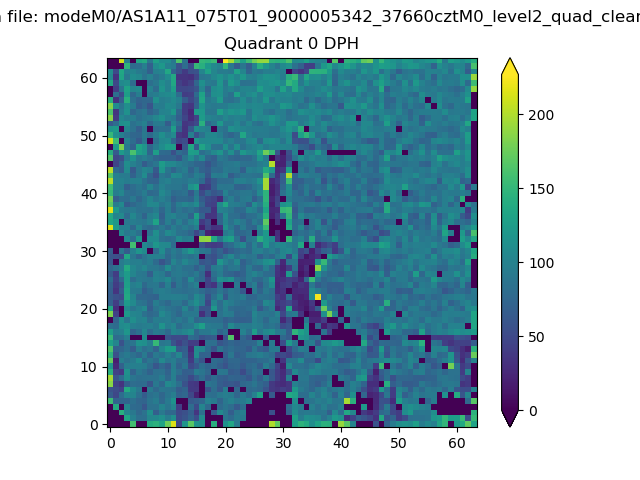 |
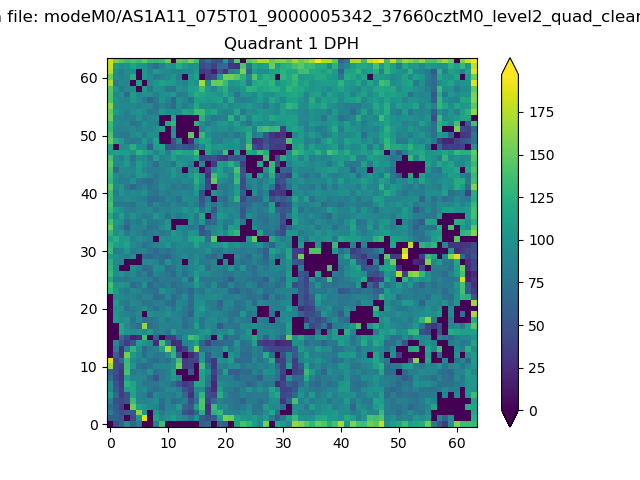 |
Quadrant B |
|---|---|---|---|
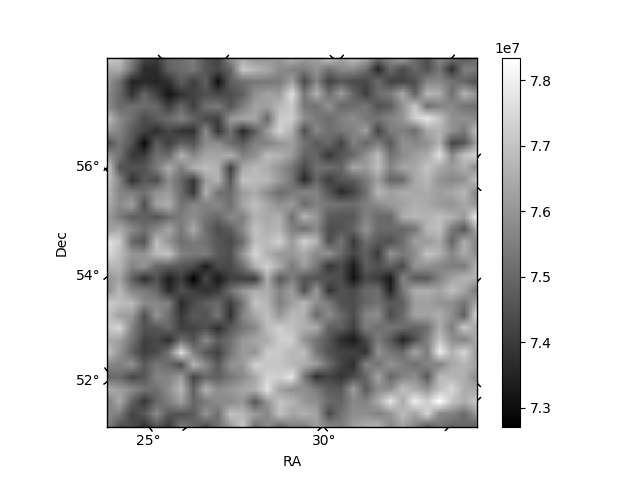
| Quadrant D | 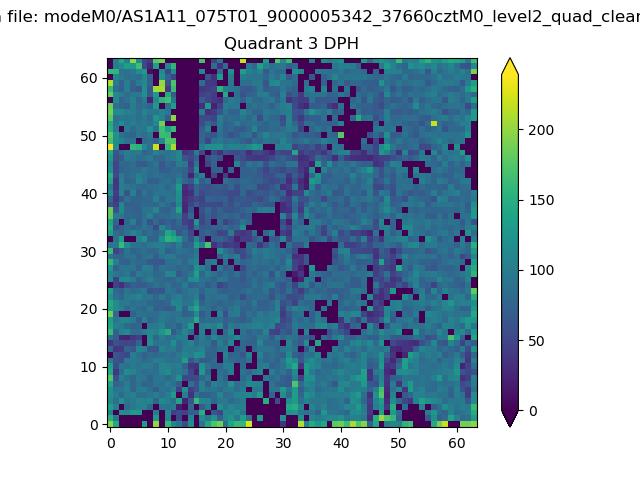 |
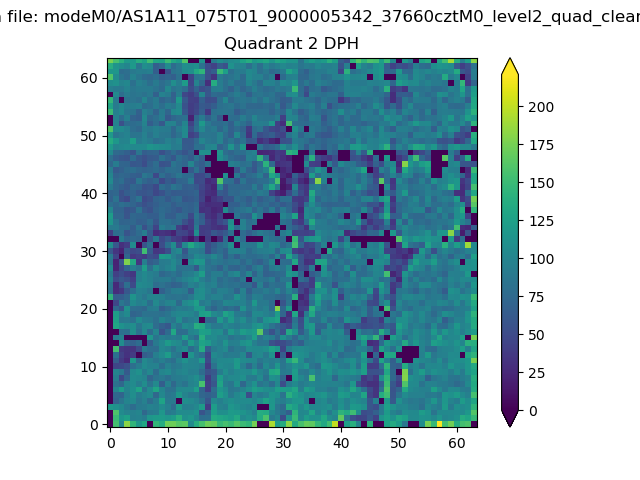 |
Quadrant C |
| Plot type | Count rate plots | Images |
|---|---|---|
| Comparison with Poisson distribution Blue bars denote a histogram of data divided into 1 sec bins. Red curve is a Poisson curve with rate = median count rate of data. |
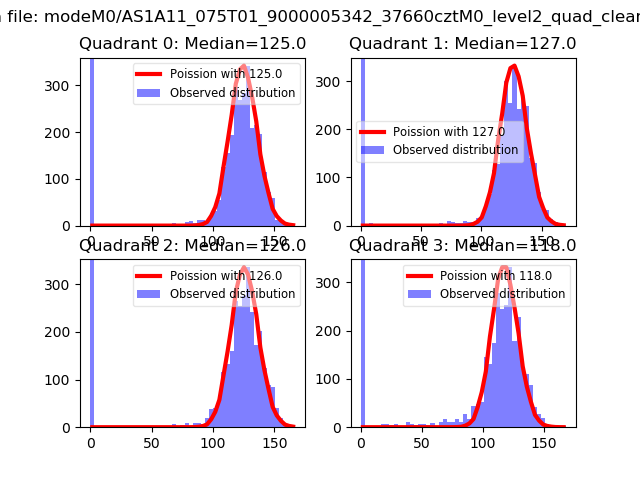 |
 |
| Quadrant-wise count rates Data is divided into 100 sec bins |
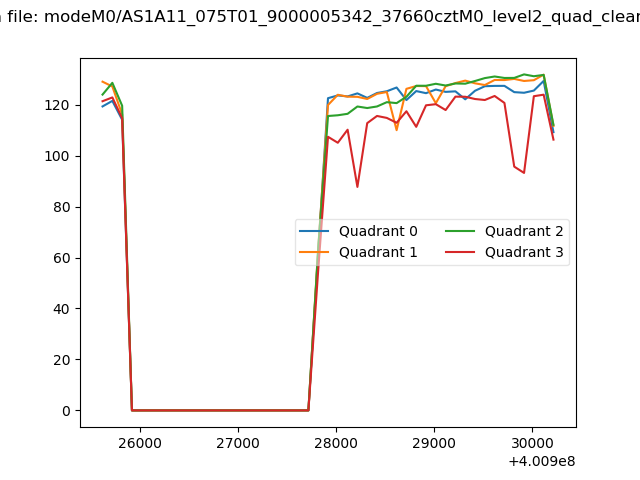 |
|
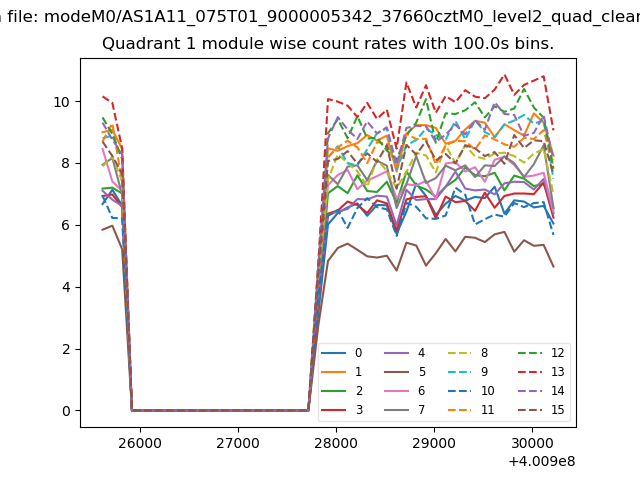
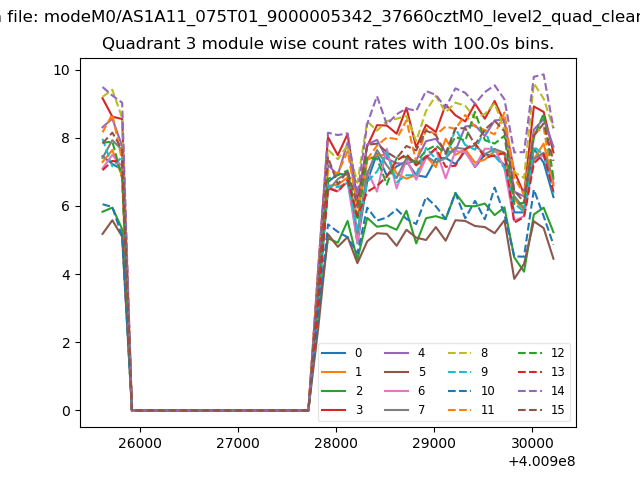
| Module-wise count rates for Quadrant A Data is divided into 100 sec bins |
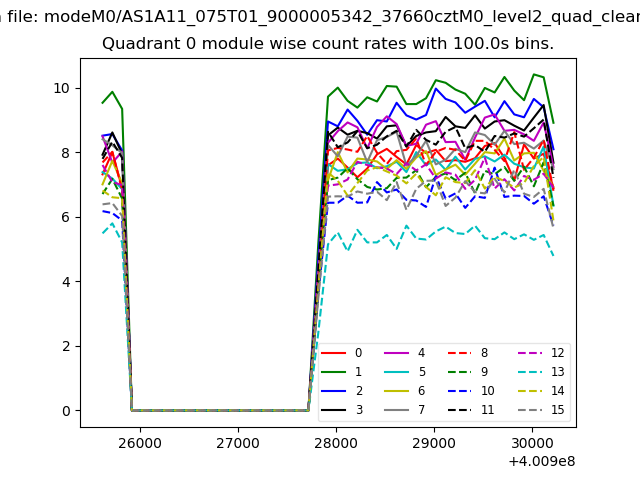 |
 |
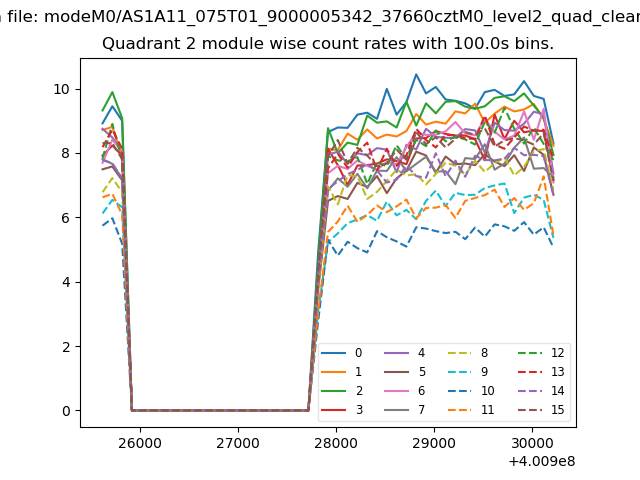
| Module-wise count rates for Quadrant B Data is divided into 100 sec bins |
 |
 |
| Module-wise count rates for Quadrant C Data is divided into 100 sec bins |
 |
 |
| Module-wise count rates for Quadrant D Data is divided into 100 sec bins |
 |
 |
| Parameter | Plot |
|---|---|
| CZT HV Monitor | 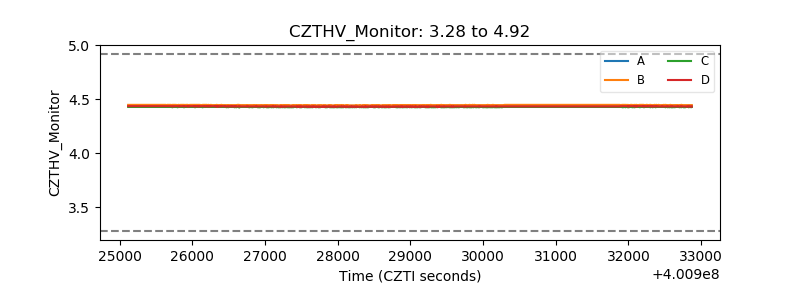 |
| D_VDD | 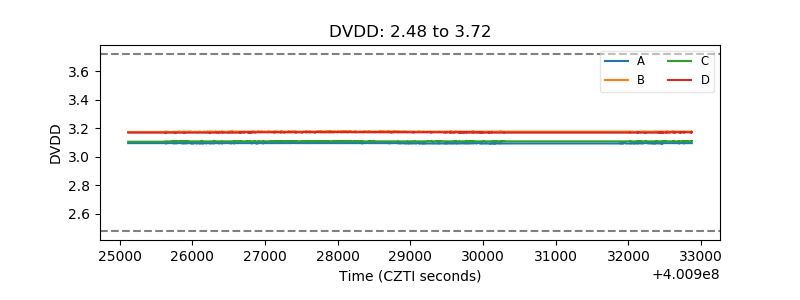 |
| Temperature 1 | 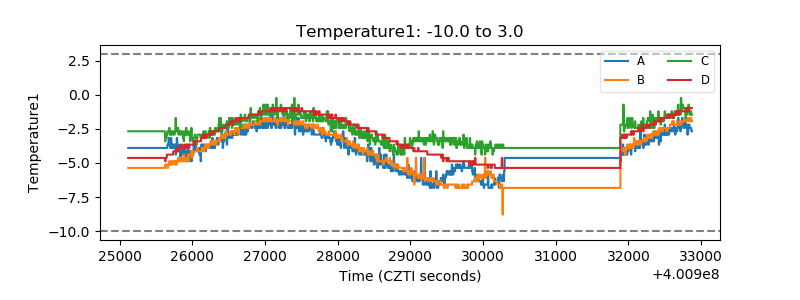 |
| Veto HV Monitor | 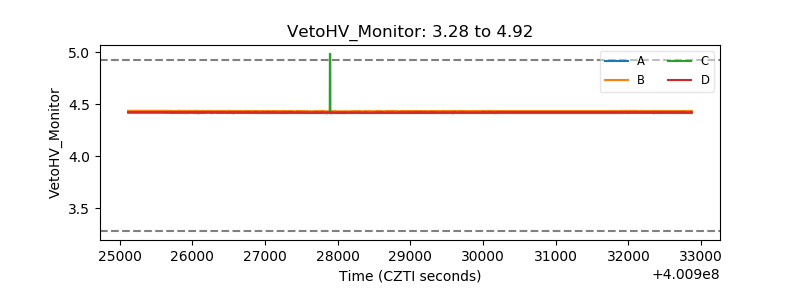 |
| Veto LLD | 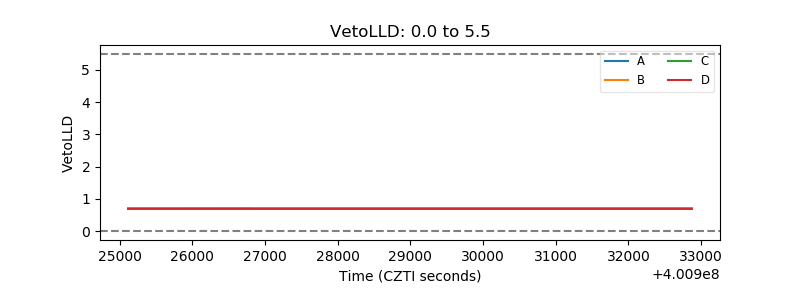 |
| Alpha Counter | 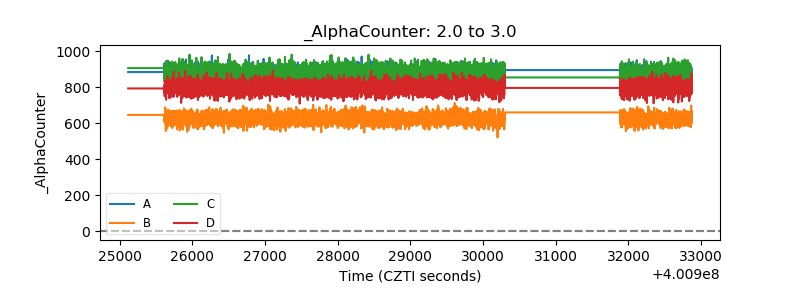 |
| _CPM_Rate | 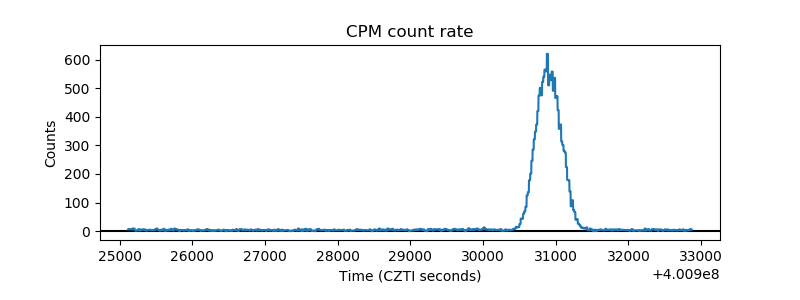 |
| CZT Counter | 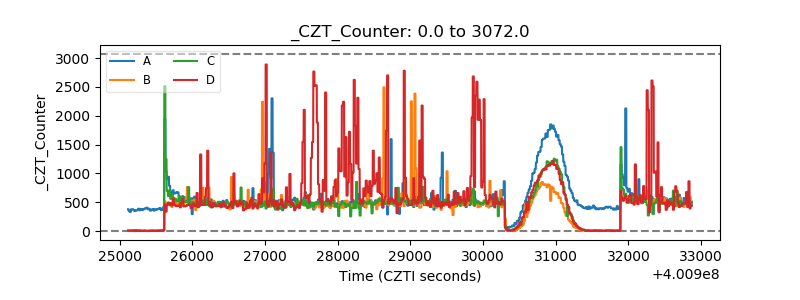 |
| +2.5 Volts monitor | 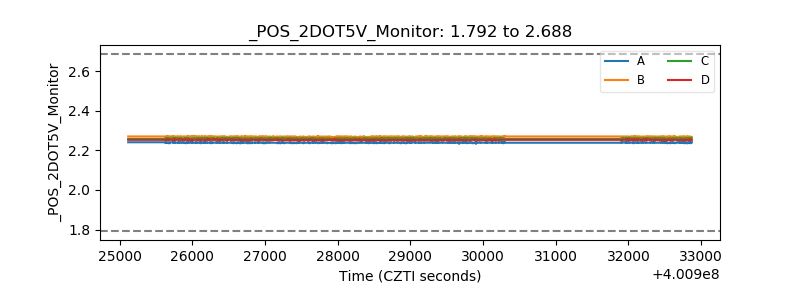 |
| +5 Volts monitor | 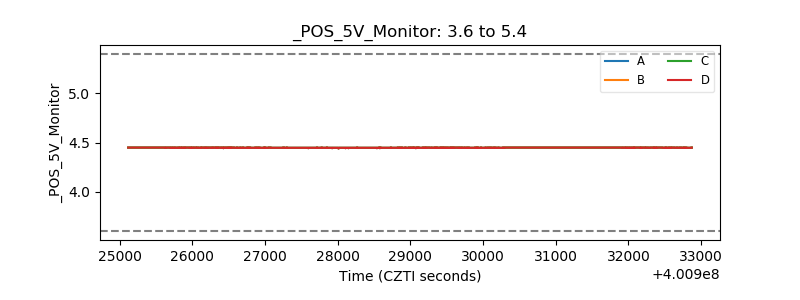 |
| _ROLL_ROT | 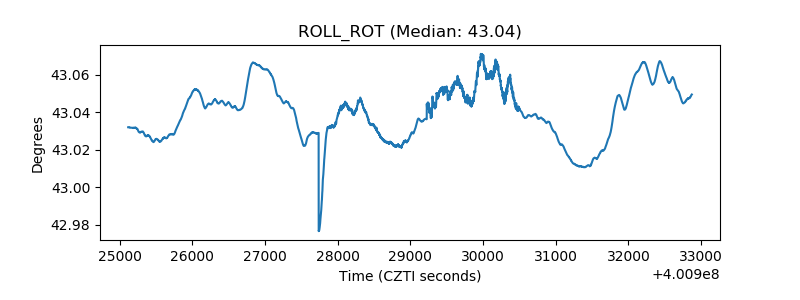 |
| _Roll_DEC | 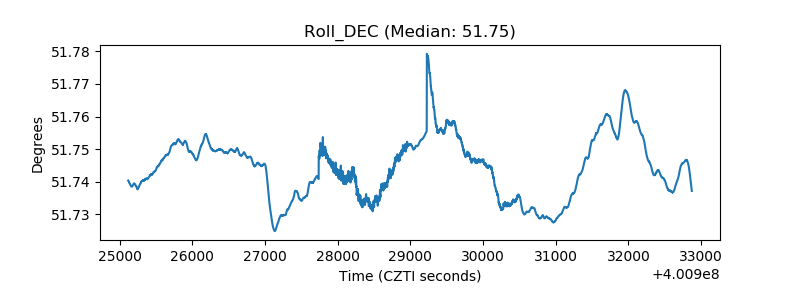 |
| _Roll_RA | 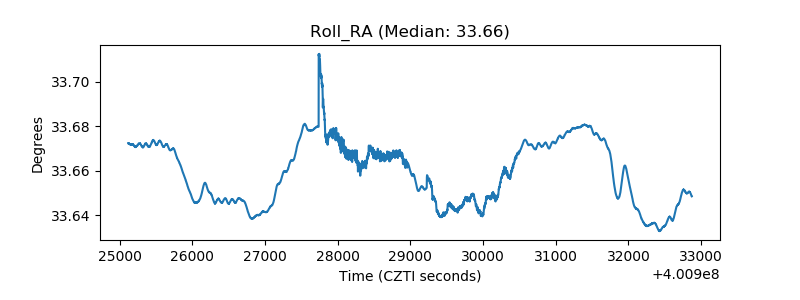 |
| Veto Counter | 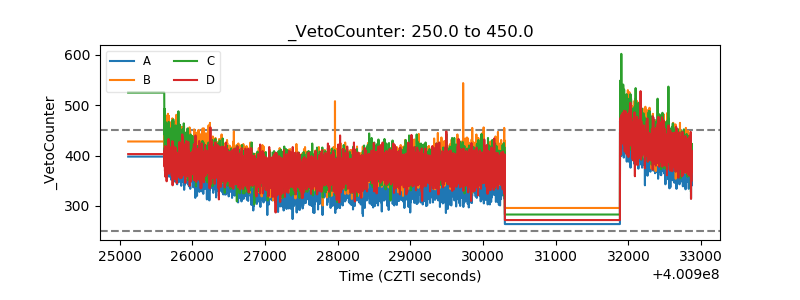 |