| Param | Original file | Final file |
|---|---|---|
| Filename | modeM0/AS1A11_075T01_9000005342_37663cztM0_level2.evt | modeM0/AS1A11_075T01_9000005342_37663cztM0_level2_quad_clean.evt |
| Size (bytes) | 425,056,320 | 63,789,120 |
| Size | 405.4 MB | 60.8 MB |
| Events in quadrant A | 3,276,852 | 384,703 |
| Events in quadrant B | 2,930,542 | 398,982 |
| Events in quadrant C | 2,858,977 | 397,599 |
| Events in quadrant D | 3,445,590 | 377,907 |
| Mode SS | |||
|---|---|---|---|
| Quadrant | BADHDUFLAG | Total packets | Discarded packets |
| A | 0 | 108 | 0 |
| B | 0 | 108 | 0 |
| C | 0 | 108 | 0 |
| D | 0 | 108 | 0 |
| Mode M0 | |||
|---|---|---|---|
| Quadrant | BADHDUFLAG | Total packets | Discarded packets |
| A | 0 | 13126 | 3 |
| B | 0 | 12019 | 2 |
| C | 0 | 11589 | 2 |
| D | 0 | 13738 | 2 |
| Mode M9 | |||
|---|---|---|---|
| Quadrant | BADHDUFLAG | Total packets | Discarded packets |
| A | 0 | 29 | 0 |
| B | 0 | 29 | 0 |
| C | 0 | 29 | 0 |
| D | 0 | 30 | 0 |
| Quadrant | Total seconds | Saturated seconds | Saturation percentage |
|---|---|---|---|
| A | 5316 | 124 | 2.332581% |
| B | 5316 | 55 | 1.034612% |
| C | 5316 | 13 | 0.244545% |
| D | 5316 | 53 | 0.996990% |
Noise dominated data is calculated using 1-second bins in cleaned event files. If a bin has >2000 counts, and if more than 50% of those come from <1% of pixels, then it is considered to be noise-dominated and hence unusable.
| Quadrant | # 1 sec bins | Bins with >0 counts | Bins with >2000 counts | High rate bins dominated by noise | Noise dominated (total time) | Noise dominated (detector-on time) | Marked lightcurve |
|---|---|---|---|---|---|---|---|
| A | 7169 | 5317 | 104 | 104 | 1.45% | 1.96% | 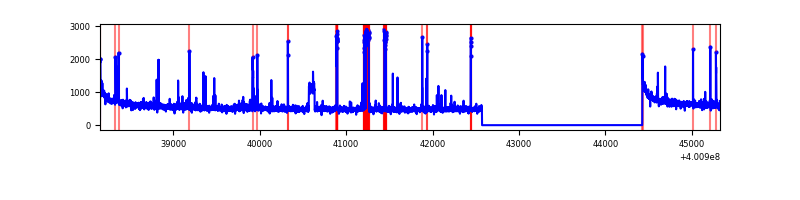 |
| B | 7168 | 5315 | 30 | 30 | 0.42% | 0.56% | 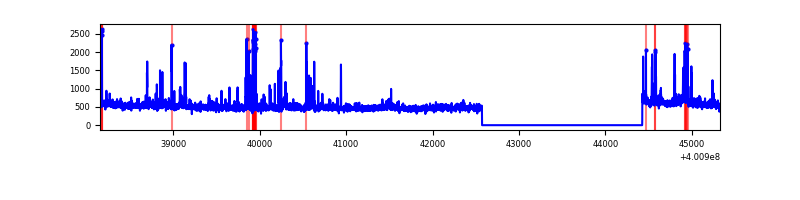 |
| C | 7168 | 5315 | 10 | 10 | 0.14% | 0.19% | 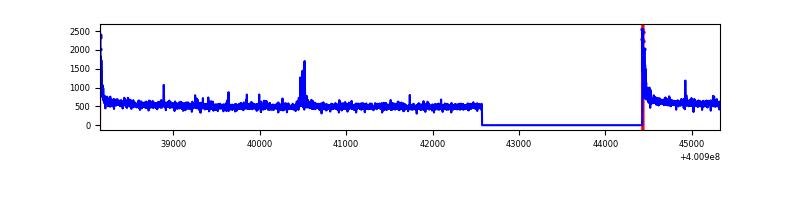 |
| D | 7168 | 5315 | 39 | 39 | 0.54% | 0.73% | 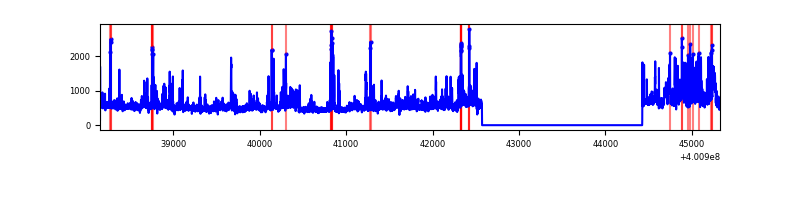 |
Top three noisy pixels from each quadrant. If the there are fewer than three noisy pixels in the level2.evt file, extra rows are filled as -1
| Pixel properties | Quadrant properties | ||||||
|---|---|---|---|---|---|---|---|
| Quadrant | DetID | PixID | Counts | Sigma | Mean | Median | Sigma |
| A | 10 | 83 | 316566 | 2443.9 | 649 | 638 | 129.3 |
| A | 15 | 222 | 241508 | 1863.28 | 649 | 638 | 129.3 |
| A | 9 | 143 | 120223 | 925.06 | 649 | 638 | 129.3 |
| B | 5 | 172 | 147486 | 1187.65 | 652 | 634 | 123.6 |
| B | 0 | 230 | 84045 | 674.58 | 652 | 634 | 123.6 |
| B | 15 | 85 | 49773 | 397.41 | 652 | 634 | 123.6 |
| C | 15 | 214 | 245882 | 1664.44 | 641 | 645 | 147.3 |
| C | 0 | 10 | 68669 | 461.68 | 641 | 645 | 147.3 |
| C | 12 | 250 | 31015 | 206.12 | 641 | 645 | 147.3 |
| D | 12 | 227 | 551965 | 3623.58 | 639 | 624 | 152.2 |
| D | 12 | 233 | 147951 | 968.28 | 639 | 624 | 152.2 |
| D | 10 | 199 | 98542 | 643.55 | 639 | 624 | 152.2 |
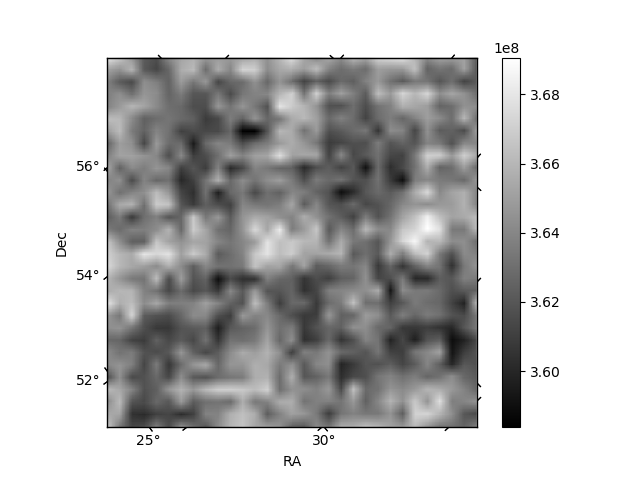
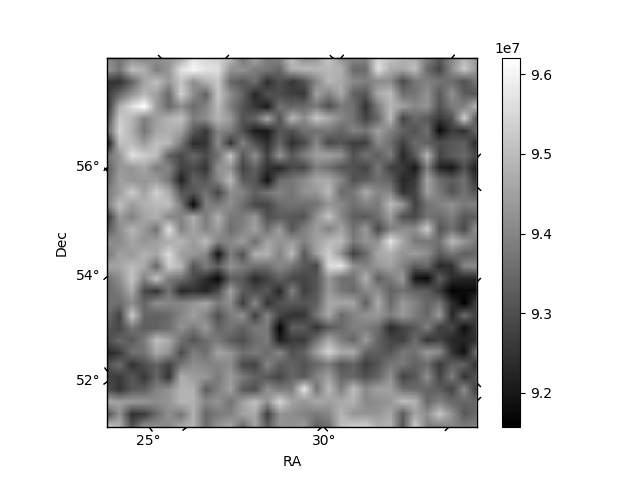
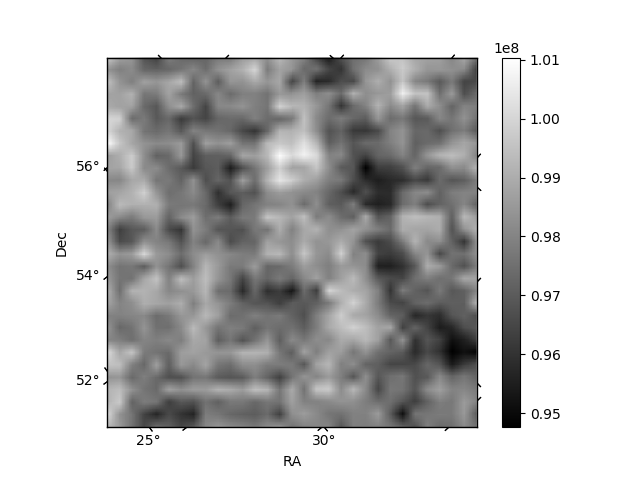
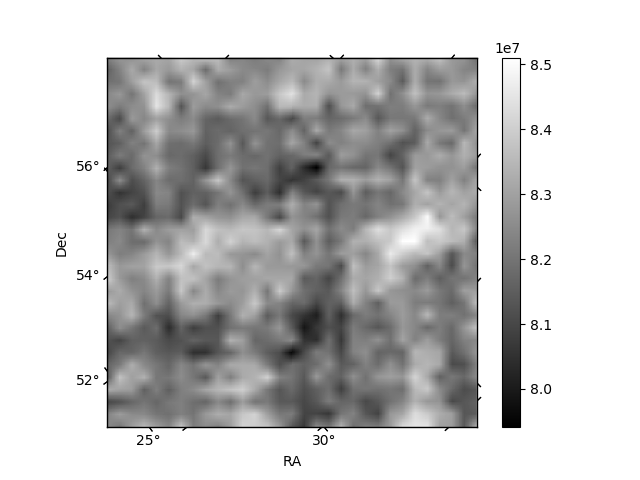
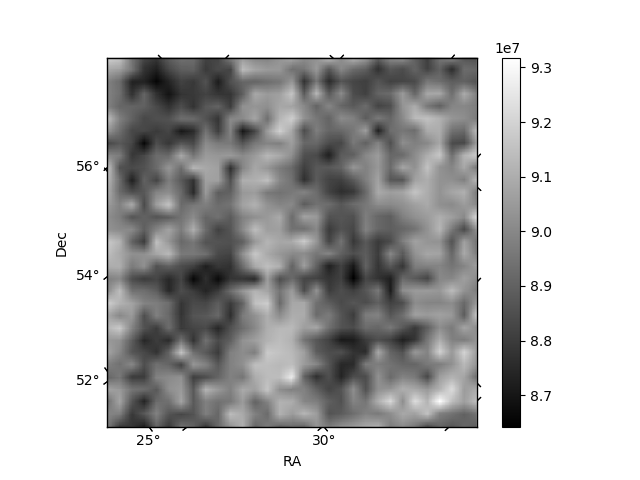
Histogram calculated using DETX and DETY for each event in the final _common_clean file
| Quadrant A | 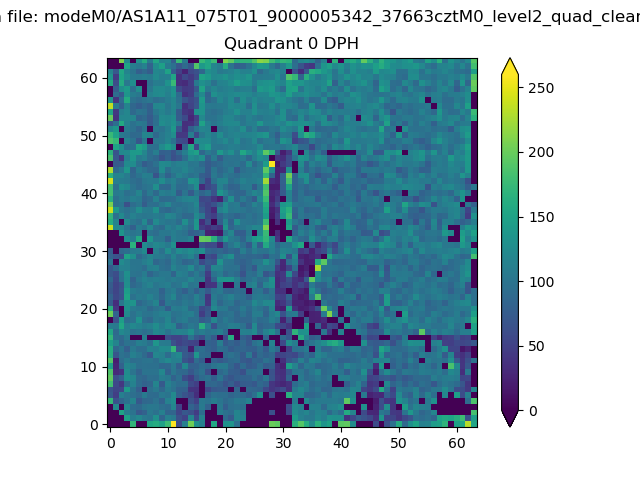 |
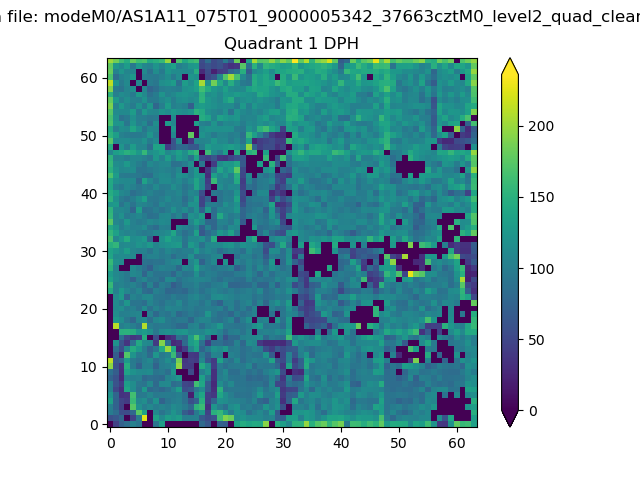 |
Quadrant B |
|---|---|---|---|
| Quadrant D | 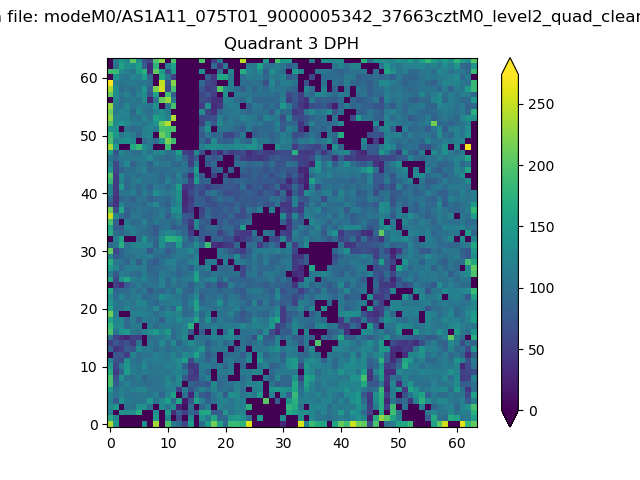 |
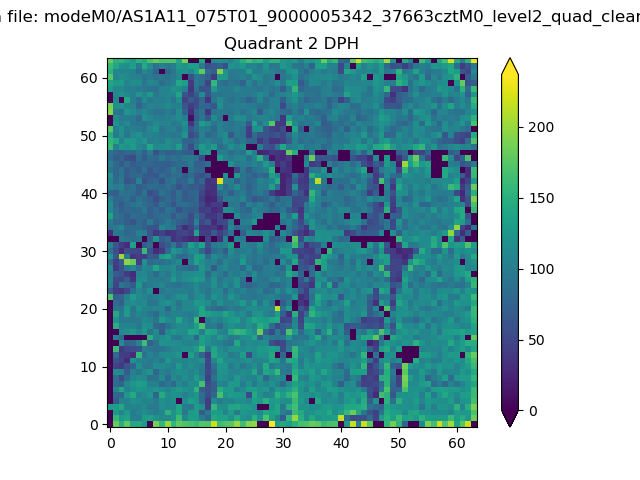 |
Quadrant C |
| Plot type | Count rate plots | Images |
|---|---|---|
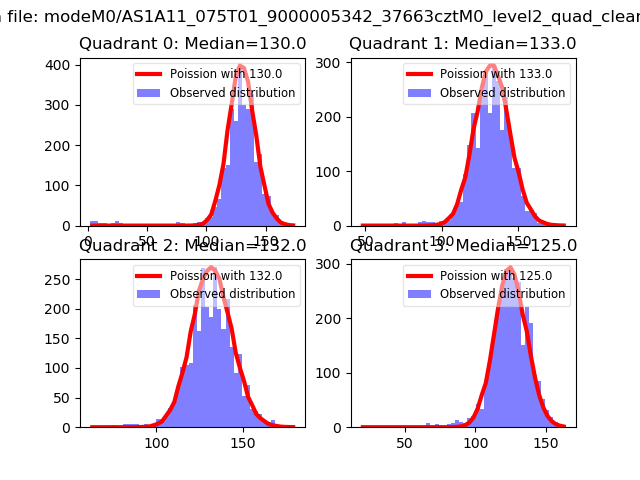
| Comparison with Poisson distribution Blue bars denote a histogram of data divided into 1 sec bins. Red curve is a Poisson curve with rate = median count rate of data. |
 |
 |
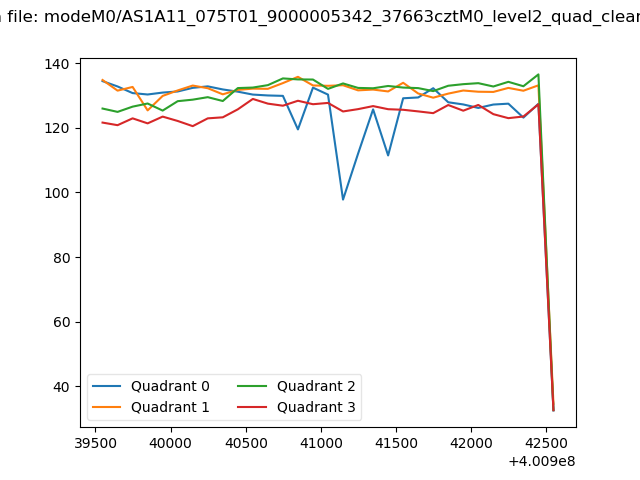
| Quadrant-wise count rates Data is divided into 100 sec bins |
 |
|
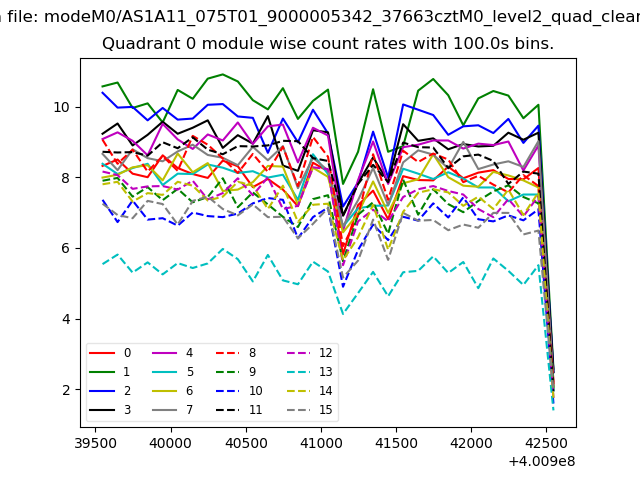
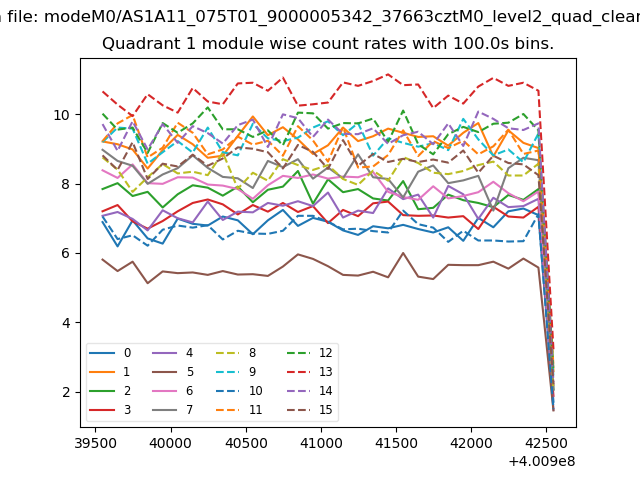
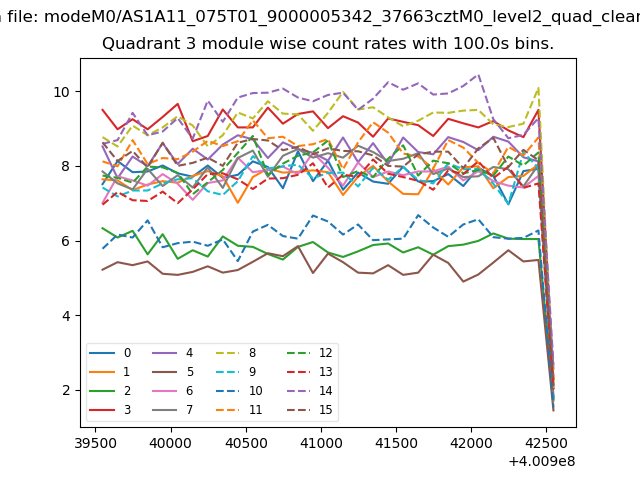
| Module-wise count rates for Quadrant A Data is divided into 100 sec bins |
 |
 |
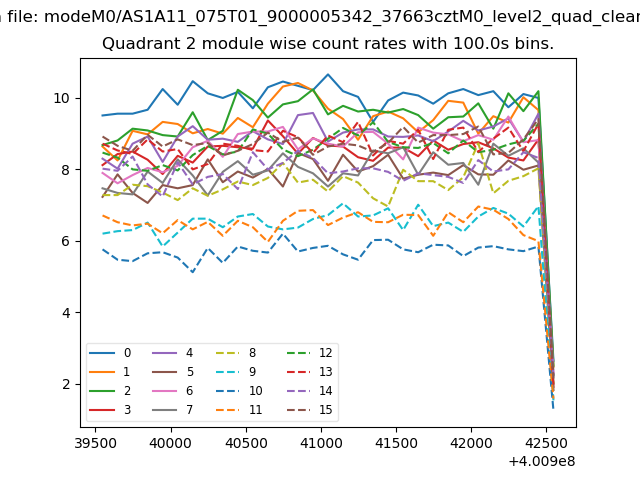
| Module-wise count rates for Quadrant B Data is divided into 100 sec bins |
 |
 |
| Module-wise count rates for Quadrant C Data is divided into 100 sec bins |
 |
 |
| Module-wise count rates for Quadrant D Data is divided into 100 sec bins |
 |
 |
| Parameter | Plot |
|---|---|
| CZT HV Monitor |  |
| D_VDD | 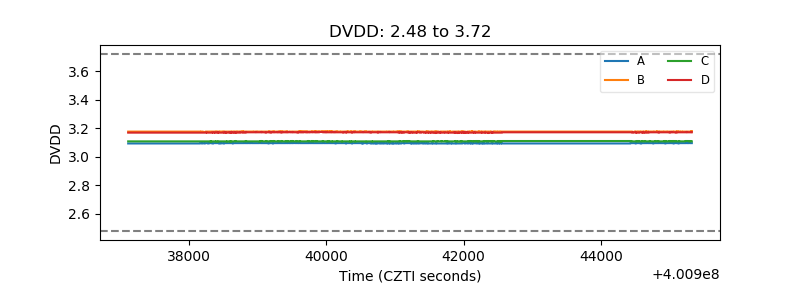 |
| Temperature 1 | 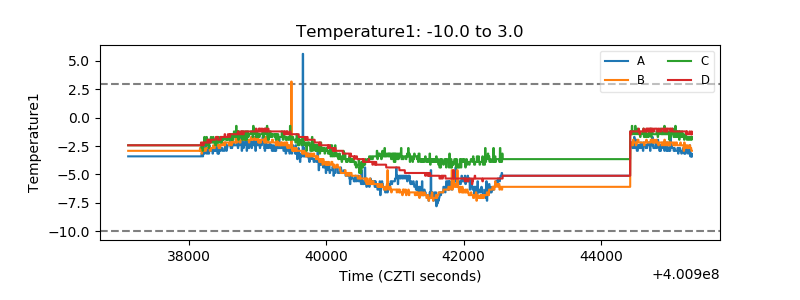 |
| Veto HV Monitor | 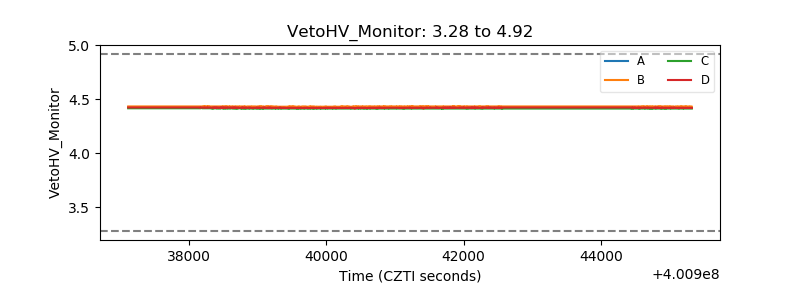 |
| Veto LLD | 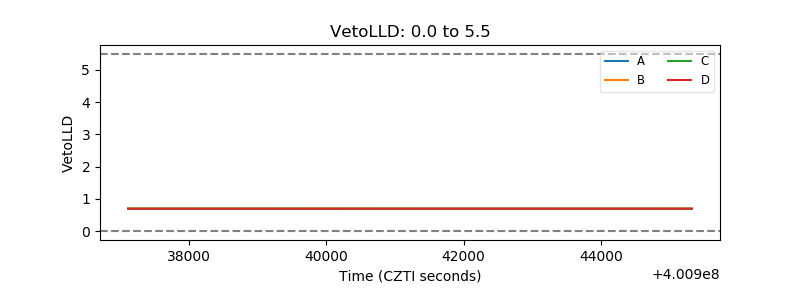 |
| Alpha Counter | 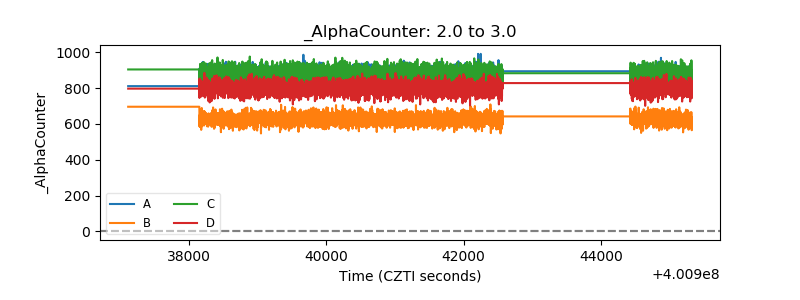 |
| _CPM_Rate | 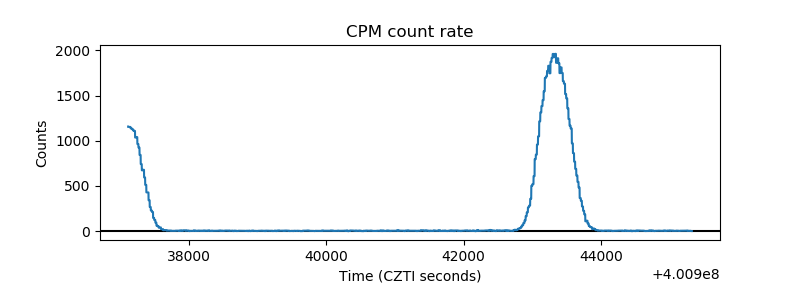 |
| CZT Counter | 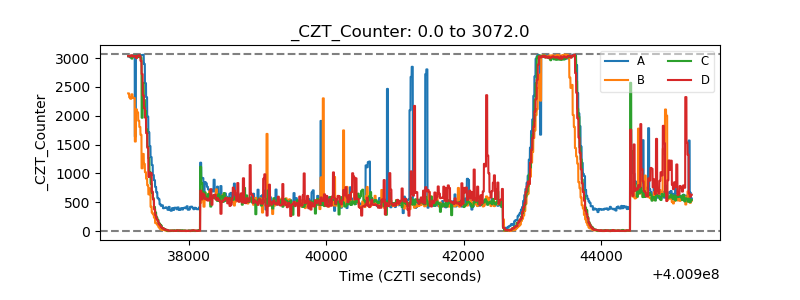 |
| +2.5 Volts monitor | 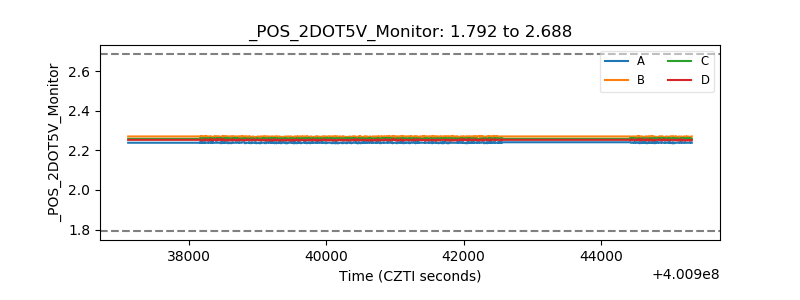 |
| +5 Volts monitor | 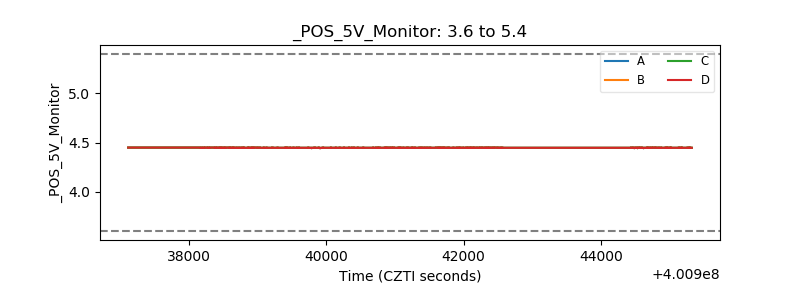 |
| _ROLL_ROT | 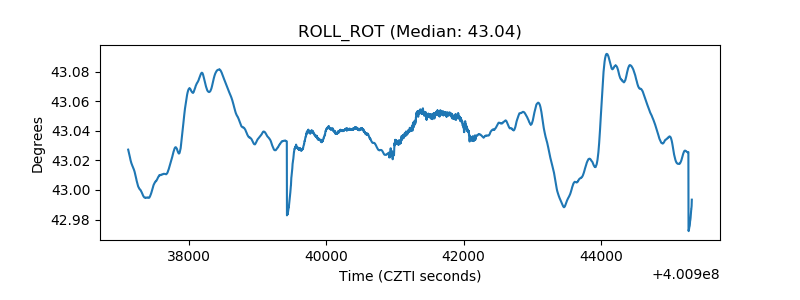 |
| _Roll_DEC | 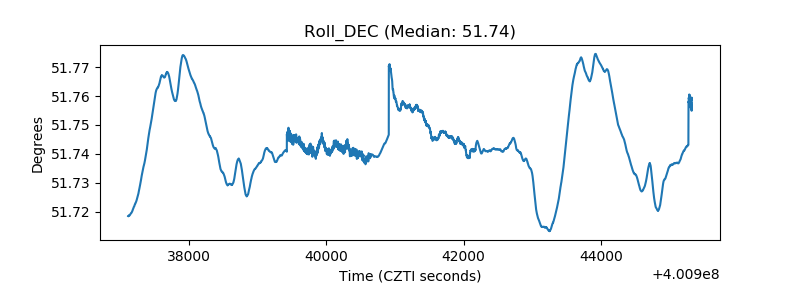 |
| _Roll_RA | 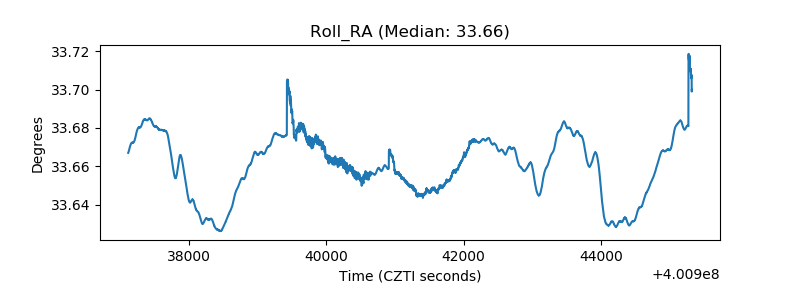 |
| Veto Counter | 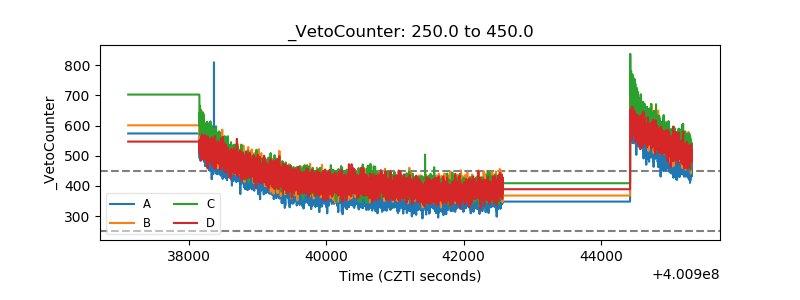 |