| Param | Original file | Final file |
|---|---|---|
| Filename | modeM0/AS1A11_075T01_9000005342_37665cztM0_level2.evt | modeM0/AS1A11_075T01_9000005342_37665cztM0_level2_quad_clean.evt |
| Size (bytes) | 438,272,640 | 92,427,840 |
| Size | 418.0 MB | 88.1 MB |
| Events in quadrant A | 3,517,328 | 606,834 |
| Events in quadrant B | 2,922,243 | 632,887 |
| Events in quadrant C | 2,817,809 | 631,888 |
| Events in quadrant D | 3,685,337 | 585,799 |
| Mode SS | |||
|---|---|---|---|
| Quadrant | BADHDUFLAG | Total packets | Discarded packets |
| A | 0 | 100 | 0 |
| B | 0 | 100 | 0 |
| C | 0 | 100 | 0 |
| D | 0 | 100 | 0 |
| Mode M0 | |||
|---|---|---|---|
| Quadrant | BADHDUFLAG | Total packets | Discarded packets |
| A | 0 | 13965 | 3 |
| B | 0 | 11739 | 2 |
| C | 0 | 11350 | 2 |
| D | 0 | 14384 | 2 |
| Mode M9 | |||
|---|---|---|---|
| Quadrant | BADHDUFLAG | Total packets | Discarded packets |
| A | 0 | 37 | 0 |
| B | 0 | 37 | 0 |
| C | 0 | 37 | 0 |
| D | 0 | 38 | 0 |
| Quadrant | Total seconds | Saturated seconds | Saturation percentage |
|---|---|---|---|
| A | 4868 | 50 | 1.027116% |
| B | 4868 | 152 | 3.122432% |
| C | 4868 | 52 | 1.068200% |
| D | 4868 | 173 | 3.553821% |
Noise dominated data is calculated using 1-second bins in cleaned event files. If a bin has >2000 counts, and if more than 50% of those come from <1% of pixels, then it is considered to be noise-dominated and hence unusable.
| Quadrant | # 1 sec bins | Bins with >0 counts | Bins with >2000 counts | High rate bins dominated by noise | Noise dominated (total time) | Noise dominated (detector-on time) | Marked lightcurve |
|---|---|---|---|---|---|---|---|
| A | 6962 | 4869 | 28 | 28 | 0.40% | 0.58% | 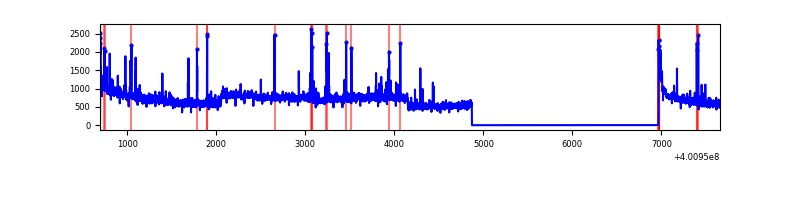 |
| B | 6961 | 4867 | 108 | 108 | 1.55% | 2.22% | 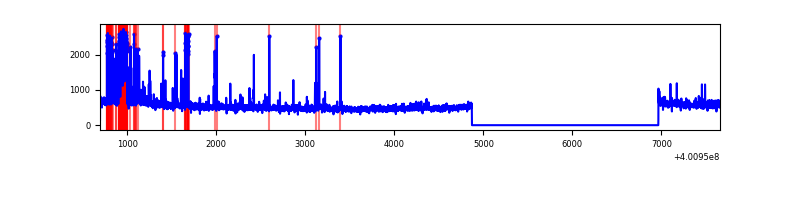 |
| C | 6961 | 4867 | 41 | 41 | 0.59% | 0.84% | 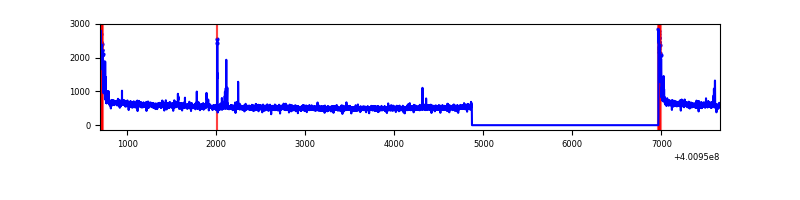 |
| D | 6961 | 4867 | 162 | 162 | 2.33% | 3.33% | 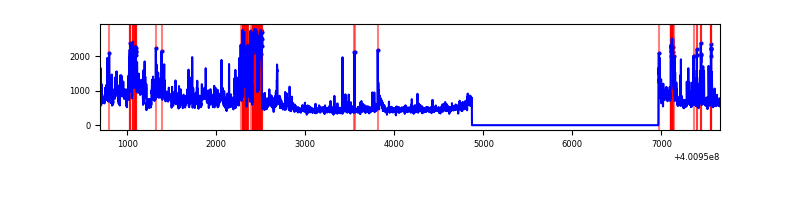 |
Top three noisy pixels from each quadrant. If the there are fewer than three noisy pixels in the level2.evt file, extra rows are filled as -1
| Pixel properties | Quadrant properties | ||||||
|---|---|---|---|---|---|---|---|
| Quadrant | DetID | PixID | Counts | Sigma | Mean | Median | Sigma |
| A | 15 | 222 | 650603 | 5316.22 | 617 | 607 | 122.3 |
| A | 10 | 83 | 306696 | 2503.45 | 617 | 607 | 122.3 |
| A | 9 | 143 | 100123 | 813.93 | 617 | 607 | 122.3 |
| B | 5 | 172 | 347687 | 3016.47 | 614 | 600 | 115.1 |
| B | 0 | 230 | 44199 | 378.91 | 614 | 600 | 115.1 |
| B | 15 | 85 | 30817 | 262.61 | 614 | 600 | 115.1 |
| C | 15 | 214 | 224251 | 1589.7 | 616 | 623 | 140.7 |
| C | 0 | 10 | 147369 | 1043.17 | 616 | 623 | 140.7 |
| C | 14 | 254 | 14511 | 98.73 | 616 | 623 | 140.7 |
| D | 12 | 227 | 701041 | 4762.78 | 608 | 593 | 147.1 |
| D | 1 | 47 | 307830 | 2089.1 | 608 | 593 | 147.1 |
| D | 2 | 249 | 73764 | 497.54 | 608 | 593 | 147.1 |
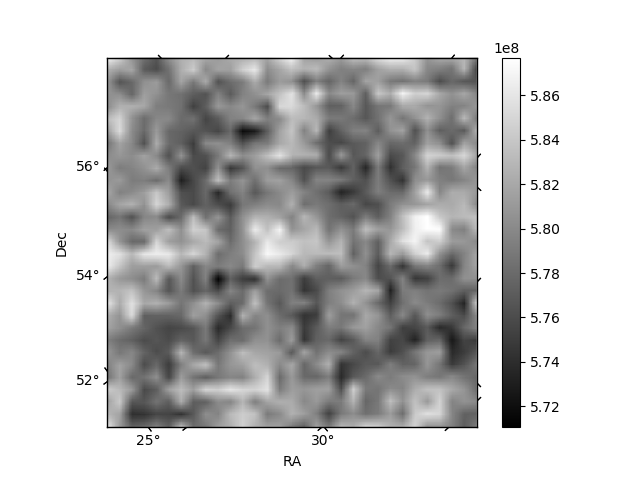
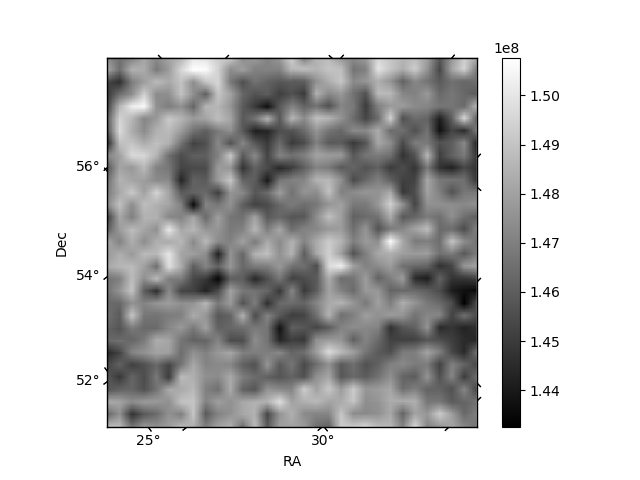
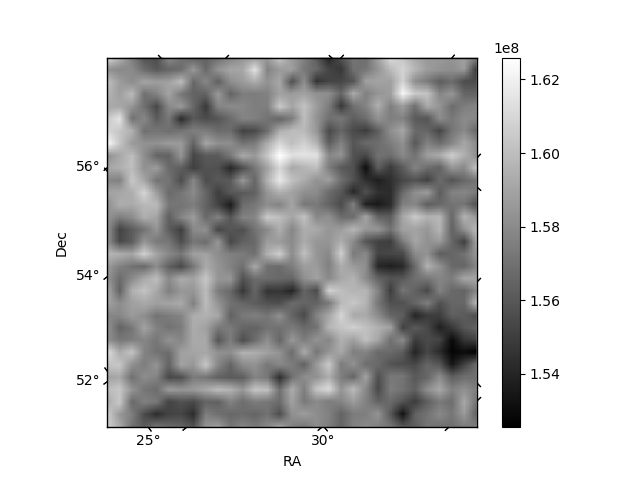
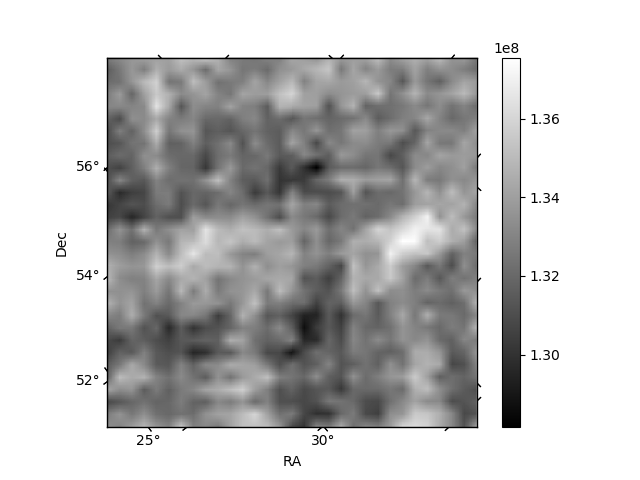
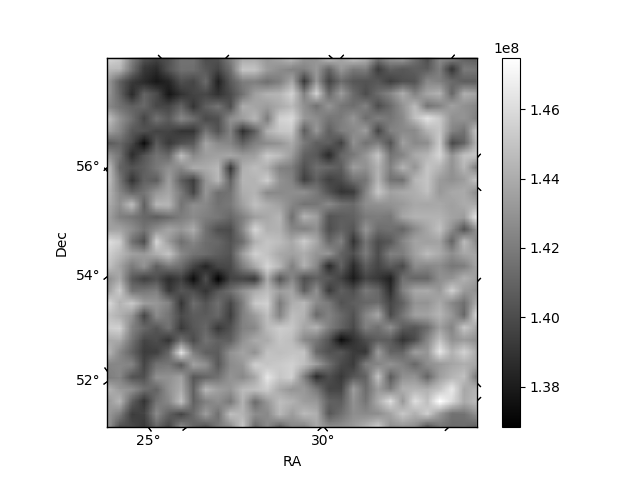
Histogram calculated using DETX and DETY for each event in the final _common_clean file
| Quadrant A | 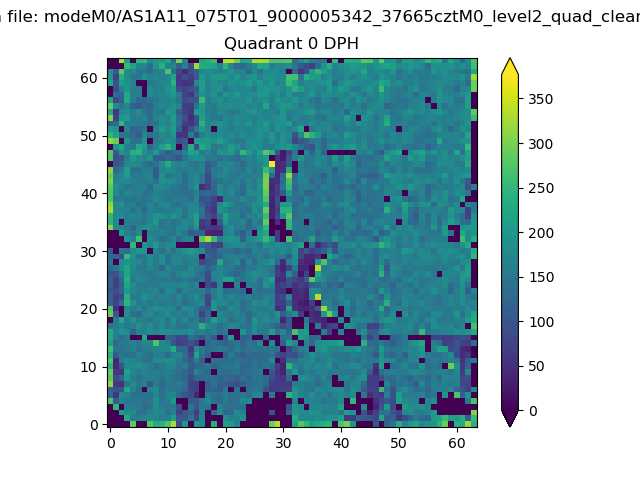 |
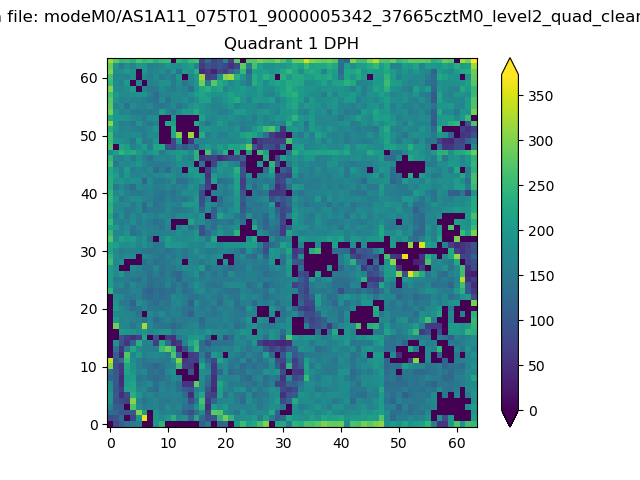 |
Quadrant B |
|---|---|---|---|
| Quadrant D | 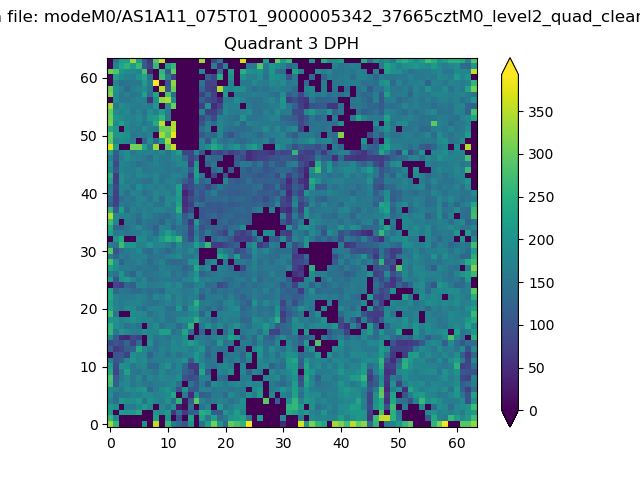 |
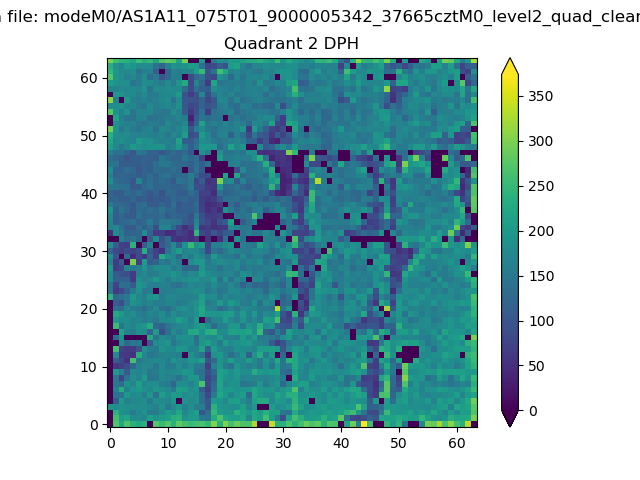 |
Quadrant C |
| Plot type | Count rate plots | Images |
|---|---|---|
| Comparison with Poisson distribution Blue bars denote a histogram of data divided into 1 sec bins. Red curve is a Poisson curve with rate = median count rate of data. |
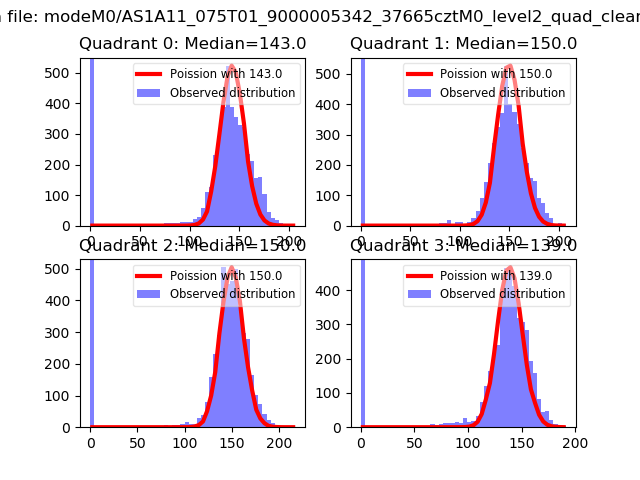 |
 |
| Quadrant-wise count rates Data is divided into 100 sec bins |
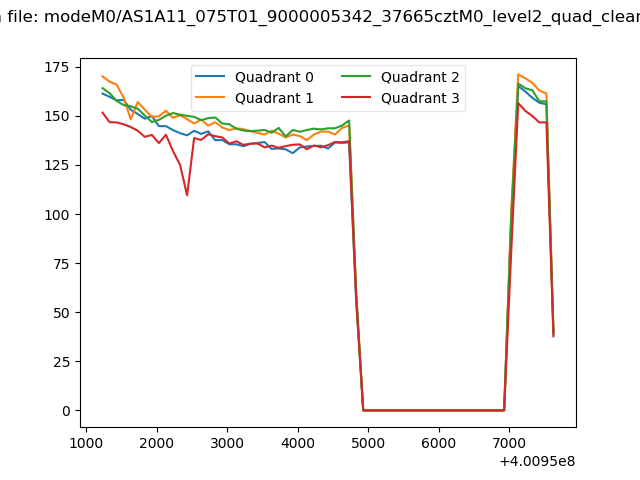 |
|
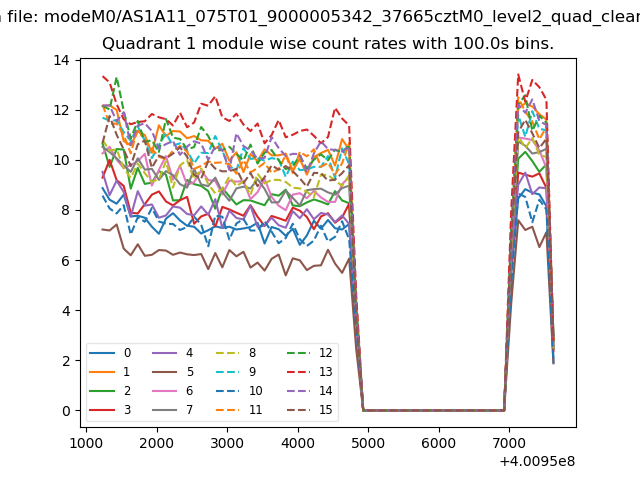
| Module-wise count rates for Quadrant A Data is divided into 100 sec bins |
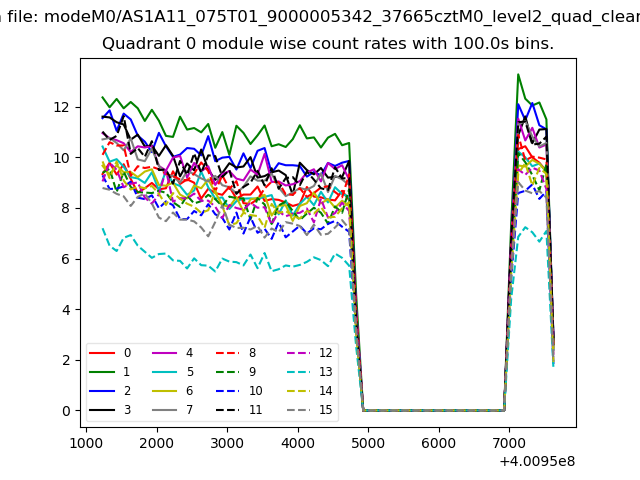 |
 |
| Module-wise count rates for Quadrant B Data is divided into 100 sec bins |
 |
 |
| Module-wise count rates for Quadrant C Data is divided into 100 sec bins |
 |
 |
| Module-wise count rates for Quadrant D Data is divided into 100 sec bins |
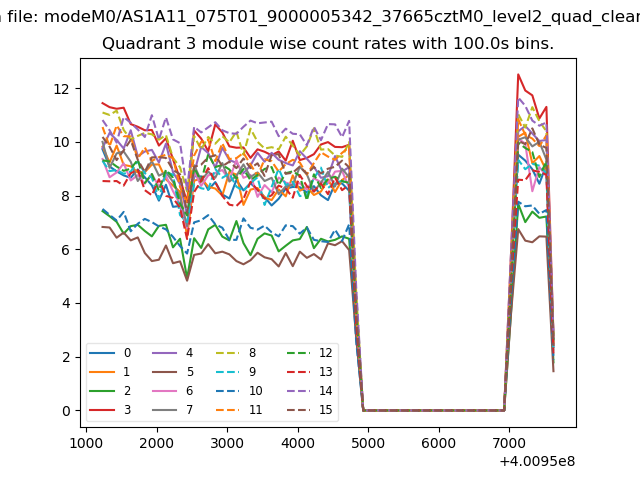 |
 |
| Parameter | Plot |
|---|---|
| CZT HV Monitor | 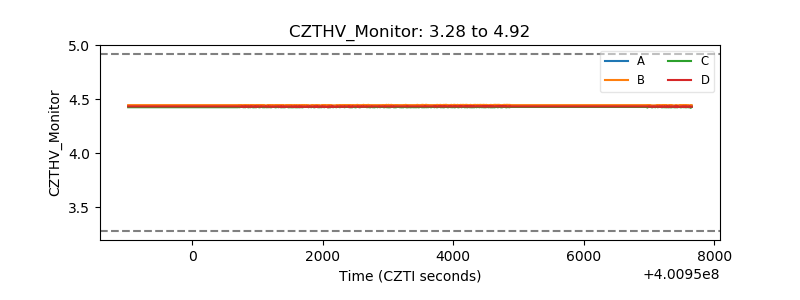 |
| D_VDD | 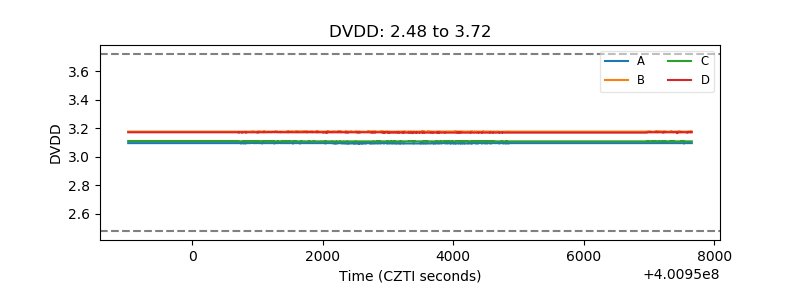 |
| Temperature 1 | 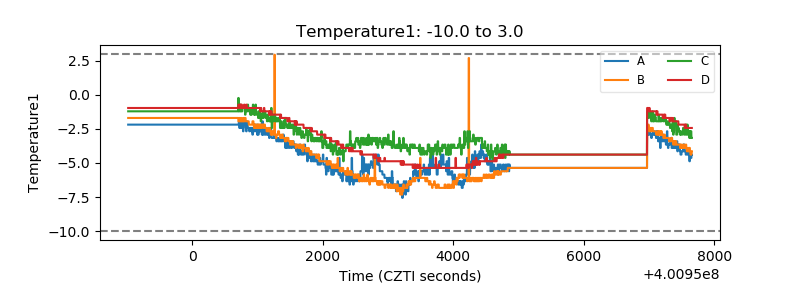 |
| Veto HV Monitor | 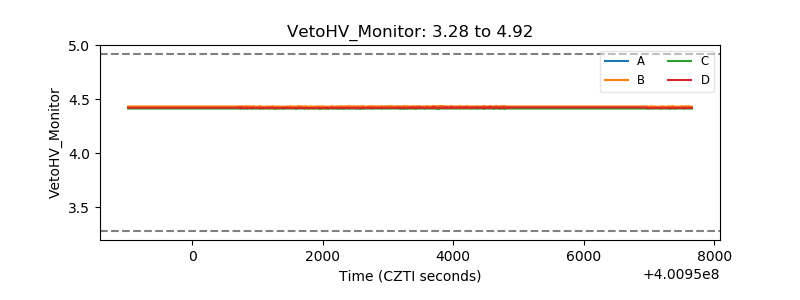 |
| Veto LLD | 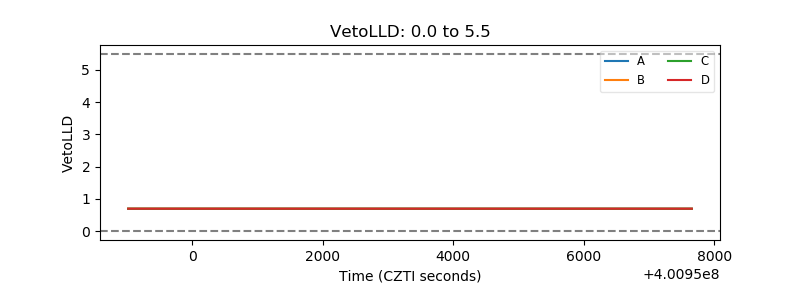 |
| Alpha Counter | 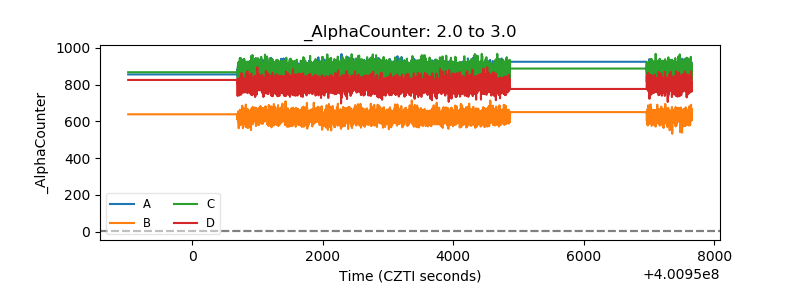 |
| _CPM_Rate | 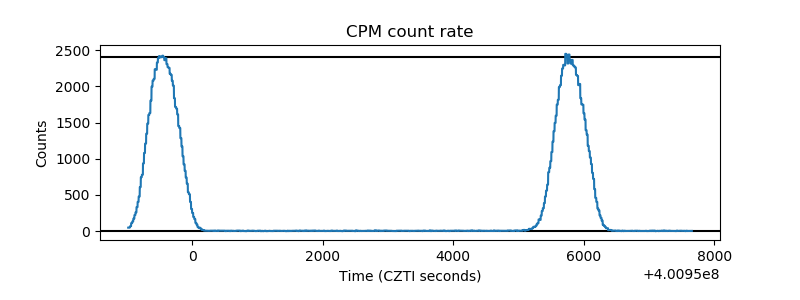 |
| CZT Counter | 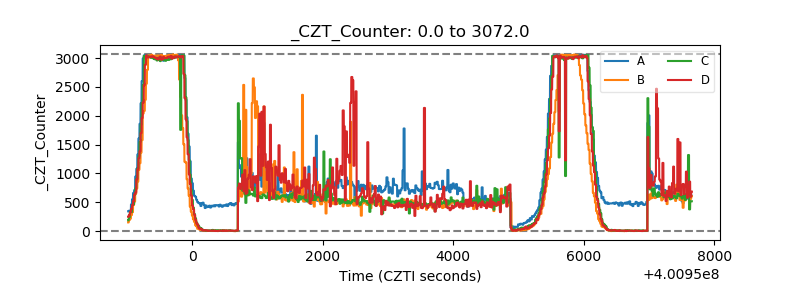 |
| +2.5 Volts monitor | 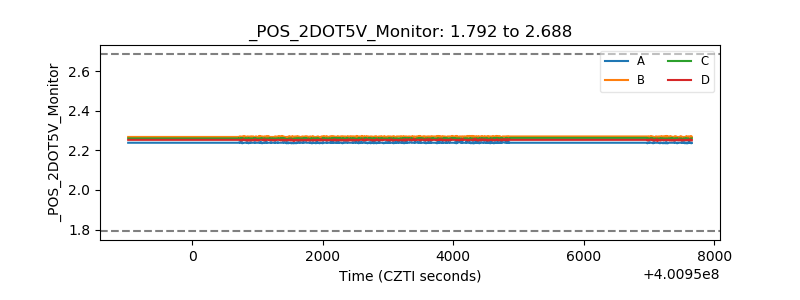 |
| +5 Volts monitor | 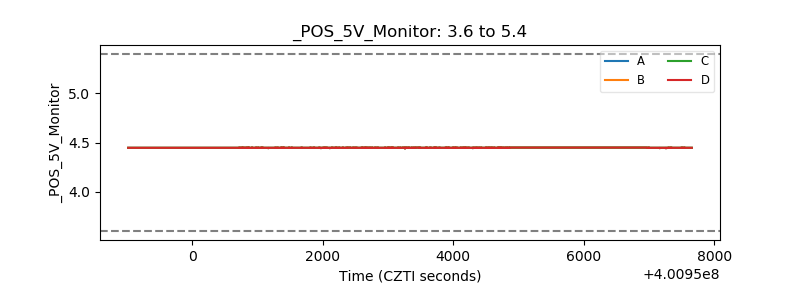 |
| _ROLL_ROT | 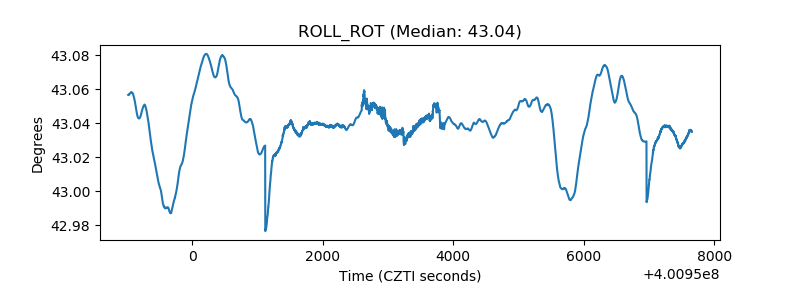 |
| _Roll_DEC | 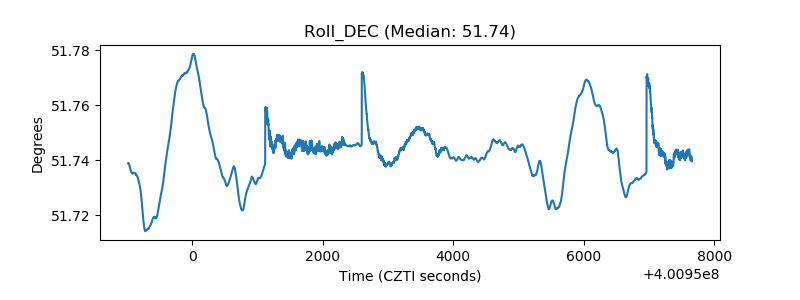 |
| _Roll_RA | 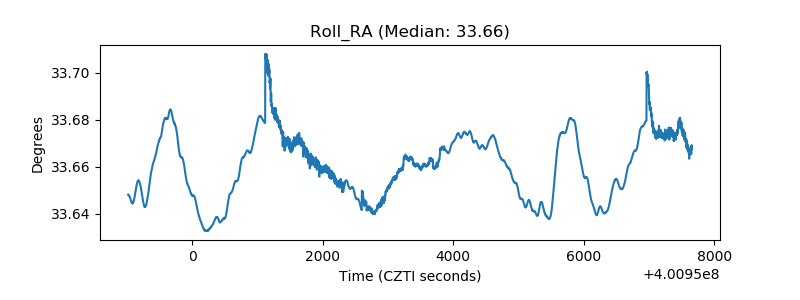 |
| Veto Counter | 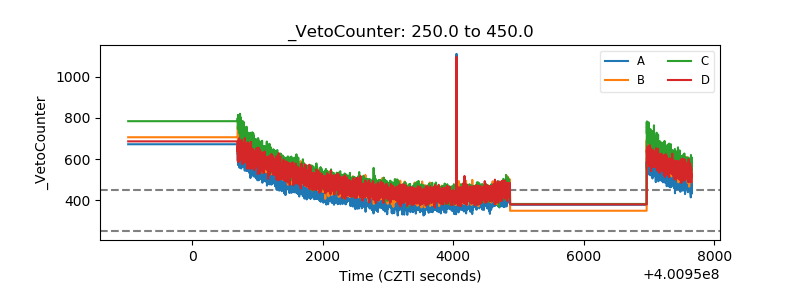 |