| Param | Original file | Final file |
|---|---|---|
| Filename | modeM0/AS1A11_075T01_9000005342_37668cztM0_level2.evt | modeM0/AS1A11_075T01_9000005342_37668cztM0_level2_quad_clean.evt |
| Size (bytes) | 392,688,000 | 78,298,560 |
| Size | 374.5 MB | 74.7 MB |
| Events in quadrant A | 3,069,561 | 485,910 |
| Events in quadrant B | 2,832,492 | 503,394 |
| Events in quadrant C | 2,926,588 | 508,608 |
| Events in quadrant D | 2,684,100 | 482,564 |
| Mode SS | |||
|---|---|---|---|
| Quadrant | BADHDUFLAG | Total packets | Discarded packets |
| A | 0 | 114 | 0 |
| B | 0 | 114 | 0 |
| C | 0 | 114 | 0 |
| D | 0 | 114 | 0 |
| Mode M0 | |||
|---|---|---|---|
| Quadrant | BADHDUFLAG | Total packets | Discarded packets |
| A | 0 | 12774 | 3 |
| B | 0 | 12082 | 2 |
| C | 0 | 11982 | 2 |
| D | 0 | 11917 | 2 |
| Mode M9 | |||
|---|---|---|---|
| Quadrant | BADHDUFLAG | Total packets | Discarded packets |
| A | 0 | 41 | 0 |
| B | 0 | 41 | 0 |
| C | 0 | 41 | 0 |
| D | 0 | 41 | 0 |
| Quadrant | Total seconds | Saturated seconds | Saturation percentage |
|---|---|---|---|
| A | 5588 | 28 | 0.501074% |
| B | 5588 | 48 | 0.858984% |
| C | 5588 | 52 | 0.930565% |
| D | 5588 | 15 | 0.268432% |
Noise dominated data is calculated using 1-second bins in cleaned event files. If a bin has >2000 counts, and if more than 50% of those come from <1% of pixels, then it is considered to be noise-dominated and hence unusable.
| Quadrant | # 1 sec bins | Bins with >0 counts | Bins with >2000 counts | High rate bins dominated by noise | Noise dominated (total time) | Noise dominated (detector-on time) | Marked lightcurve |
|---|---|---|---|---|---|---|---|
| A | 9655 | 5590 | 18 | 18 | 0.19% | 0.32% | 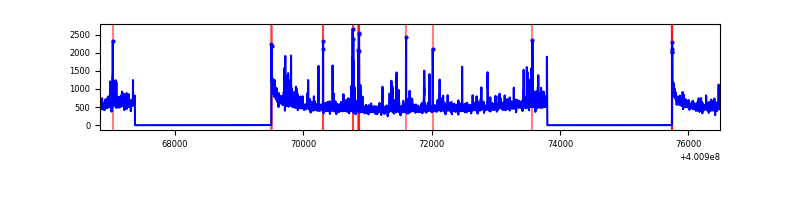 |
| B | 9655 | 5588 | 29 | 29 | 0.30% | 0.52% | 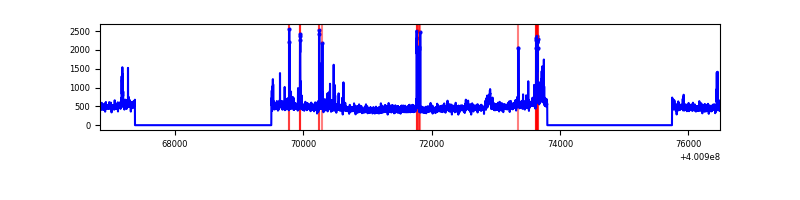 |
| C | 9655 | 5588 | 48 | 48 | 0.50% | 0.86% | 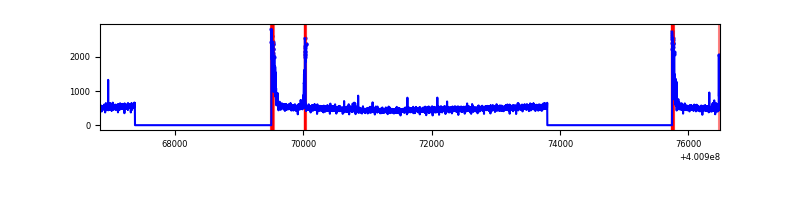 |
| D | 9655 | 5588 | 13 | 13 | 0.13% | 0.23% | 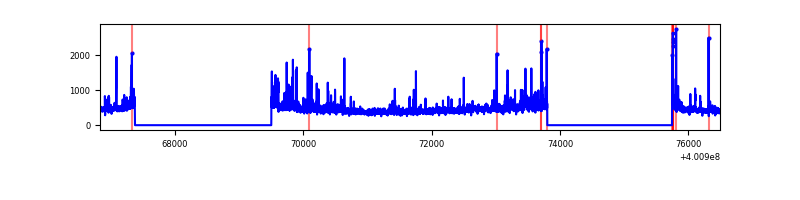 |
Top three noisy pixels from each quadrant. If the there are fewer than three noisy pixels in the level2.evt file, extra rows are filled as -1
| Pixel properties | Quadrant properties | ||||||
|---|---|---|---|---|---|---|---|
| Quadrant | DetID | PixID | Counts | Sigma | Mean | Median | Sigma |
| A | 10 | 83 | 309788 | 2436.05 | 633 | 619 | 126.9 |
| A | 15 | 222 | 93926 | 735.2 | 633 | 619 | 126.9 |
| A | 6 | 10 | 88833 | 695.07 | 633 | 619 | 126.9 |
| B | 5 | 172 | 154793 | 1258.44 | 636 | 618 | 122.5 |
| B | 0 | 230 | 50011 | 403.17 | 636 | 618 | 122.5 |
| B | 0 | 189 | 44719 | 359.97 | 636 | 618 | 122.5 |
| C | 15 | 214 | 259978 | 1793.45 | 627 | 632 | 144.6 |
| C | 0 | 10 | 159087 | 1095.76 | 627 | 632 | 144.6 |
| C | 14 | 254 | 58161 | 397.83 | 627 | 632 | 144.6 |
| D | 2 | 153 | 49099 | 320.38 | 622 | 606 | 151.4 |
| D | 7 | 38 | 40812 | 265.63 | 622 | 606 | 151.4 |
| D | 13 | 249 | 37165 | 241.53 | 622 | 606 | 151.4 |
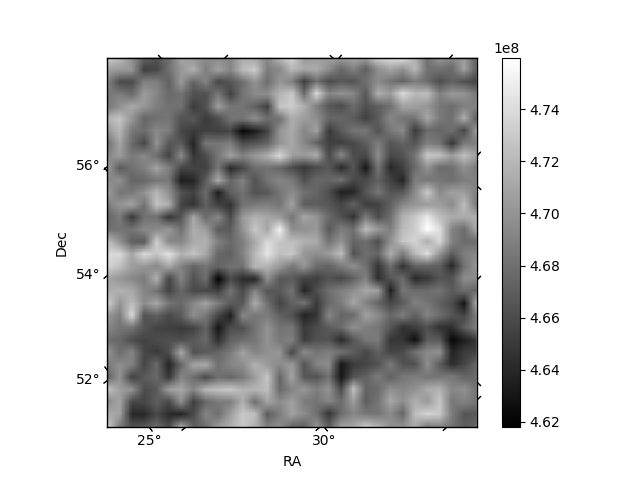
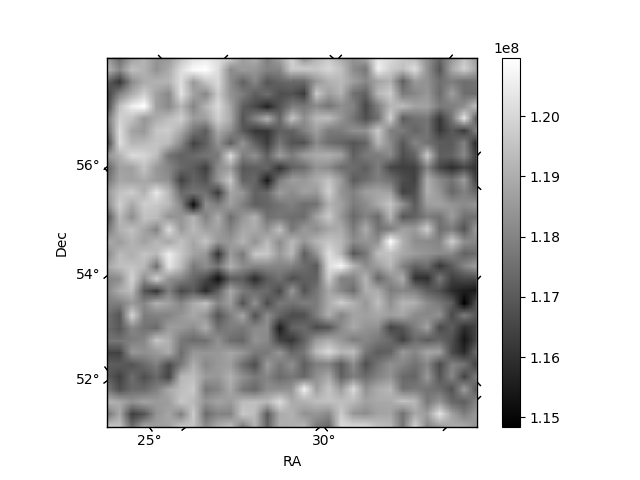
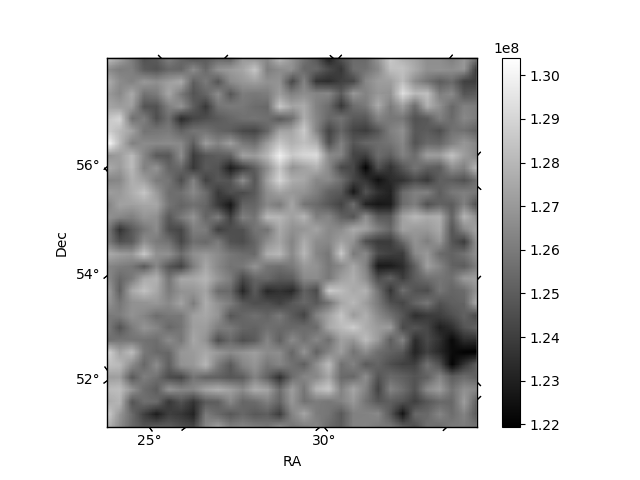
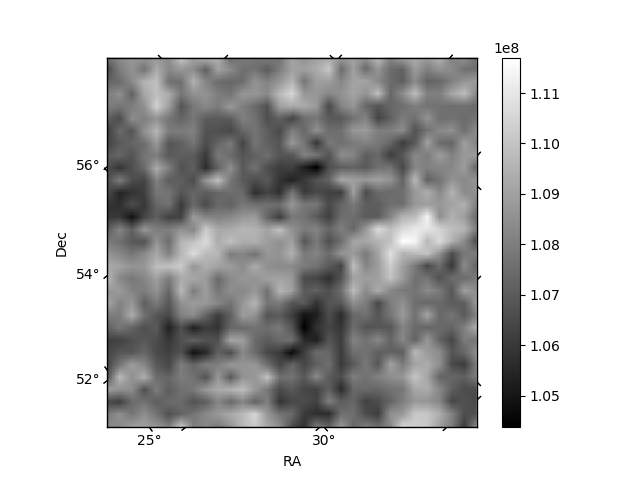
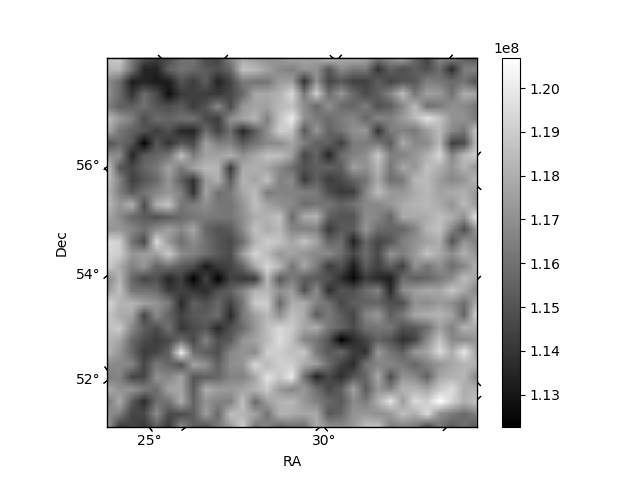
Histogram calculated using DETX and DETY for each event in the final _common_clean file
| Quadrant A | 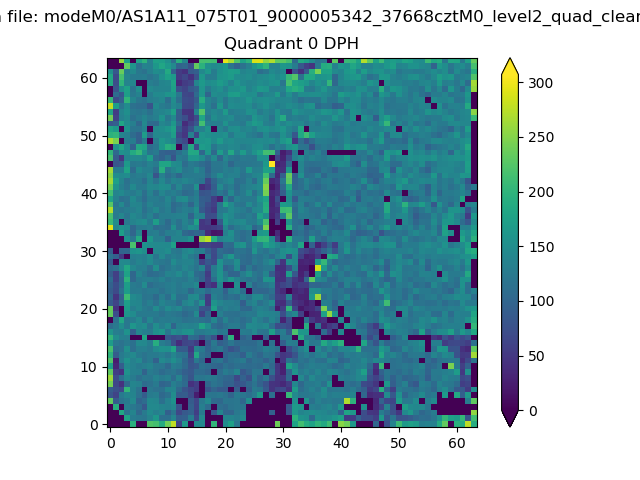 |
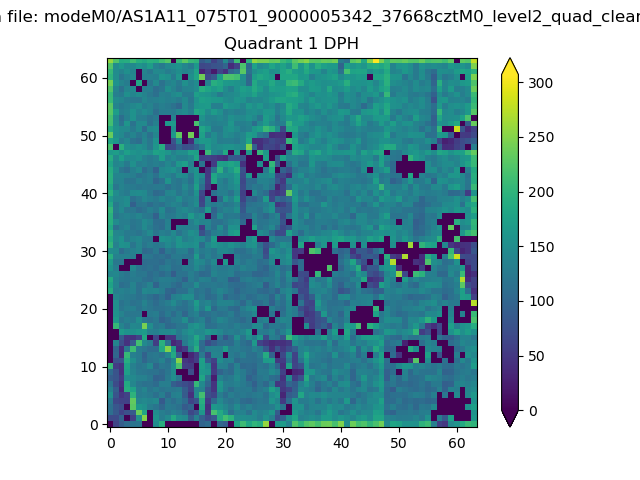 |
Quadrant B |
|---|---|---|---|
| Quadrant D | 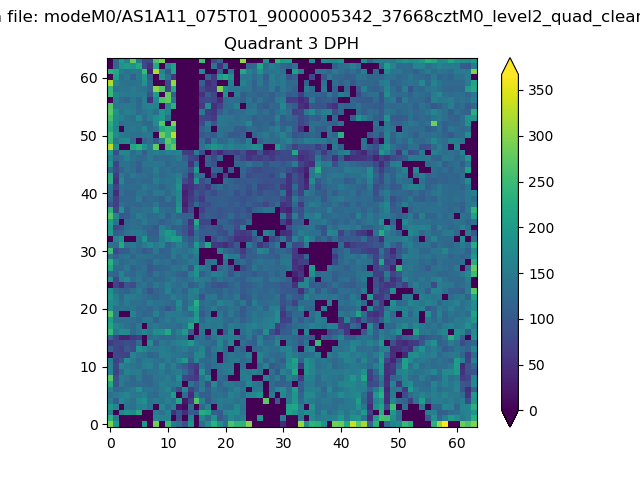 |
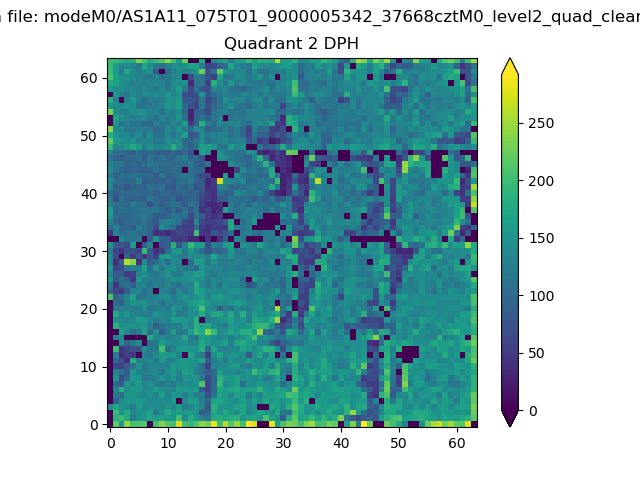 |
Quadrant C |
| Plot type | Count rate plots | Images |
|---|---|---|
| Comparison with Poisson distribution Blue bars denote a histogram of data divided into 1 sec bins. Red curve is a Poisson curve with rate = median count rate of data. |
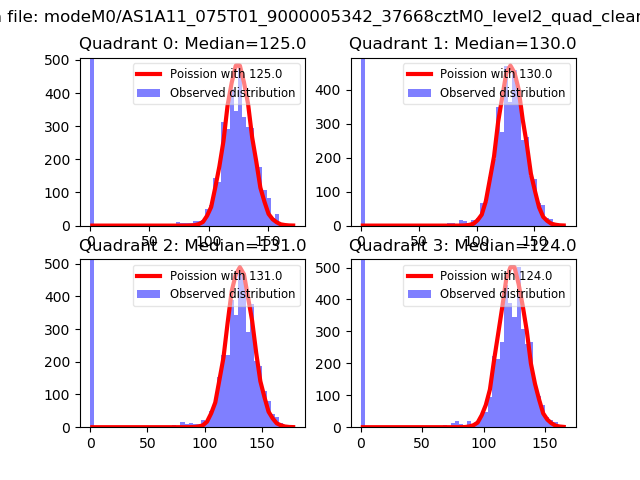 |
 |
| Quadrant-wise count rates Data is divided into 100 sec bins |
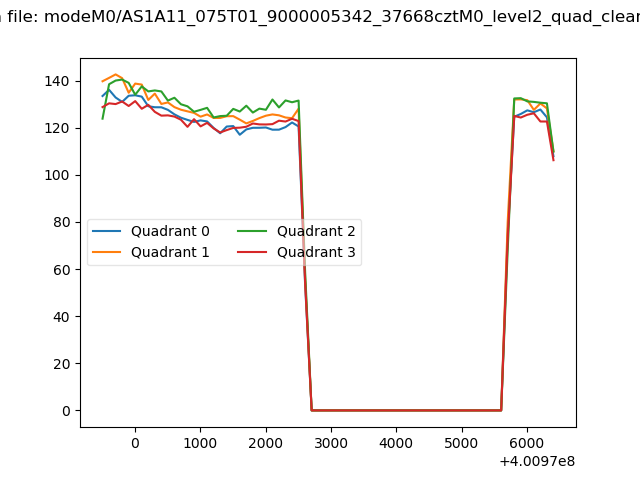 |
|
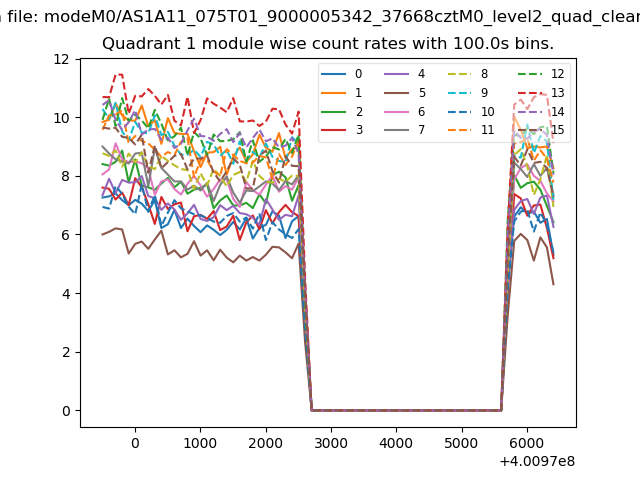
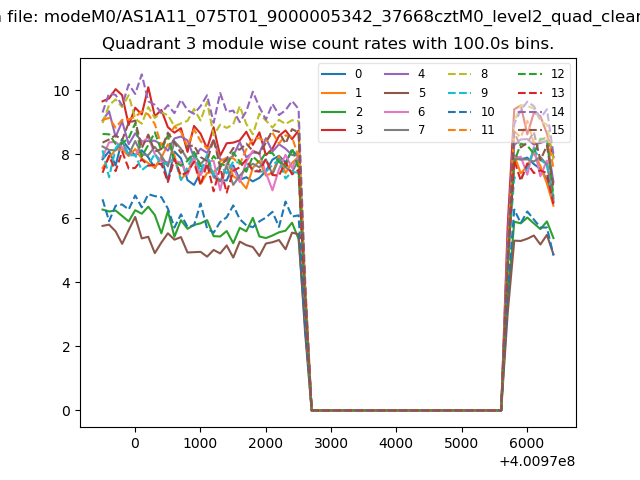
| Module-wise count rates for Quadrant A Data is divided into 100 sec bins |
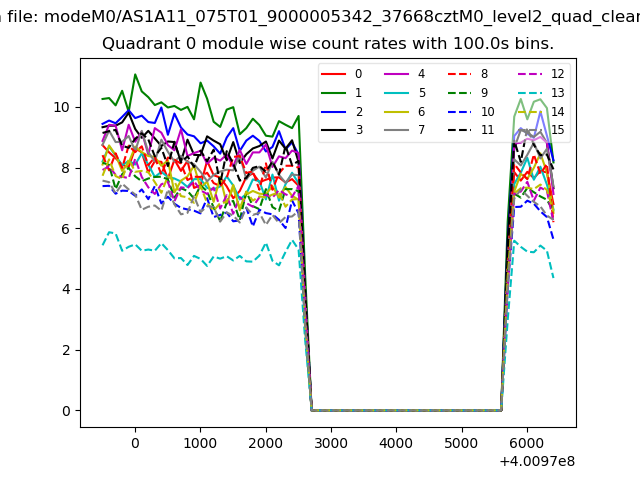 |
 |
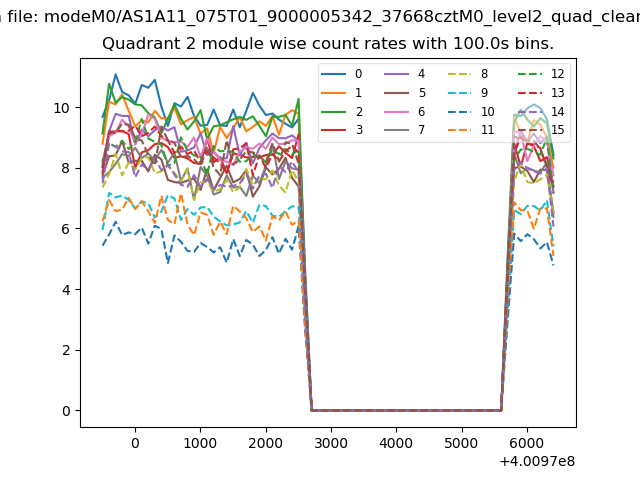
| Module-wise count rates for Quadrant B Data is divided into 100 sec bins |
 |
 |
| Module-wise count rates for Quadrant C Data is divided into 100 sec bins |
 |
 |
| Module-wise count rates for Quadrant D Data is divided into 100 sec bins |
 |
 |
| Parameter | Plot |
|---|---|
| CZT HV Monitor |  |
| D_VDD | 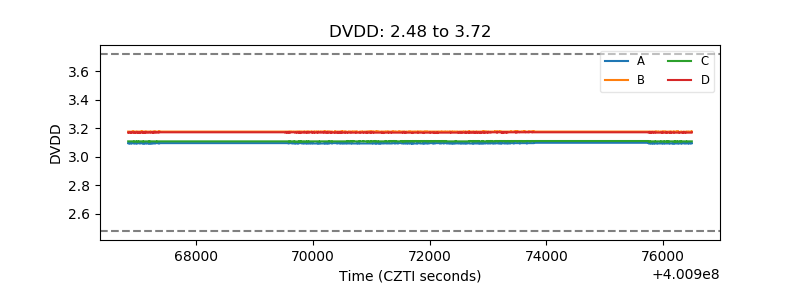 |
| Temperature 1 | 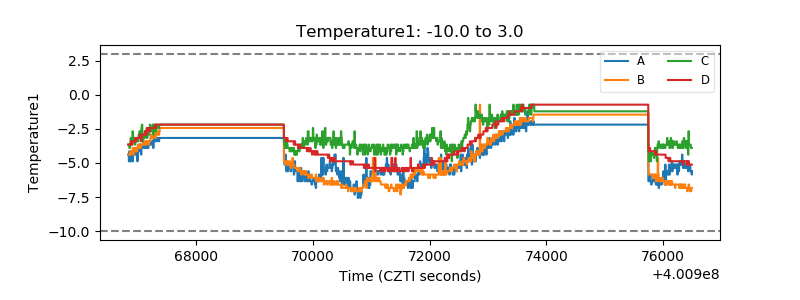 |
| Veto HV Monitor | 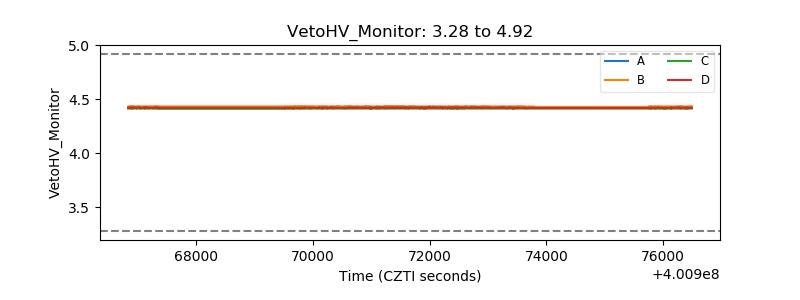 |
| Veto LLD | 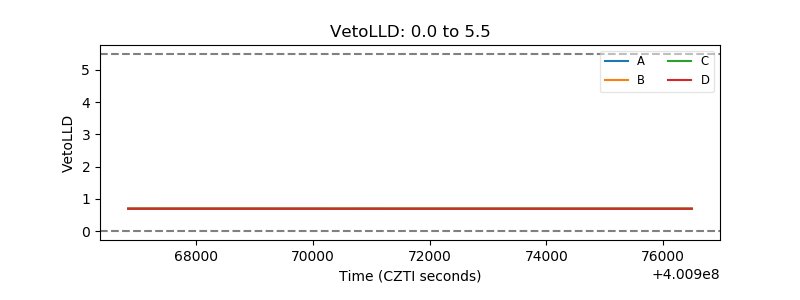 |
| Alpha Counter | 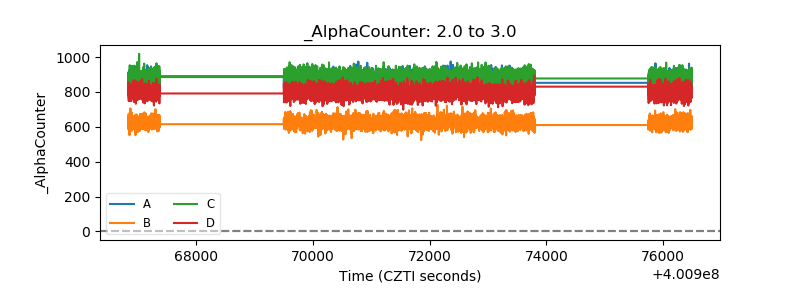 |
| _CPM_Rate |  |
| CZT Counter | 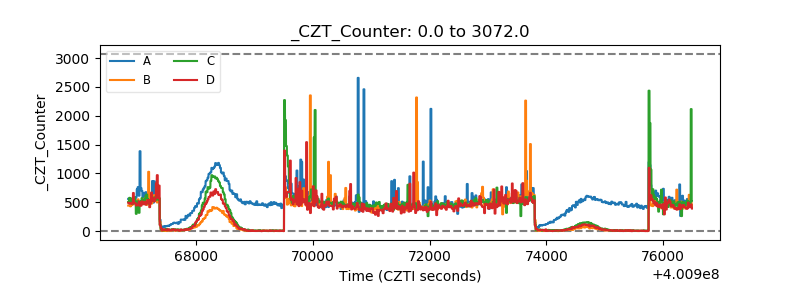 |
| +2.5 Volts monitor | 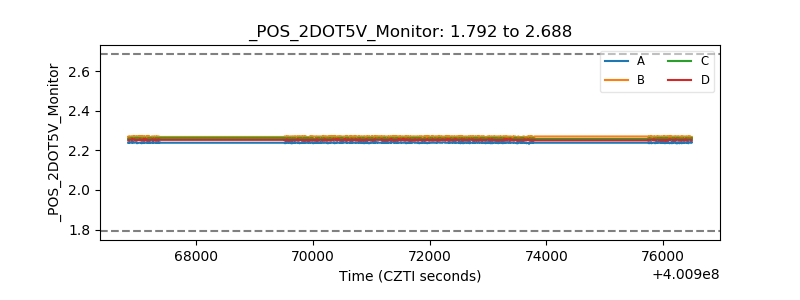 |
| +5 Volts monitor | 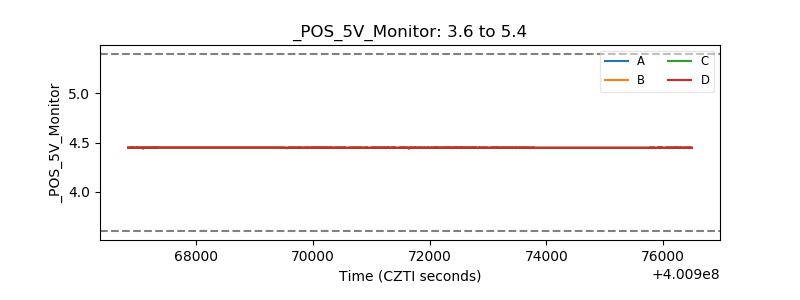 |
| _ROLL_ROT | 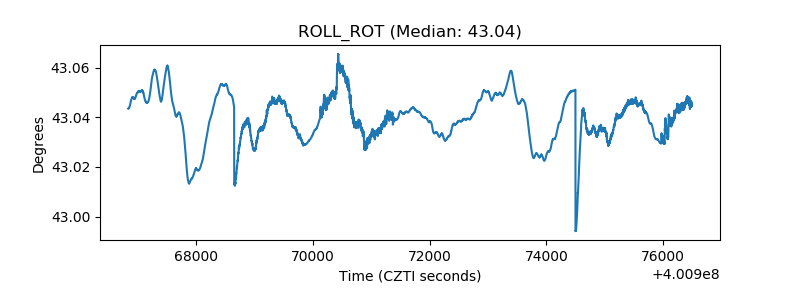 |
| _Roll_DEC | 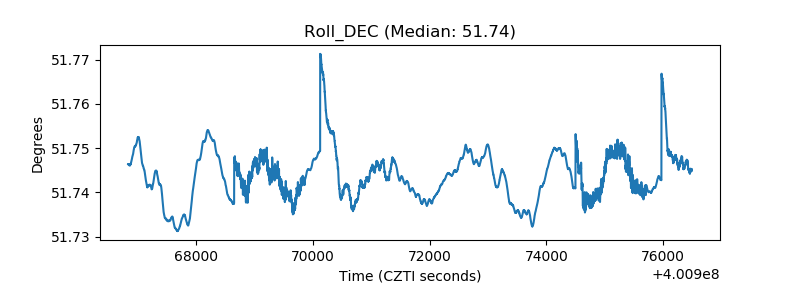 |
| _Roll_RA | 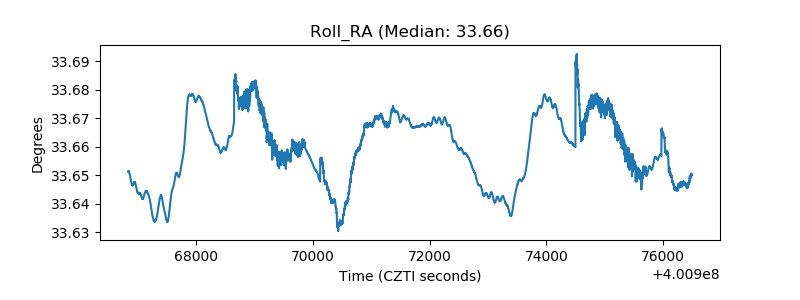 |
| Veto Counter | 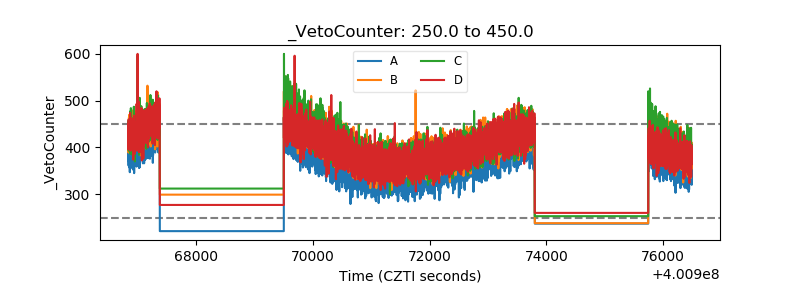 |