| Param | Original file | Final file |
|---|---|---|
| Filename | modeM0/AS1A11_075T01_9000005342_37670cztM0_level2.evt | modeM0/AS1A11_075T01_9000005342_37670cztM0_level2_quad_clean.evt |
| Size (bytes) | 425,655,360 | 76,034,880 |
| Size | 405.9 MB | 72.5 MB |
| Events in quadrant A | 3,243,783 | 461,024 |
| Events in quadrant B | 3,124,404 | 474,448 |
| Events in quadrant C | 3,151,791 | 479,502 |
| Events in quadrant D | 2,953,248 | 458,406 |
| Mode SS | |||
|---|---|---|---|
| Quadrant | BADHDUFLAG | Total packets | Discarded packets |
| A | 0 | 126 | 0 |
| B | 0 | 126 | 0 |
| C | 0 | 126 | 0 |
| D | 0 | 126 | 0 |
| Mode M0 | |||
|---|---|---|---|
| Quadrant | BADHDUFLAG | Total packets | Discarded packets |
| A | 0 | 13623 | 3 |
| B | 0 | 13560 | 2 |
| C | 0 | 13185 | 2 |
| D | 0 | 13173 | 2 |
| Mode M9 | |||
|---|---|---|---|
| Quadrant | BADHDUFLAG | Total packets | Discarded packets |
| A | 0 | 30 | 0 |
| B | 0 | 30 | 0 |
| C | 0 | 30 | 0 |
| D | 0 | 30 | 0 |
| Quadrant | Total seconds | Saturated seconds | Saturation percentage |
|---|---|---|---|
| A | 6147 | 16 | 0.260290% |
| B | 6147 | 80 | 1.301448% |
| C | 6147 | 27 | 0.439239% |
| D | 6147 | 36 | 0.585652% |
Noise dominated data is calculated using 1-second bins in cleaned event files. If a bin has >2000 counts, and if more than 50% of those come from <1% of pixels, then it is considered to be noise-dominated and hence unusable.
| Quadrant | # 1 sec bins | Bins with >0 counts | Bins with >2000 counts | High rate bins dominated by noise | Noise dominated (total time) | Noise dominated (detector-on time) | Marked lightcurve |
|---|---|---|---|---|---|---|---|
| A | 9132 | 6149 | 13 | 13 | 0.14% | 0.21% | 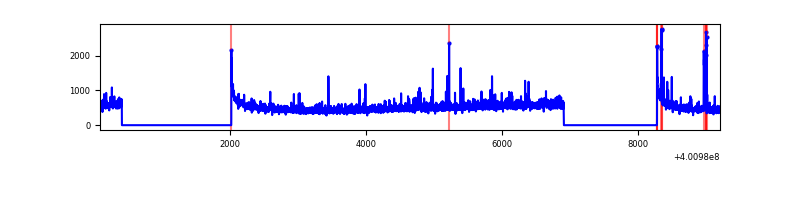 |
| B | 9132 | 6147 | 49 | 49 | 0.54% | 0.80% | 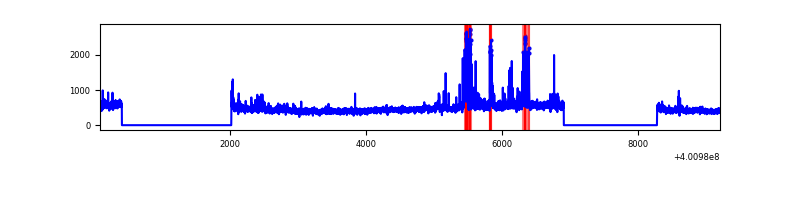 |
| C | 9132 | 6147 | 30 | 30 | 0.33% | 0.49% | 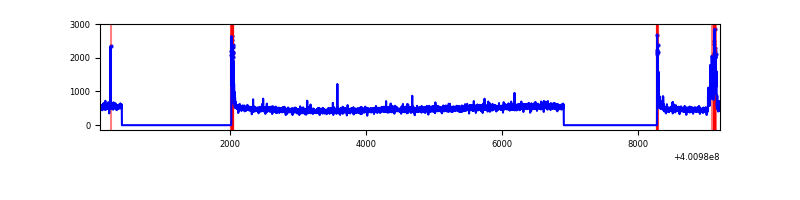 |
| D | 9132 | 6147 | 24 | 24 | 0.26% | 0.39% | 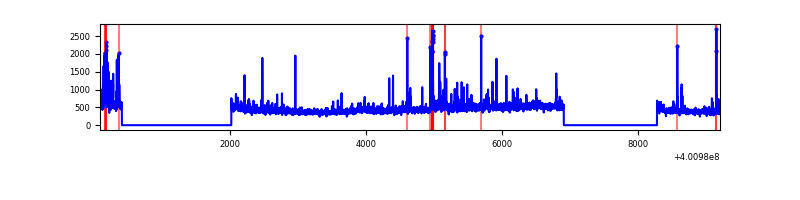 |
Top three noisy pixels from each quadrant. If the there are fewer than three noisy pixels in the level2.evt file, extra rows are filled as -1
| Pixel properties | Quadrant properties | ||||||
|---|---|---|---|---|---|---|---|
| Quadrant | DetID | PixID | Counts | Sigma | Mean | Median | Sigma |
| A | 10 | 83 | 341395 | 2467.36 | 687 | 673 | 138.1 |
| A | 6 | 10 | 109683 | 789.4 | 687 | 673 | 138.1 |
| A | 9 | 143 | 92859 | 667.57 | 687 | 673 | 138.1 |
| B | 5 | 172 | 197741 | 1492.63 | 686 | 669 | 132.0 |
| B | 15 | 85 | 70259 | 527.08 | 686 | 669 | 132.0 |
| B | 0 | 230 | 65707 | 492.6 | 686 | 669 | 132.0 |
| C | 15 | 214 | 282897 | 1811.91 | 678 | 683 | 155.8 |
| C | 14 | 254 | 129355 | 826.12 | 678 | 683 | 155.8 |
| C | 0 | 10 | 87386 | 556.66 | 678 | 683 | 155.8 |
| D | 2 | 249 | 78221 | 480.2 | 673 | 655 | 161.5 |
| D | 2 | 153 | 51296 | 313.51 | 673 | 655 | 161.5 |
| D | 13 | 249 | 37858 | 230.32 | 673 | 655 | 161.5 |
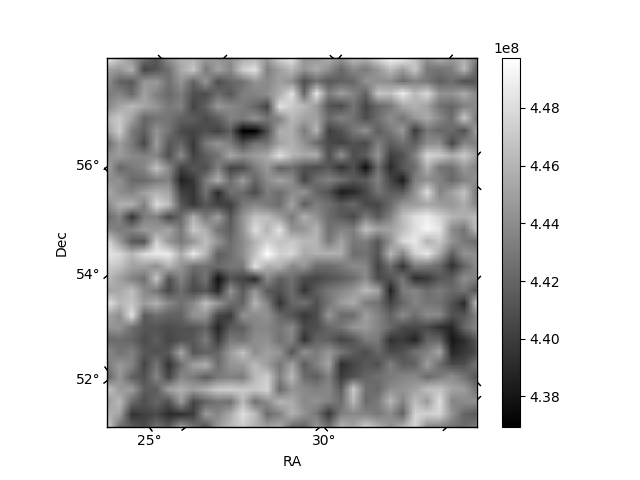
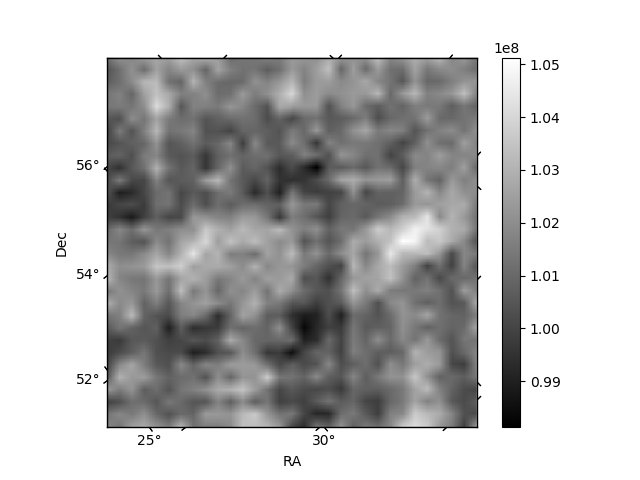
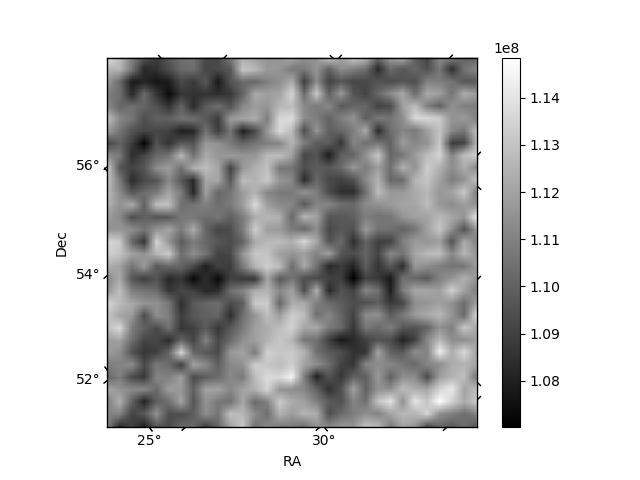
Histogram calculated using DETX and DETY for each event in the final _common_clean file
| Quadrant A | 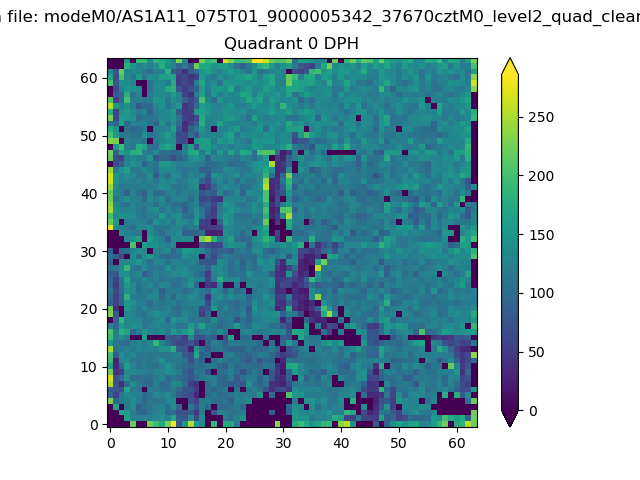 |
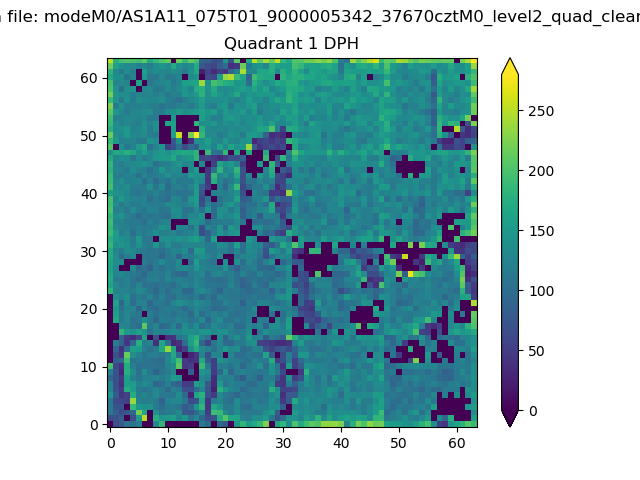 |
Quadrant B |
|---|---|---|---|
| Quadrant D | 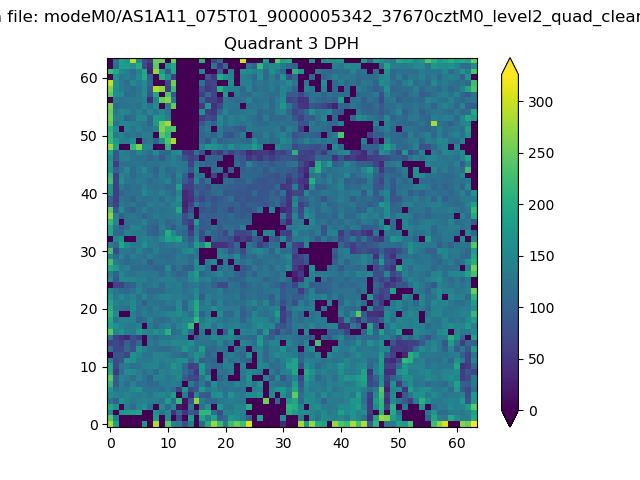 |
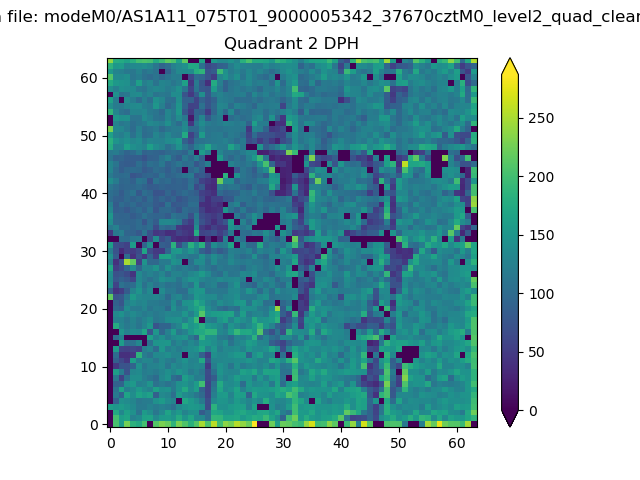 |
Quadrant C |
| Plot type | Count rate plots | Images |
|---|---|---|
| Comparison with Poisson distribution Blue bars denote a histogram of data divided into 1 sec bins. Red curve is a Poisson curve with rate = median count rate of data. |
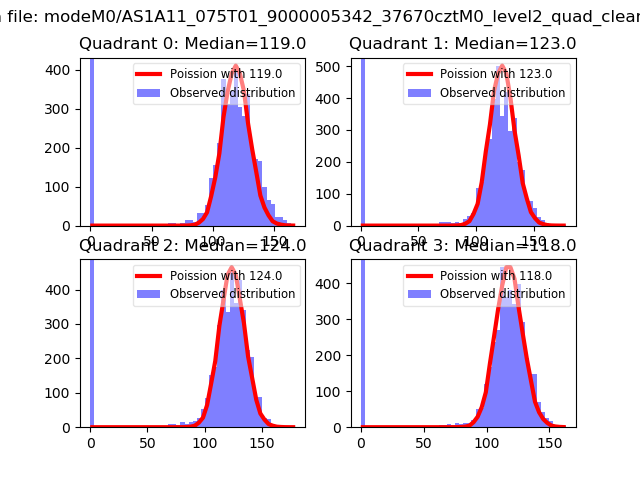 |
 |
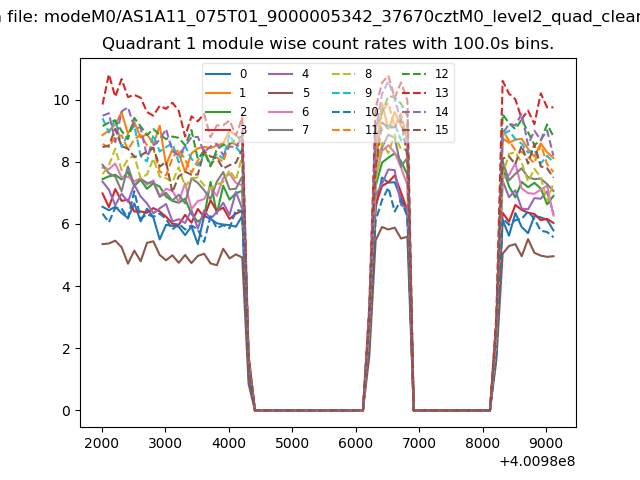
| Quadrant-wise count rates Data is divided into 100 sec bins |
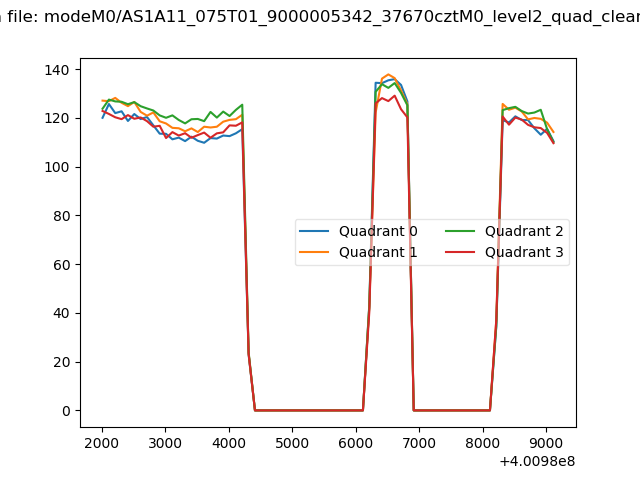 |
|
| Module-wise count rates for Quadrant A Data is divided into 100 sec bins |
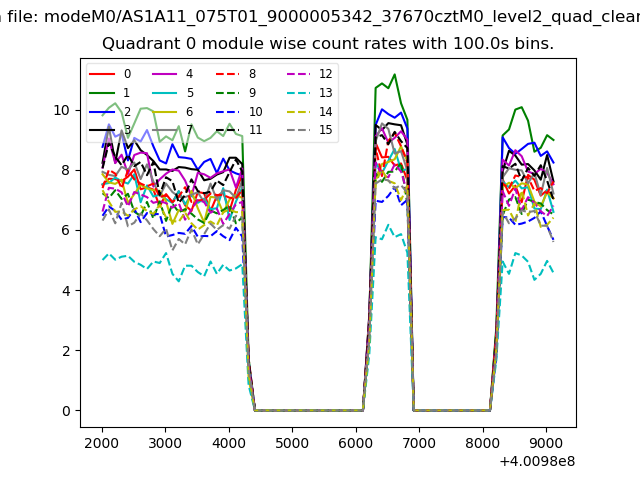 |
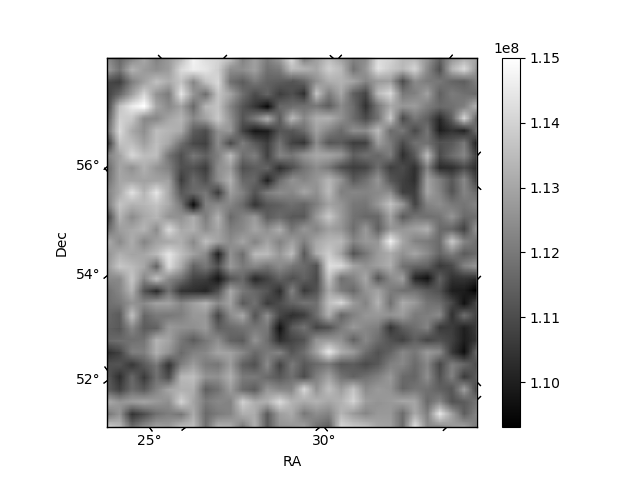 |
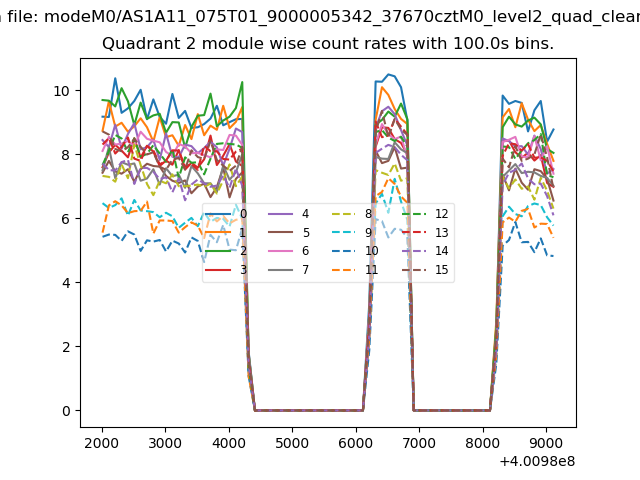
| Module-wise count rates for Quadrant B Data is divided into 100 sec bins |
 |
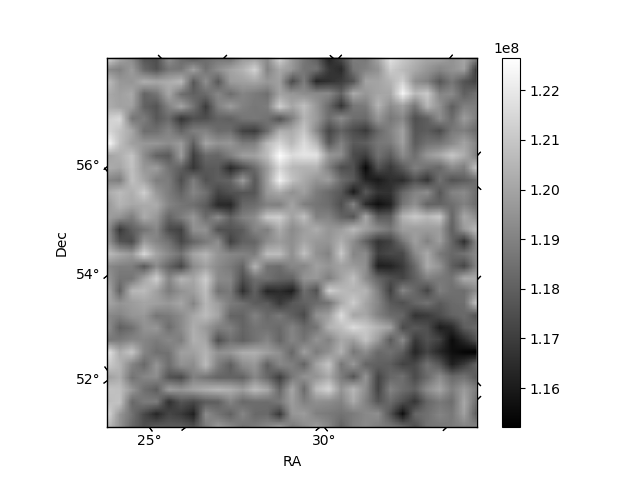 |
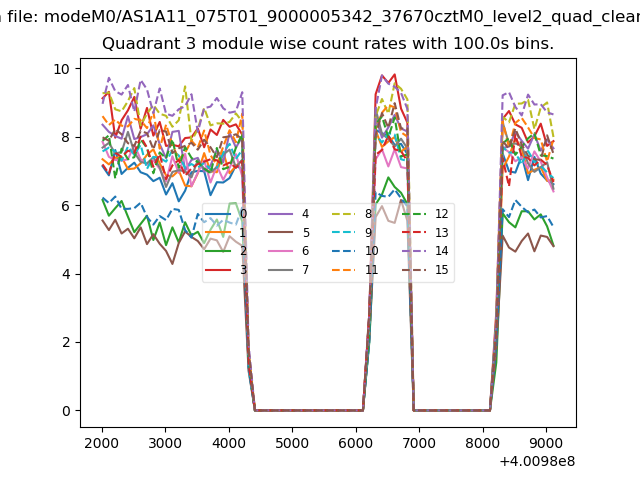
| Module-wise count rates for Quadrant C Data is divided into 100 sec bins |
 |
 |
| Module-wise count rates for Quadrant D Data is divided into 100 sec bins |
 |
 |
| Parameter | Plot |
|---|---|
| CZT HV Monitor | 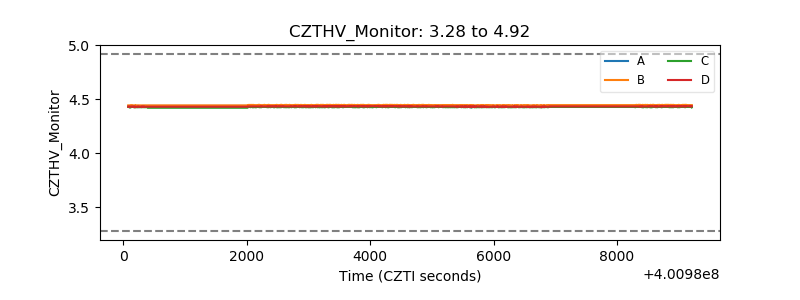 |
| D_VDD | 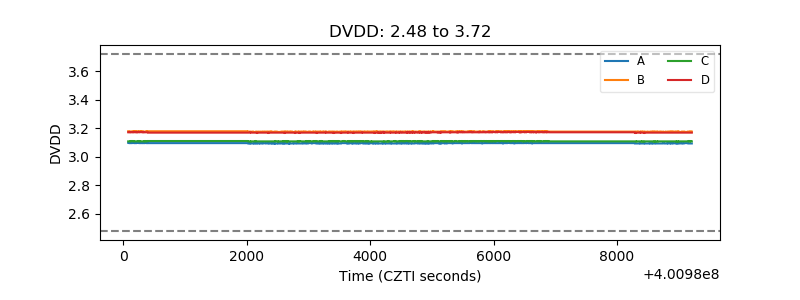 |
| Temperature 1 | 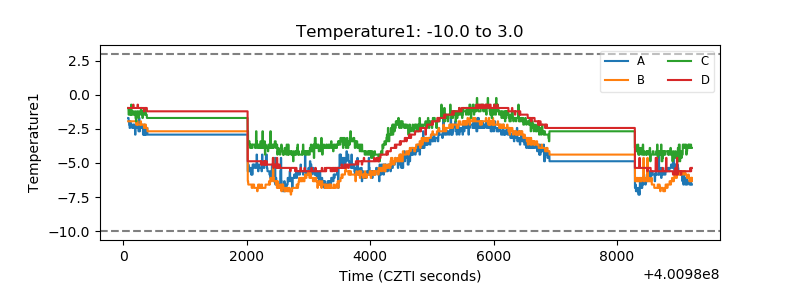 |
| Veto HV Monitor | 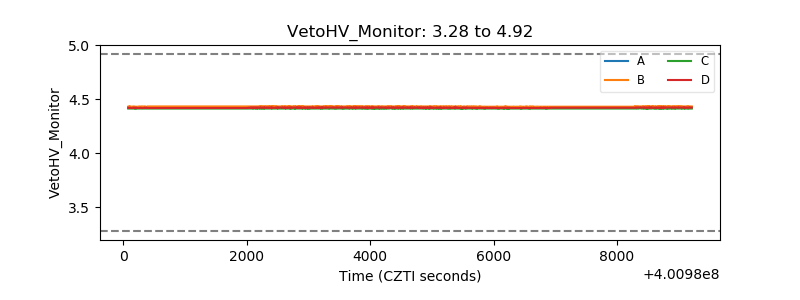 |
| Veto LLD | 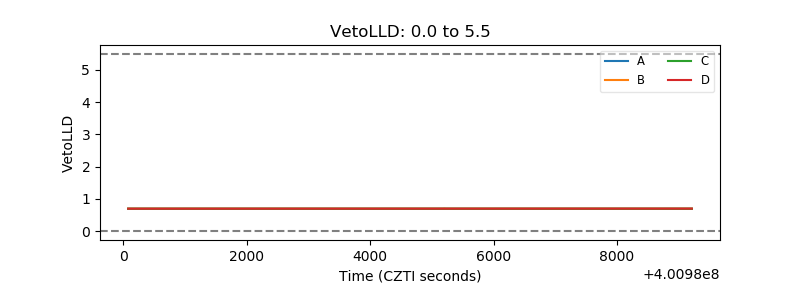 |
| Alpha Counter | 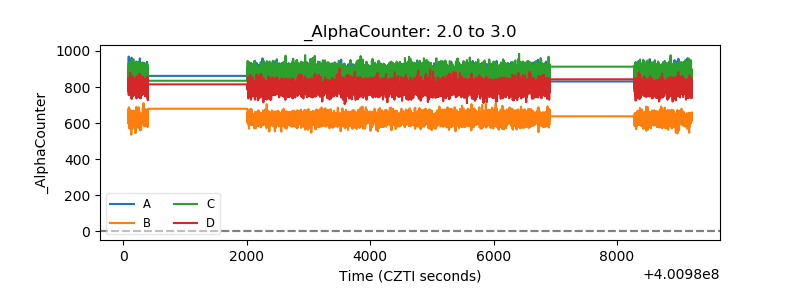 |
| _CPM_Rate | 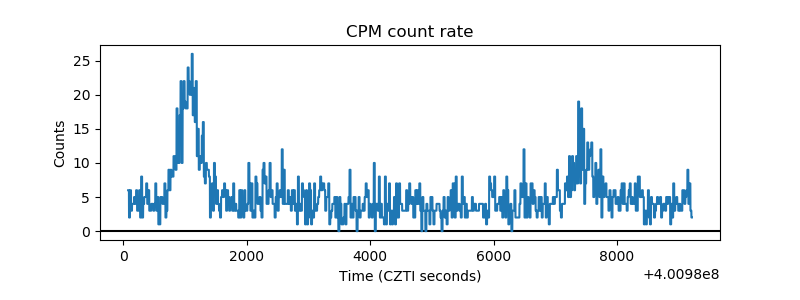 |
| CZT Counter | 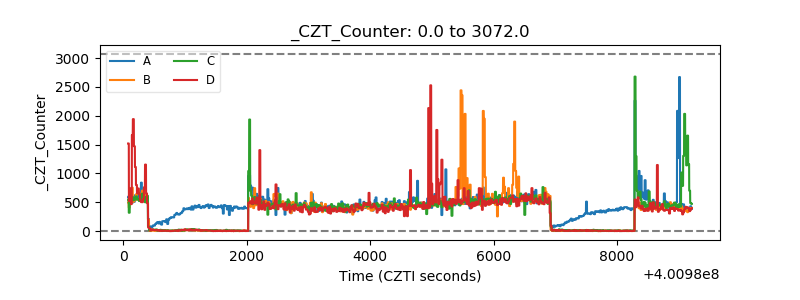 |
| +2.5 Volts monitor | 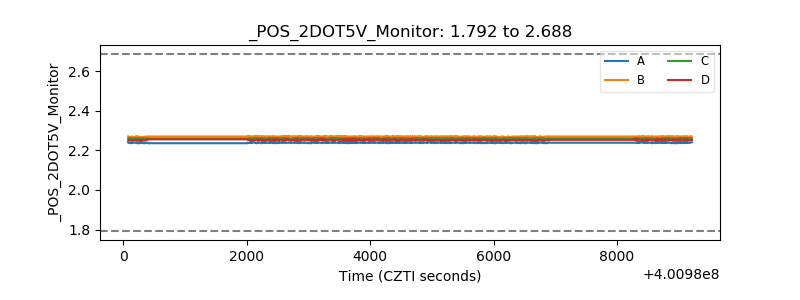 |
| +5 Volts monitor | 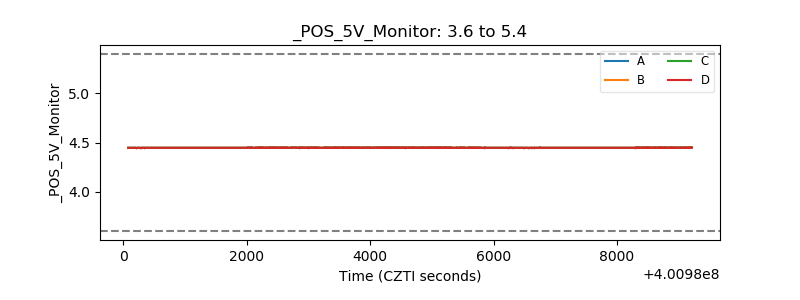 |
| _ROLL_ROT | 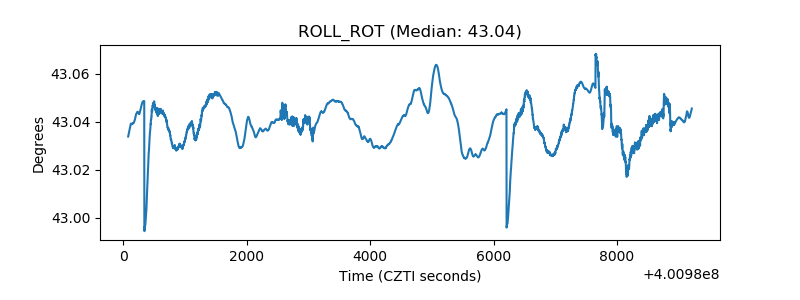 |
| _Roll_DEC | 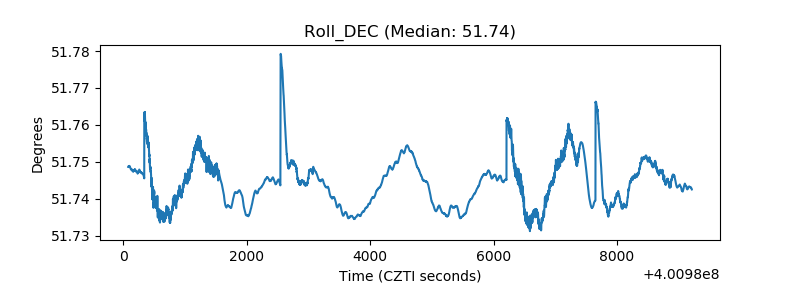 |
| _Roll_RA | 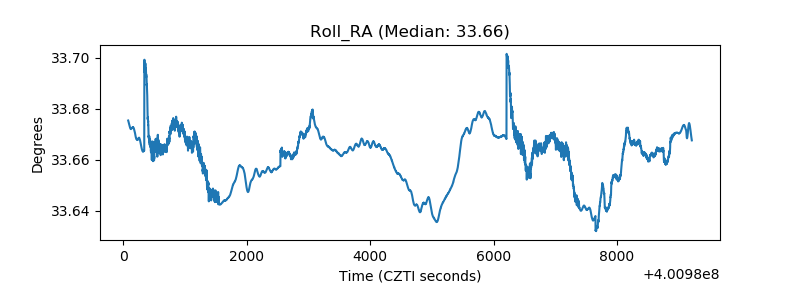 |
| Veto Counter | 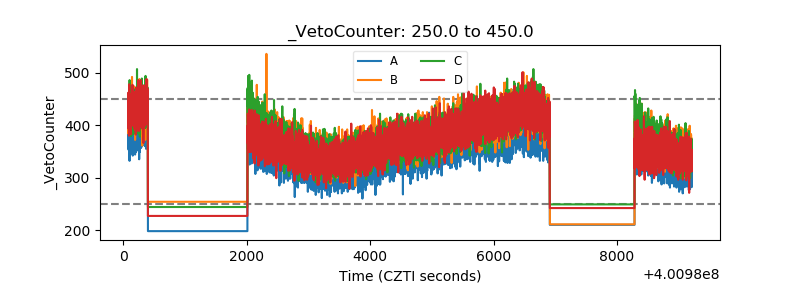 |