| Param | Original file | Final file |
|---|---|---|
| Filename | modeM0/AS1A11_075T01_9000005342_37671cztM0_level2.evt | modeM0/AS1A11_075T01_9000005342_37671cztM0_level2_quad_clean.evt |
| Size (bytes) | 418,325,760 | 78,154,560 |
| Size | 398.9 MB | 74.5 MB |
| Events in quadrant A | 3,153,075 | 480,773 |
| Events in quadrant B | 3,011,921 | 494,768 |
| Events in quadrant C | 3,081,300 | 498,474 |
| Events in quadrant D | 3,016,289 | 474,965 |
| Mode SS | |||
|---|---|---|---|
| Quadrant | BADHDUFLAG | Total packets | Discarded packets |
| A | 0 | 122 | 0 |
| B | 0 | 122 | 0 |
| C | 0 | 122 | 0 |
| D | 0 | 122 | 0 |
| Mode M0 | |||
|---|---|---|---|
| Quadrant | BADHDUFLAG | Total packets | Discarded packets |
| A | 0 | 13128 | 3 |
| B | 0 | 13049 | 2 |
| C | 0 | 12867 | 2 |
| D | 0 | 13312 | 2 |
| Mode M9 | |||
|---|---|---|---|
| Quadrant | BADHDUFLAG | Total packets | Discarded packets |
| A | 0 | 27 | 0 |
| B | 0 | 27 | 0 |
| C | 0 | 27 | 0 |
| D | 0 | 27 | 0 |
| Quadrant | Total seconds | Saturated seconds | Saturation percentage |
|---|---|---|---|
| A | 5984 | 19 | 0.317513% |
| B | 5984 | 48 | 0.802139% |
| C | 5984 | 26 | 0.434492% |
| D | 5984 | 65 | 1.086230% |
Noise dominated data is calculated using 1-second bins in cleaned event files. If a bin has >2000 counts, and if more than 50% of those come from <1% of pixels, then it is considered to be noise-dominated and hence unusable.
| Quadrant | # 1 sec bins | Bins with >0 counts | Bins with >2000 counts | High rate bins dominated by noise | Noise dominated (total time) | Noise dominated (detector-on time) | Marked lightcurve |
|---|---|---|---|---|---|---|---|
| A | 8639 | 5985 | 17 | 17 | 0.20% | 0.28% | 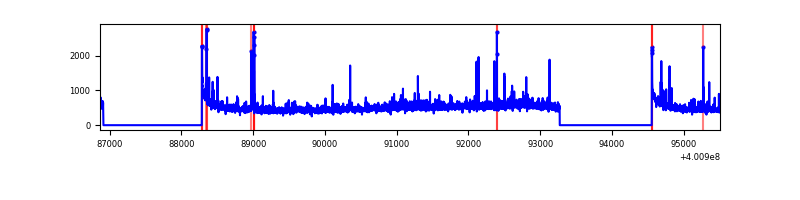 |
| B | 8640 | 5984 | 19 | 19 | 0.22% | 0.32% | 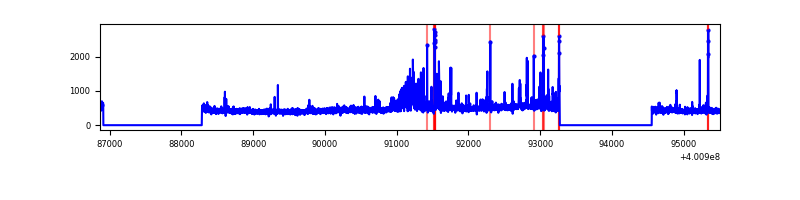 |
| C | 8640 | 5984 | 27 | 27 | 0.31% | 0.45% | 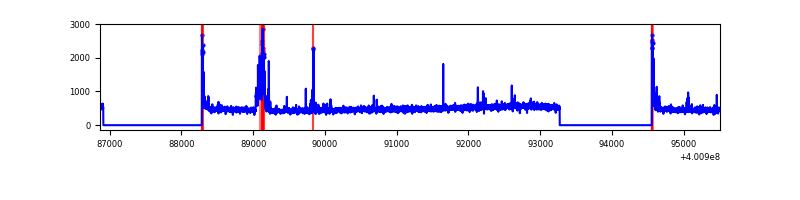 |
| D | 8640 | 5984 | 59 | 59 | 0.68% | 0.99% | 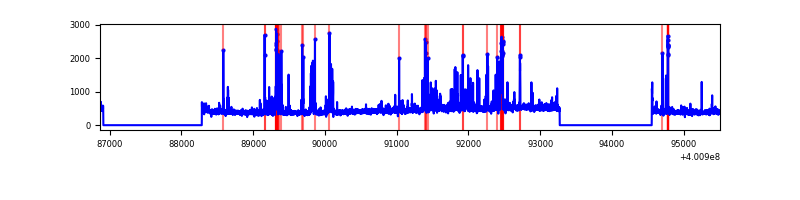 |
Top three noisy pixels from each quadrant. If the there are fewer than three noisy pixels in the level2.evt file, extra rows are filled as -1
| Pixel properties | Quadrant properties | ||||||
|---|---|---|---|---|---|---|---|
| Quadrant | DetID | PixID | Counts | Sigma | Mean | Median | Sigma |
| A | 10 | 83 | 334881 | 2489.71 | 667 | 654 | 134.2 |
| A | 6 | 10 | 110809 | 820.56 | 667 | 654 | 134.2 |
| A | 9 | 143 | 98570 | 729.39 | 667 | 654 | 134.2 |
| B | 0 | 189 | 145076 | 1116.55 | 667 | 649 | 129.4 |
| B | 5 | 172 | 130701 | 1005.42 | 667 | 649 | 129.4 |
| B | 0 | 230 | 37559 | 285.35 | 667 | 649 | 129.4 |
| C | 15 | 214 | 275389 | 1795.93 | 655 | 659 | 153.0 |
| C | 14 | 254 | 162447 | 1057.62 | 655 | 659 | 153.0 |
| C | 0 | 10 | 82290 | 533.63 | 655 | 659 | 153.0 |
| D | 13 | 249 | 247345 | 1568.91 | 650 | 632 | 157.3 |
| D | 12 | 227 | 114847 | 726.32 | 650 | 632 | 157.3 |
| D | 5 | 222 | 62523 | 393.58 | 650 | 632 | 157.3 |
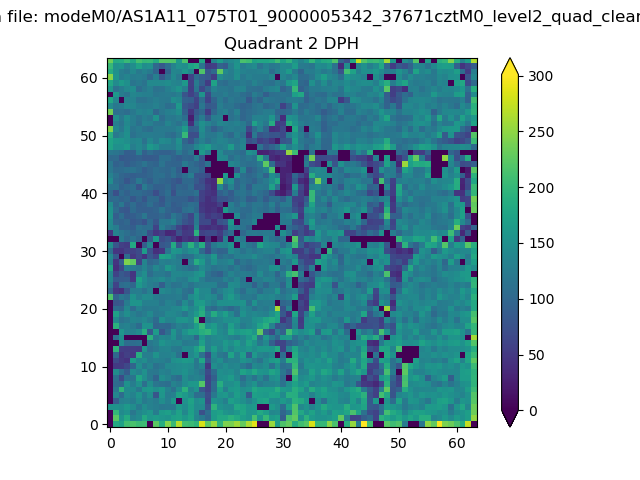
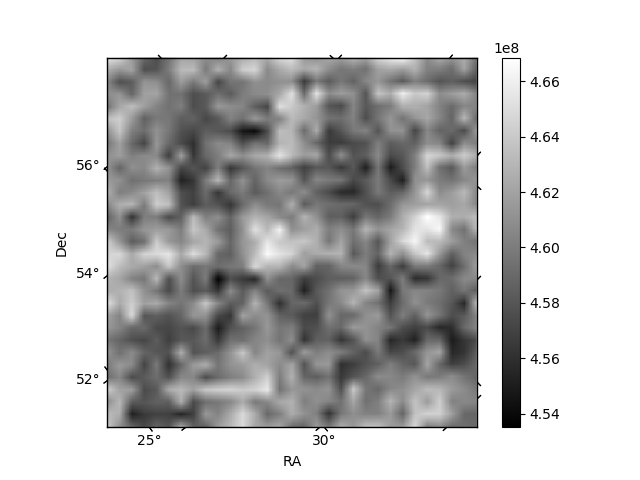
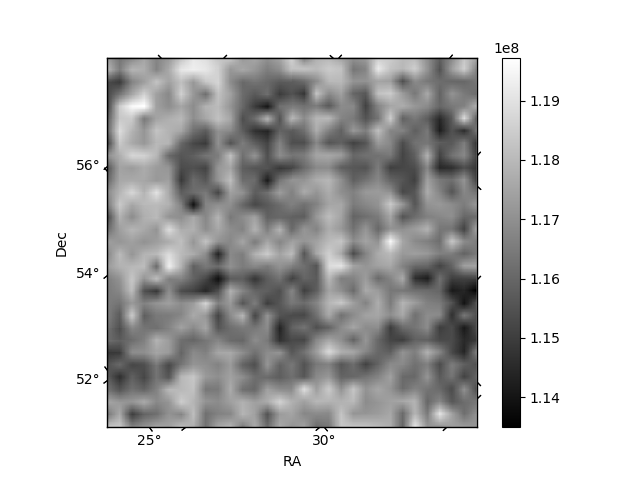
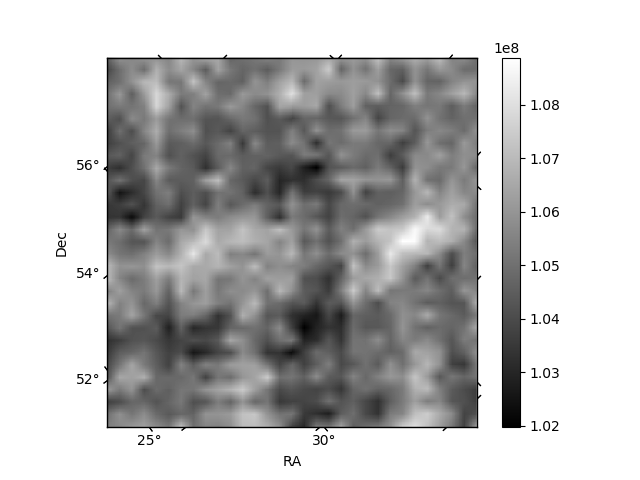
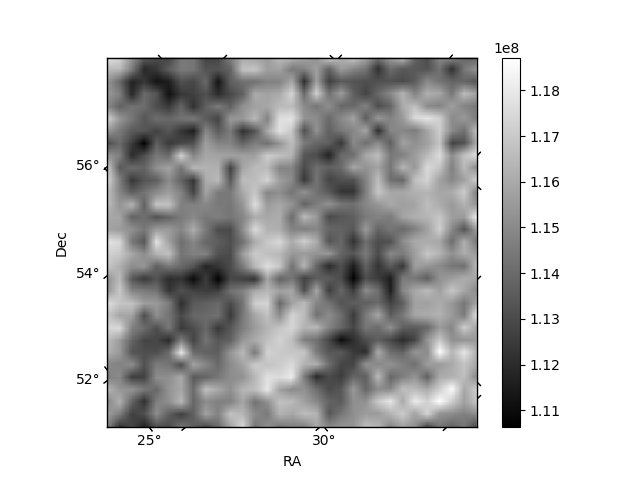
Histogram calculated using DETX and DETY for each event in the final _common_clean file
| Quadrant A | 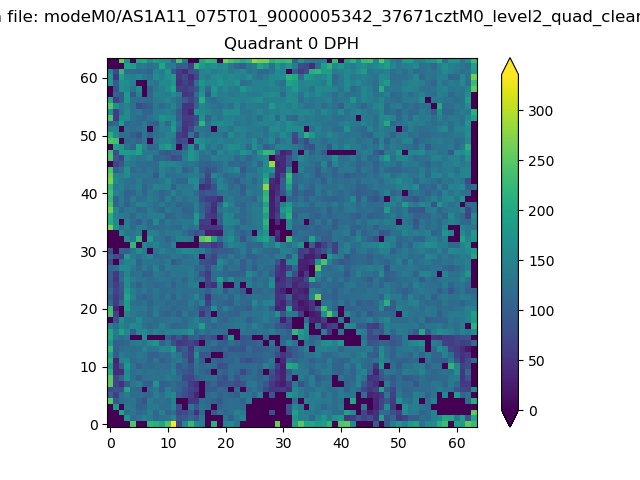 |
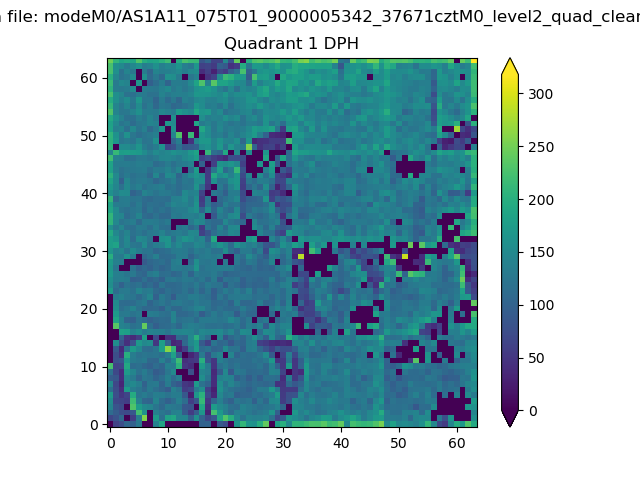 |
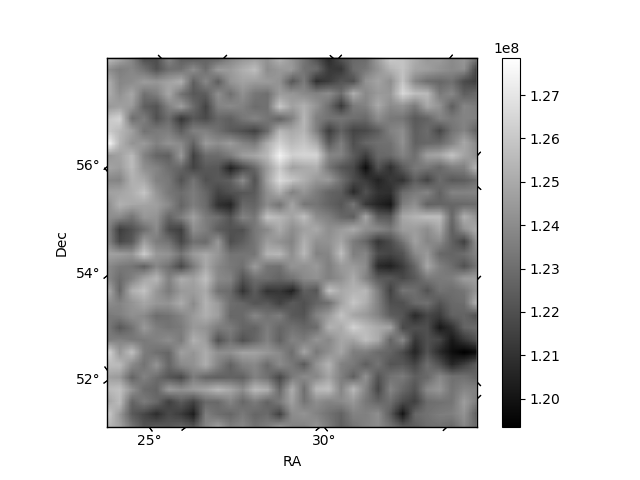
Quadrant B |
|---|---|---|---|
| Quadrant D | 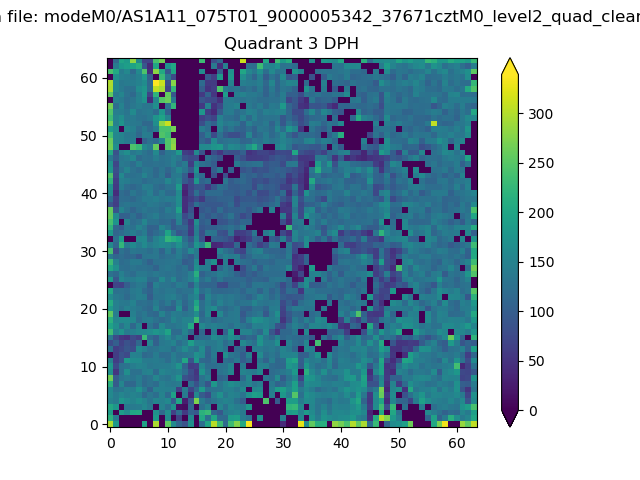 |
 |
Quadrant C |
| Plot type | Count rate plots | Images |
|---|---|---|
| Comparison with Poisson distribution Blue bars denote a histogram of data divided into 1 sec bins. Red curve is a Poisson curve with rate = median count rate of data. |
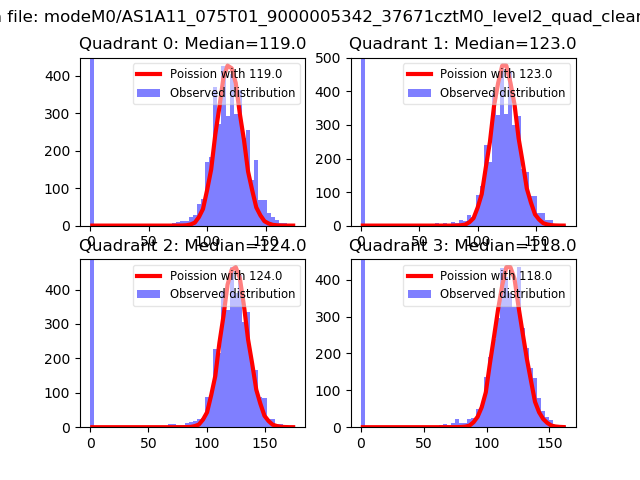 |
 |
| Quadrant-wise count rates Data is divided into 100 sec bins |
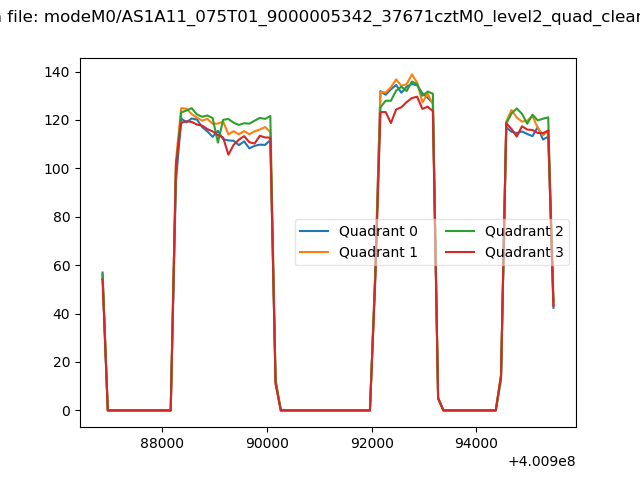 |
|
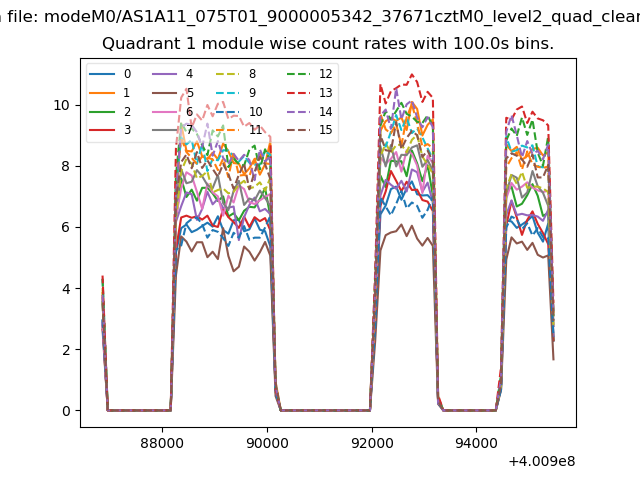
| Module-wise count rates for Quadrant A Data is divided into 100 sec bins |
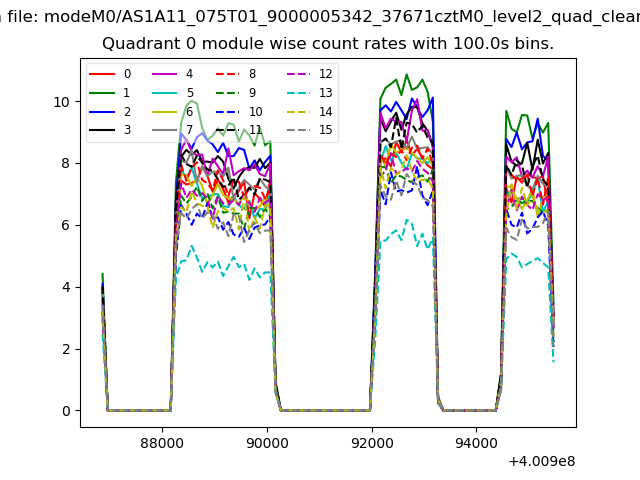 |
 |
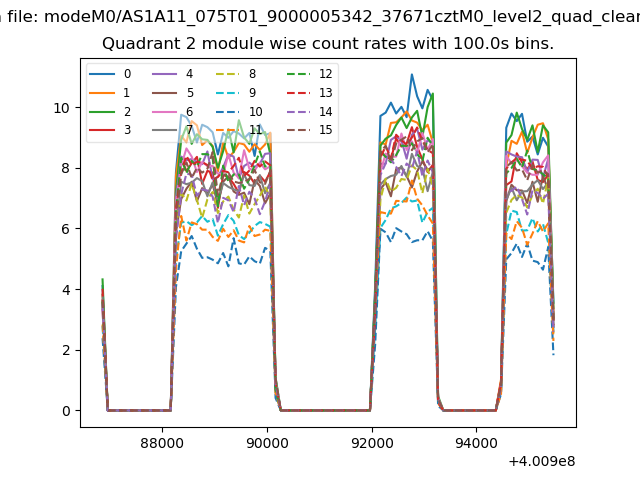
| Module-wise count rates for Quadrant B Data is divided into 100 sec bins |
 |
 |
| Module-wise count rates for Quadrant C Data is divided into 100 sec bins |
 |
 |
| Module-wise count rates for Quadrant D Data is divided into 100 sec bins |
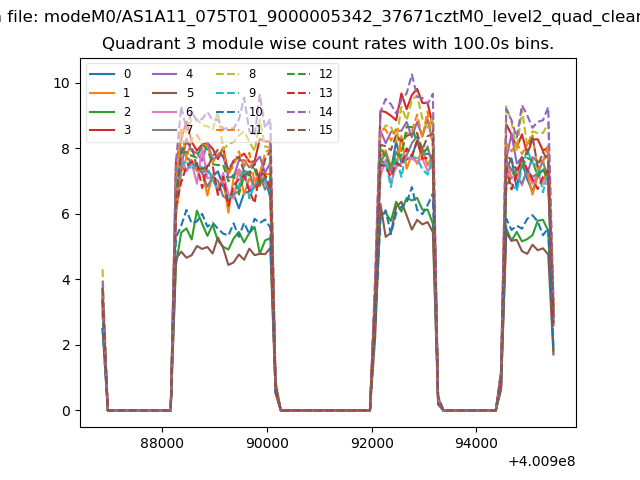 |
 |
| Parameter | Plot |
|---|---|
| CZT HV Monitor | 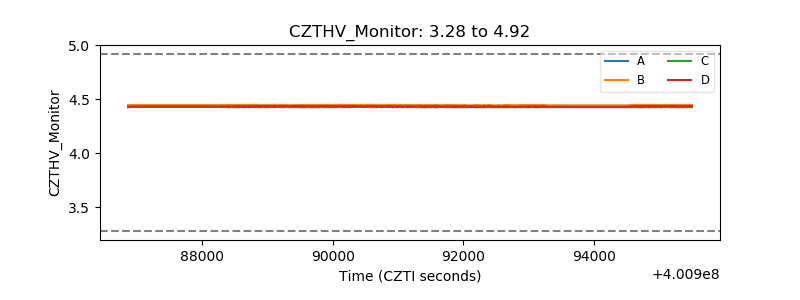 |
| D_VDD | 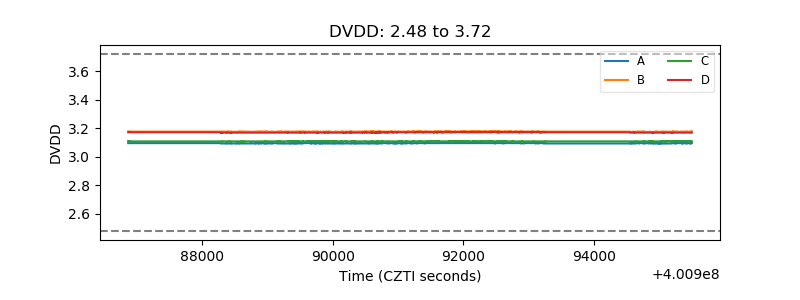 |
| Temperature 1 | 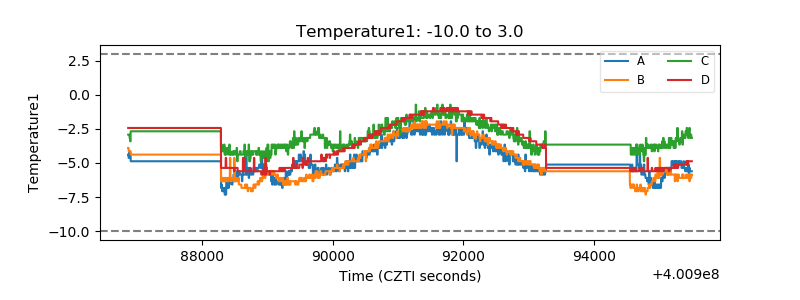 |
| Veto HV Monitor | 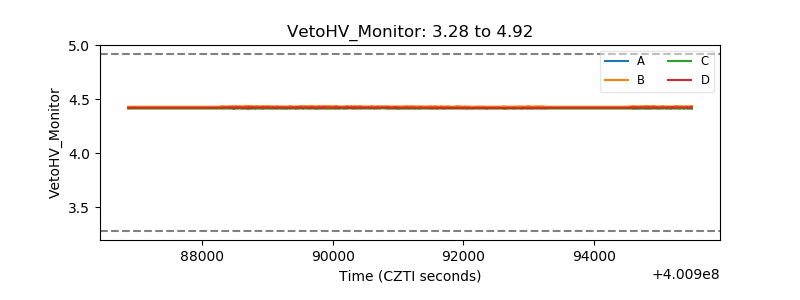 |
| Veto LLD | 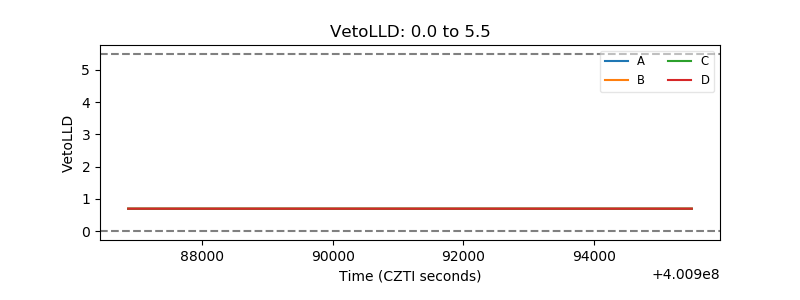 |
| Alpha Counter | 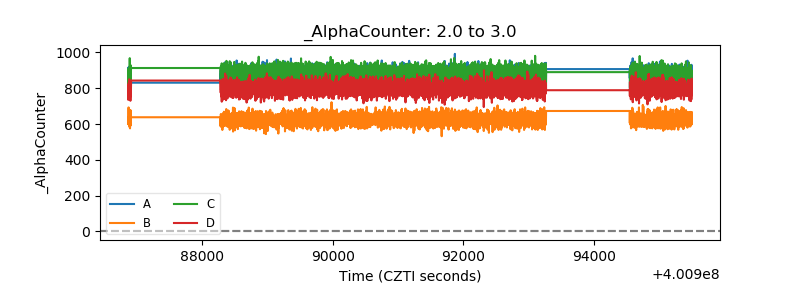 |
| _CPM_Rate | 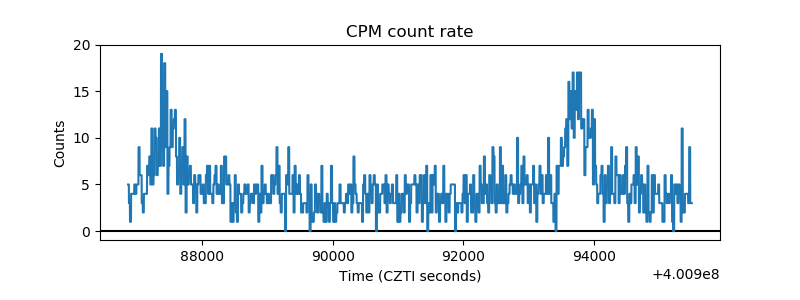 |
| CZT Counter | 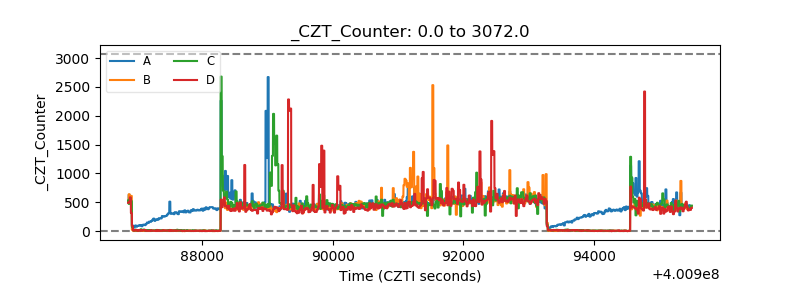 |
| +2.5 Volts monitor | 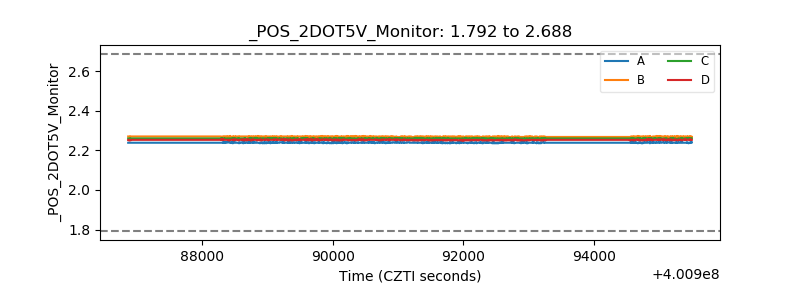 |
| +5 Volts monitor | 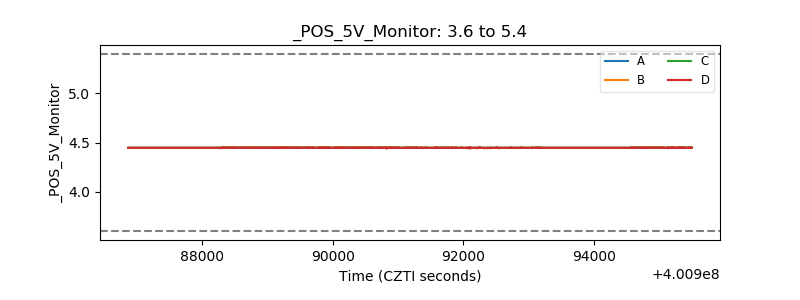 |
| _ROLL_ROT | 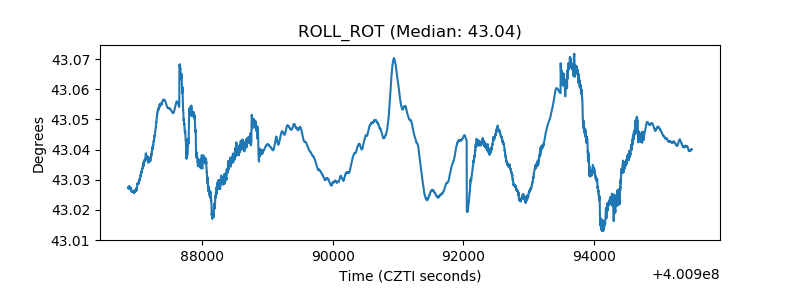 |
| _Roll_DEC | 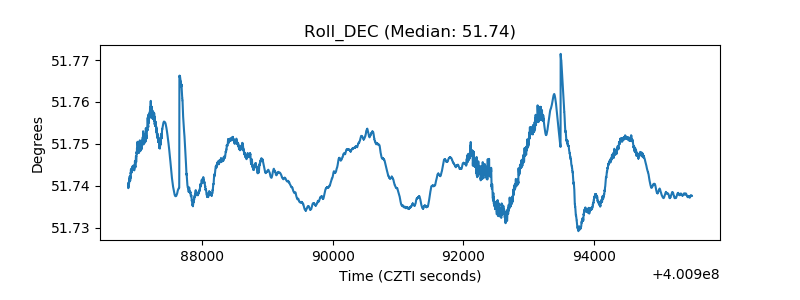 |
| _Roll_RA | 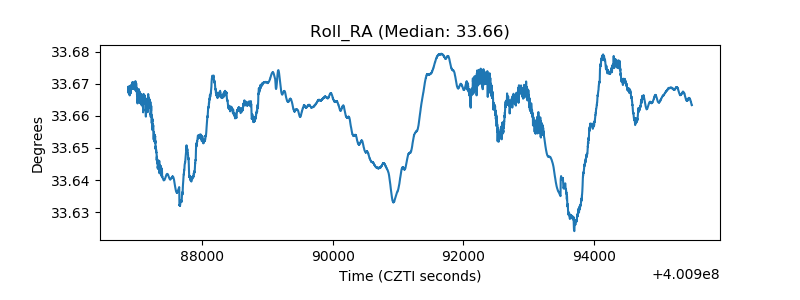 |
| Veto Counter | 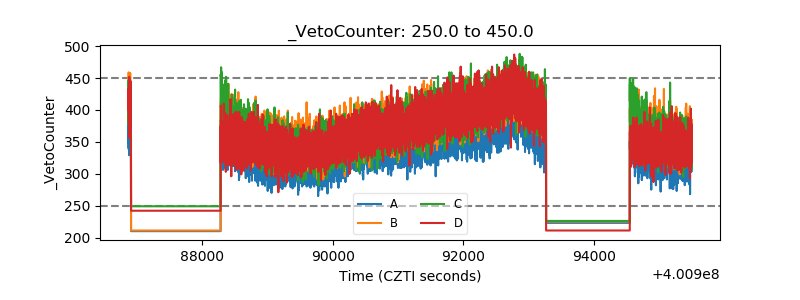 |