| Param | Original file | Final file |
|---|---|---|
| Filename | modeM0/AS1A11_075T01_9000005342_37674cztM0_level2.evt | modeM0/AS1A11_075T01_9000005342_37674cztM0_level2_quad_clean.evt |
| Size (bytes) | 1,082,211,840 | 180,590,400 |
| Size | 1.0 GB | 172.2 MB |
| Events in quadrant A | 8,450,180 | 1,093,892 |
| Events in quadrant B | 7,575,501 | 1,120,847 |
| Events in quadrant C | 7,673,275 | 1,123,184 |
| Events in quadrant D | 8,029,878 | 1,063,871 |
| Mode SS | |||
|---|---|---|---|
| Quadrant | BADHDUFLAG | Total packets | Discarded packets |
| A | 0 | 314 | 0 |
| B | 0 | 314 | 0 |
| C | 0 | 314 | 0 |
| D | 0 | 314 | 0 |
| Mode M0 | |||
|---|---|---|---|
| Quadrant | BADHDUFLAG | Total packets | Discarded packets |
| A | 0 | 34316 | 5 |
| B | 0 | 32509 | 4 |
| C | 0 | 32001 | 4 |
| D | 0 | 34463 | 4 |
| Mode M9 | |||
|---|---|---|---|
| Quadrant | BADHDUFLAG | Total packets | Discarded packets |
| A | 0 | 44 | 0 |
| B | 0 | 44 | 0 |
| C | 0 | 44 | 0 |
| D | 0 | 45 | 0 |
| Quadrant | Total seconds | Saturated seconds | Saturation percentage |
|---|---|---|---|
| A | 15477 | 103 | 0.665504% |
| B | 15477 | 84 | 0.542741% |
| C | 15477 | 23 | 0.148608% |
| D | 15477 | 150 | 0.969180% |
Noise dominated data is calculated using 1-second bins in cleaned event files. If a bin has >2000 counts, and if more than 50% of those come from <1% of pixels, then it is considered to be noise-dominated and hence unusable.
| Quadrant | # 1 sec bins | Bins with >0 counts | Bins with >2000 counts | High rate bins dominated by noise | Noise dominated (total time) | Noise dominated (detector-on time) | Marked lightcurve |
|---|---|---|---|---|---|---|---|
| A | 19714 | 15480 | 62 | 62 | 0.31% | 0.40% | 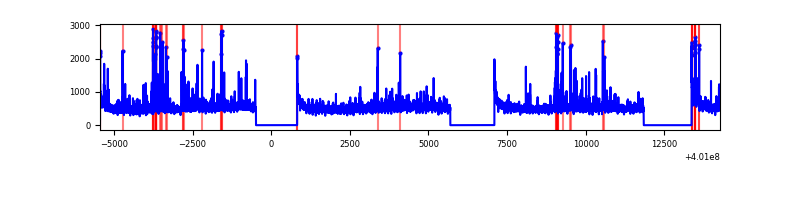 |
| B | 19713 | 15476 | 59 | 59 | 0.30% | 0.38% | 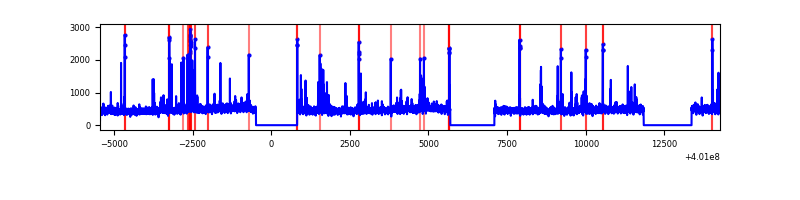 |
| C | 19713 | 15476 | 14 | 14 | 0.07% | 0.09% | 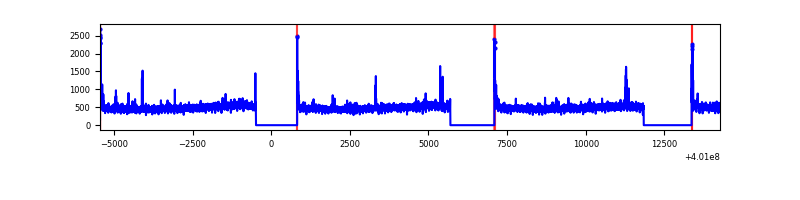 |
| D | 19713 | 15476 | 130 | 130 | 0.66% | 0.84% | 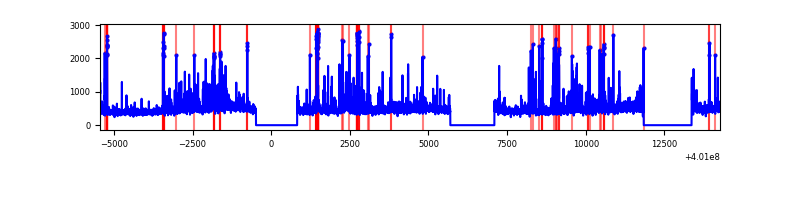 |
Top three noisy pixels from each quadrant. If the there are fewer than three noisy pixels in the level2.evt file, extra rows are filled as -1
| Pixel properties | Quadrant properties | ||||||
|---|---|---|---|---|---|---|---|
| Quadrant | DetID | PixID | Counts | Sigma | Mean | Median | Sigma |
| A | 10 | 83 | 782079 | 2230.0 | 1759 | 1726 | 349.9 |
| A | 9 | 143 | 329526 | 936.75 | 1759 | 1726 | 349.9 |
| A | 6 | 10 | 282790 | 803.19 | 1759 | 1726 | 349.9 |
| B | 5 | 172 | 258197 | 758.04 | 1756 | 1704 | 338.4 |
| B | 0 | 230 | 110005 | 320.07 | 1756 | 1704 | 338.4 |
| B | 4 | 81 | 80068 | 231.6 | 1756 | 1704 | 338.4 |
| C | 15 | 214 | 703163 | 1758.82 | 1726 | 1736 | 398.8 |
| C | 0 | 10 | 129046 | 319.23 | 1726 | 1736 | 398.8 |
| C | 14 | 254 | 87790 | 215.78 | 1726 | 1736 | 398.8 |
| D | 5 | 222 | 285821 | 682.66 | 1720 | 1669 | 416.2 |
| D | 10 | 199 | 230246 | 549.14 | 1720 | 1669 | 416.2 |
| D | 7 | 38 | 194295 | 462.77 | 1720 | 1669 | 416.2 |
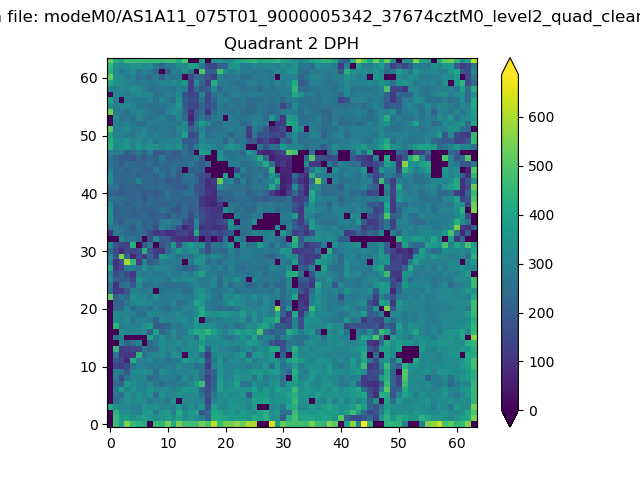
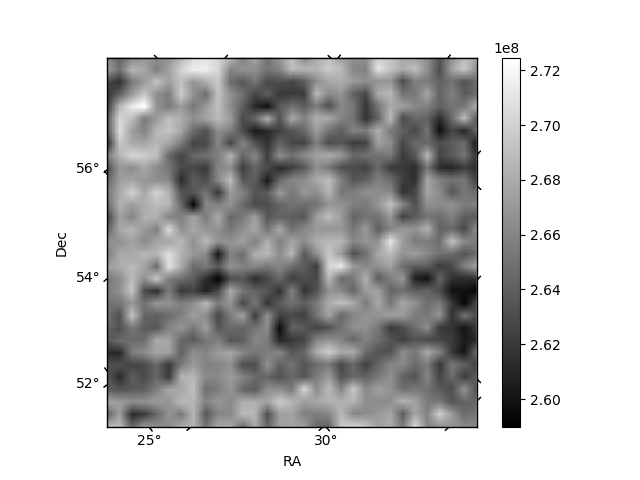
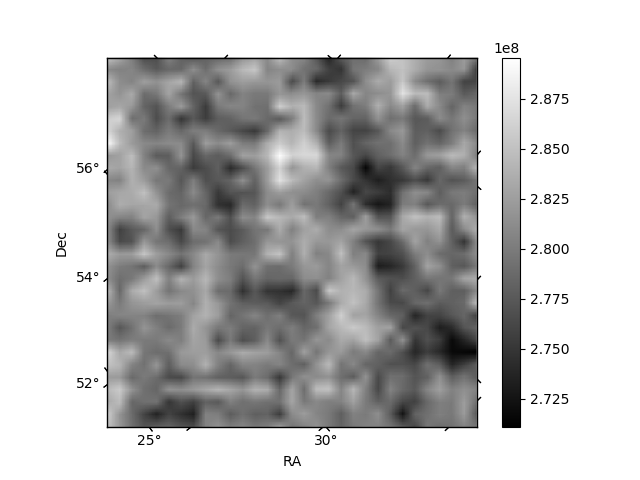
Histogram calculated using DETX and DETY for each event in the final _common_clean file
| Quadrant A | 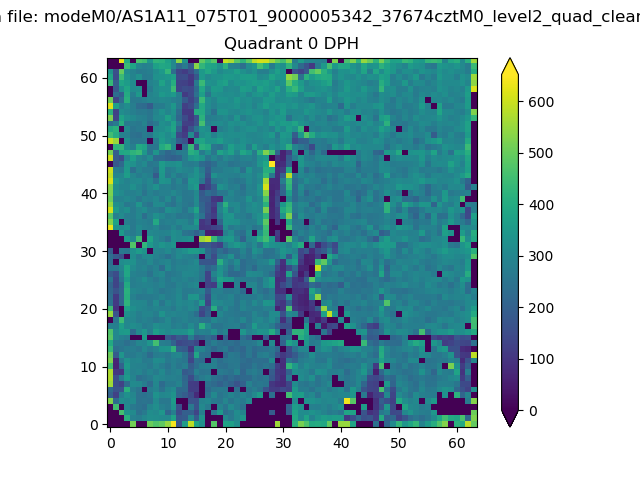 |
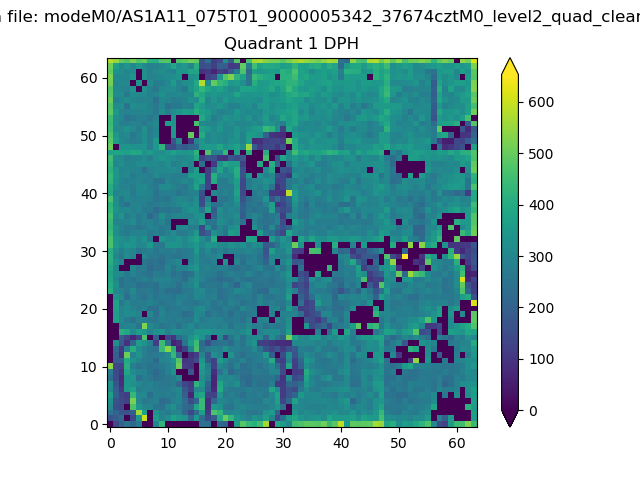 |
Quadrant B |
|---|---|---|---|
| Quadrant D | 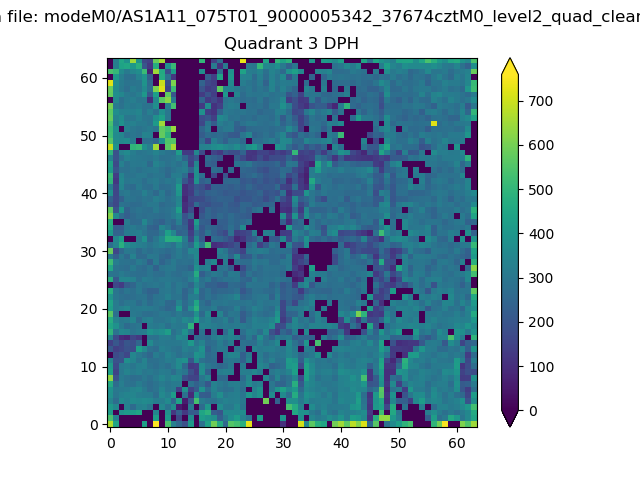 |
 |
Quadrant C |
| Plot type | Count rate plots | Images |
|---|---|---|
| Comparison with Poisson distribution Blue bars denote a histogram of data divided into 1 sec bins. Red curve is a Poisson curve with rate = median count rate of data. |
 |
 |
| Quadrant-wise count rates Data is divided into 100 sec bins |
 |
|
| Module-wise count rates for Quadrant A Data is divided into 100 sec bins |
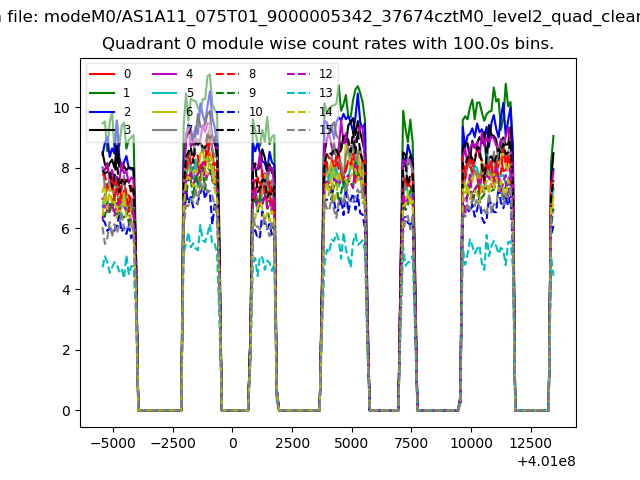 |
 |
| Module-wise count rates for Quadrant B Data is divided into 100 sec bins |
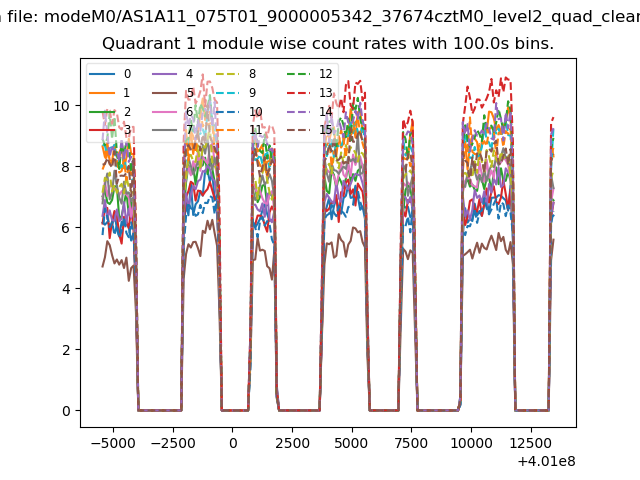 |
 |
| Module-wise count rates for Quadrant C Data is divided into 100 sec bins |
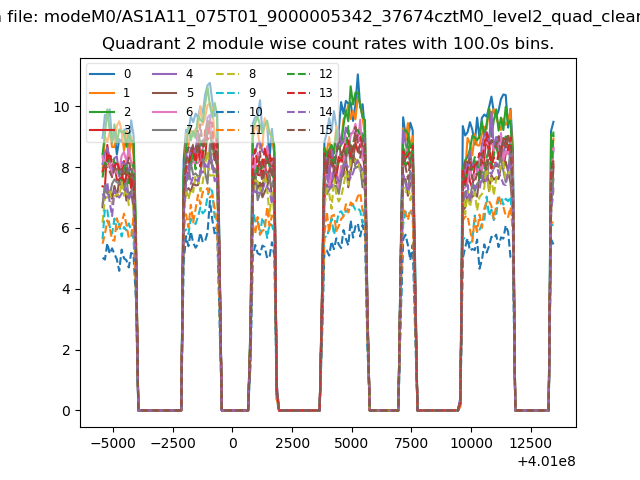 |
 |
| Module-wise count rates for Quadrant D Data is divided into 100 sec bins |
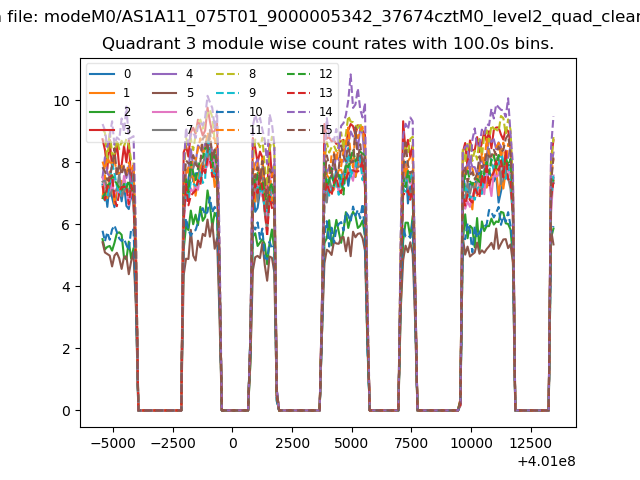 |
 |
| Parameter | Plot |
|---|---|
| CZT HV Monitor | 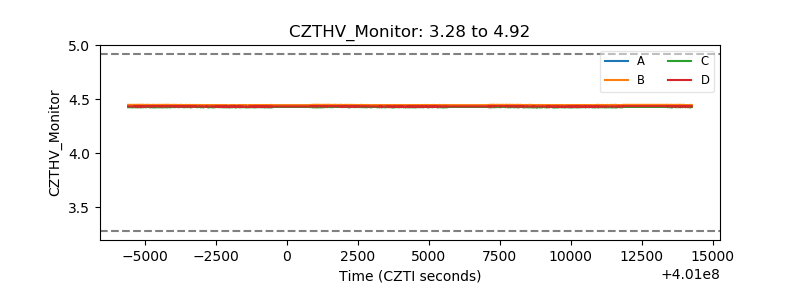 |
| D_VDD | 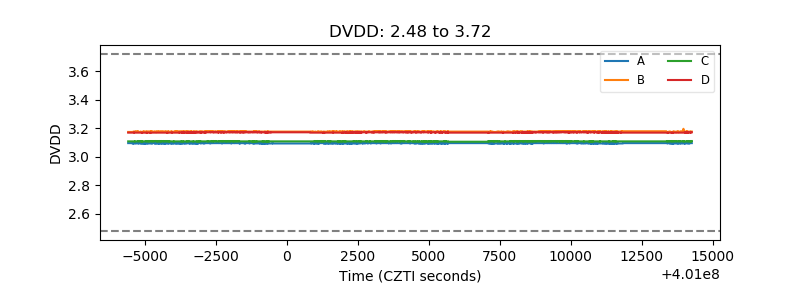 |
| Temperature 1 | 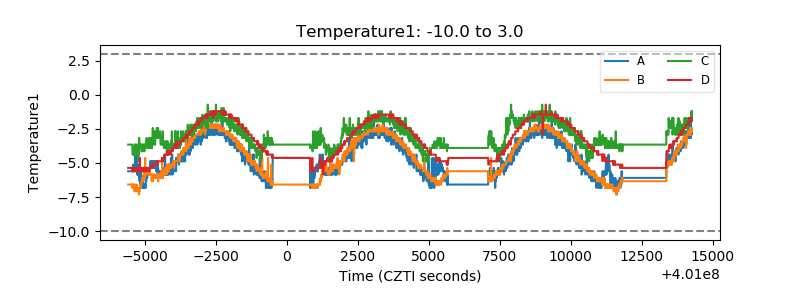 |
| Veto HV Monitor |  |
| Veto LLD | 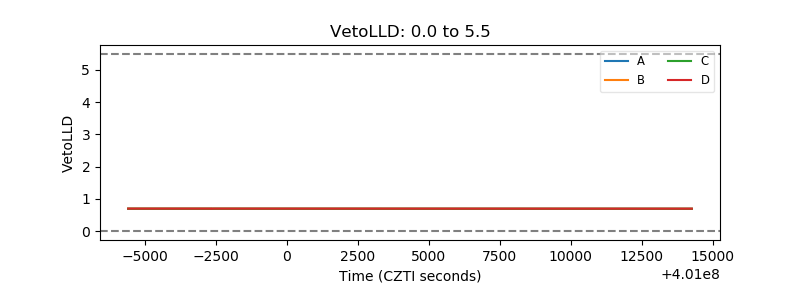 |
| Alpha Counter |  |
| _CPM_Rate | 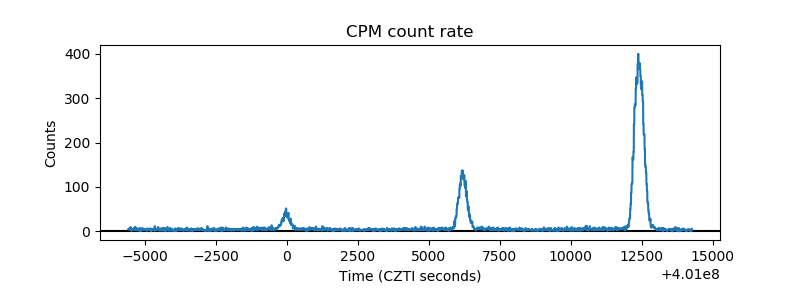 |
| CZT Counter | 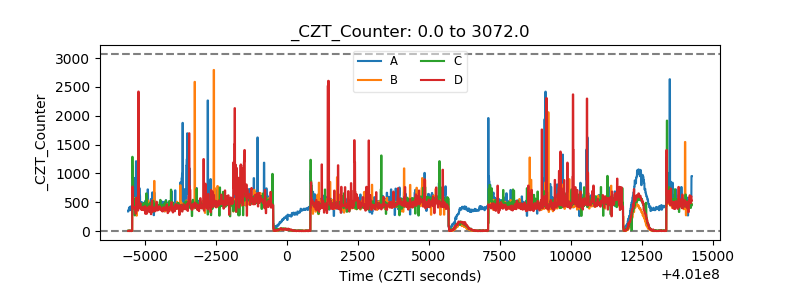 |
| +2.5 Volts monitor | 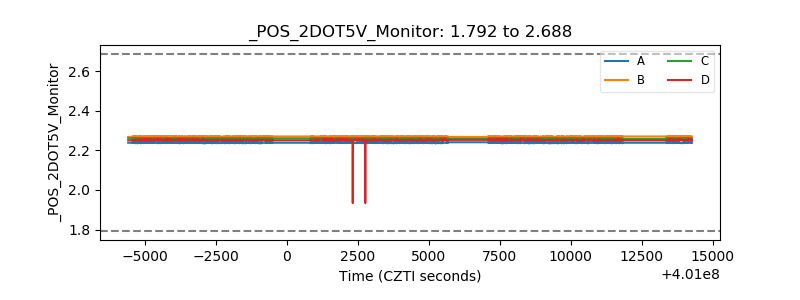 |
| +5 Volts monitor |  |
| _ROLL_ROT | 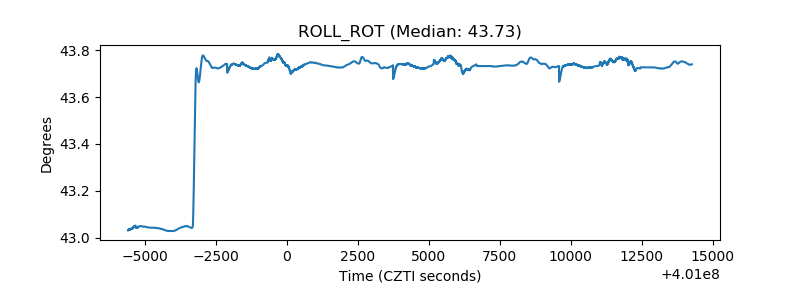 |
| _Roll_DEC | 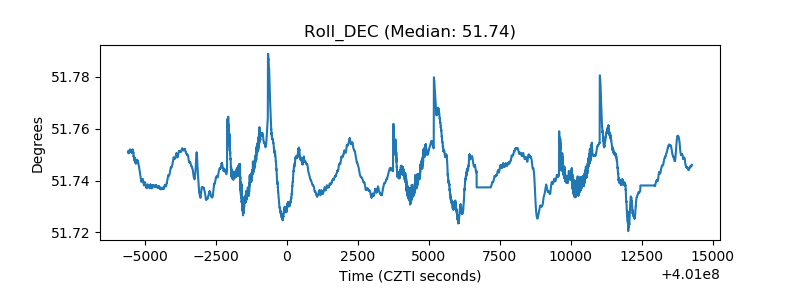 |
| _Roll_RA | 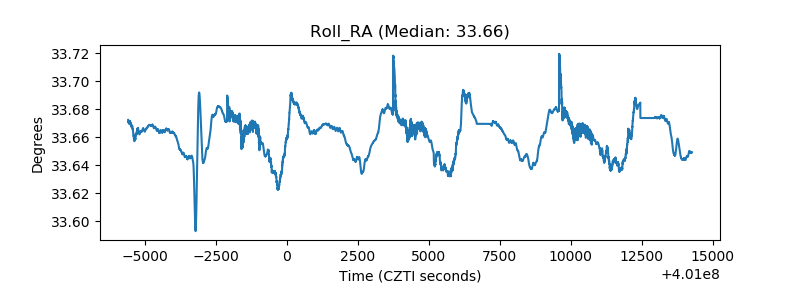 |
| Veto Counter | 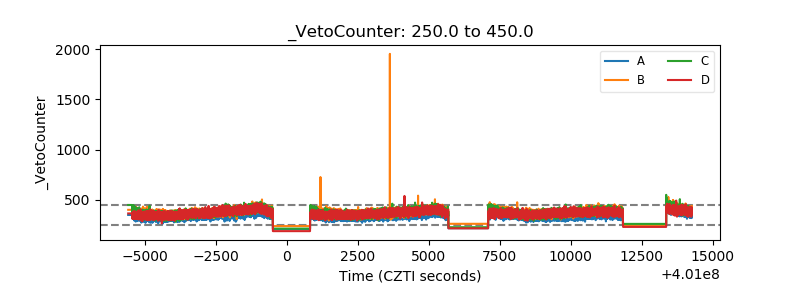 |