| Param | Original file | Final file |
|---|---|---|
| Filename | modeM0/AS1A11_075T01_9000005342_37675cztM0_level2.evt | modeM0/AS1A11_075T01_9000005342_37675cztM0_level2_quad_clean.evt |
| Size (bytes) | 393,010,560 | 56,796,480 |
| Size | 374.8 MB | 54.2 MB |
| Events in quadrant A | 3,174,990 | 333,554 |
| Events in quadrant B | 2,793,948 | 342,374 |
| Events in quadrant C | 2,751,945 | 337,157 |
| Events in quadrant D | 2,808,553 | 322,591 |
| Mode SS | |||
|---|---|---|---|
| Quadrant | BADHDUFLAG | Total packets | Discarded packets |
| A | 0 | 110 | 0 |
| B | 0 | 110 | 0 |
| C | 0 | 110 | 0 |
| D | 0 | 110 | 0 |
| Mode M0 | |||
|---|---|---|---|
| Quadrant | BADHDUFLAG | Total packets | Discarded packets |
| A | 0 | 12743 | 3 |
| B | 0 | 11673 | 2 |
| C | 0 | 11347 | 2 |
| D | 0 | 11939 | 2 |
| Mode M9 | |||
|---|---|---|---|
| Quadrant | BADHDUFLAG | Total packets | Discarded packets |
| A | 0 | 20 | 0 |
| B | 0 | 20 | 0 |
| C | 0 | 20 | 0 |
| D | 0 | 21 | 0 |
| Quadrant | Total seconds | Saturated seconds | Saturation percentage |
|---|---|---|---|
| A | 5489 | 55 | 1.002004% |
| B | 5489 | 24 | 0.437238% |
| C | 5489 | 8 | 0.145746% |
| D | 5489 | 26 | 0.473675% |
Noise dominated data is calculated using 1-second bins in cleaned event files. If a bin has >2000 counts, and if more than 50% of those come from <1% of pixels, then it is considered to be noise-dominated and hence unusable.
| Quadrant | # 1 sec bins | Bins with >0 counts | Bins with >2000 counts | High rate bins dominated by noise | Noise dominated (total time) | Noise dominated (detector-on time) | Marked lightcurve |
|---|---|---|---|---|---|---|---|
| A | 7132 | 5490 | 23 | 23 | 0.32% | 0.42% | 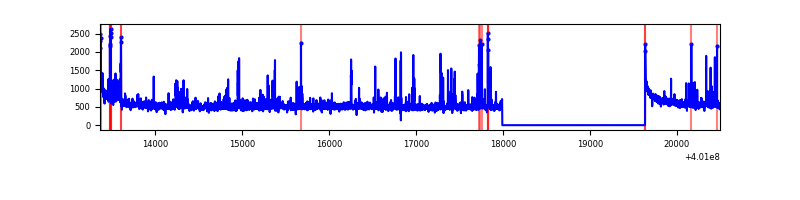 |
| B | 7131 | 5488 | 10 | 10 | 0.14% | 0.18% | 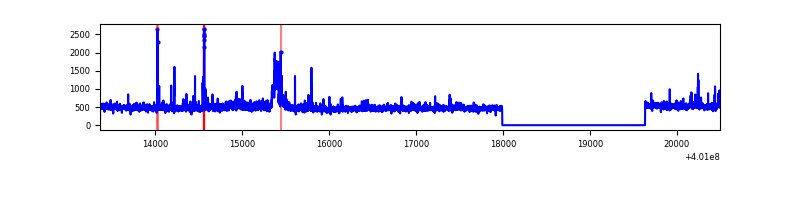 |
| C | 7131 | 5488 | 6 | 6 | 0.08% | 0.11% | 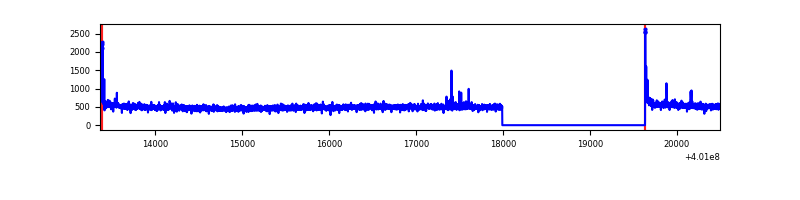 |
| D | 7131 | 5488 | 26 | 26 | 0.36% | 0.47% | 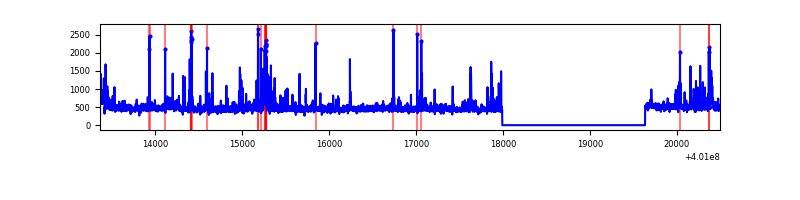 |
Top three noisy pixels from each quadrant. If the there are fewer than three noisy pixels in the level2.evt file, extra rows are filled as -1
| Pixel properties | Quadrant properties | ||||||
|---|---|---|---|---|---|---|---|
| Quadrant | DetID | PixID | Counts | Sigma | Mean | Median | Sigma |
| A | 10 | 83 | 323647 | 2496.36 | 640 | 628 | 129.4 |
| A | 9 | 143 | 185999 | 1432.59 | 640 | 628 | 129.4 |
| A | 6 | 10 | 106935 | 821.56 | 640 | 628 | 129.4 |
| B | 5 | 172 | 129543 | 1049.68 | 637 | 620 | 122.8 |
| B | 0 | 189 | 68366 | 551.58 | 637 | 620 | 122.8 |
| B | 0 | 230 | 37436 | 299.75 | 637 | 620 | 122.8 |
| C | 15 | 214 | 253715 | 1754.67 | 621 | 626 | 144.2 |
| C | 0 | 10 | 50549 | 346.12 | 621 | 626 | 144.2 |
| C | 14 | 254 | 18273 | 122.35 | 621 | 626 | 144.2 |
| D | 2 | 249 | 107133 | 692.55 | 624 | 606 | 153.8 |
| D | 5 | 222 | 91203 | 588.99 | 624 | 606 | 153.8 |
| D | 10 | 199 | 57007 | 366.67 | 624 | 606 | 153.8 |
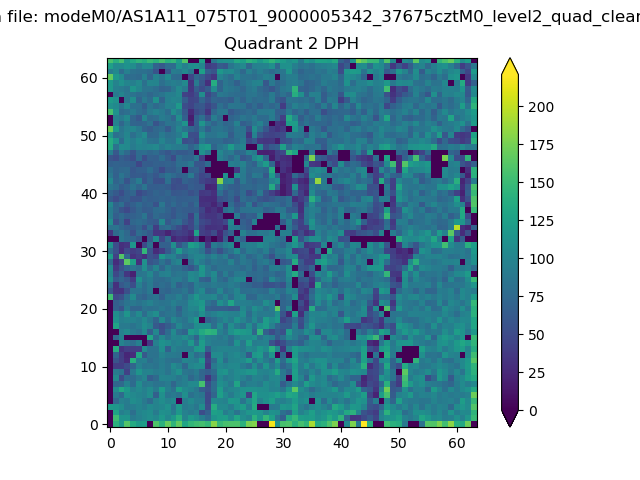
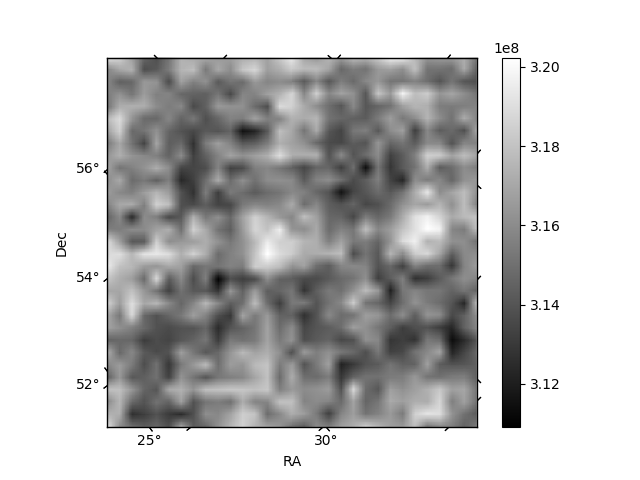
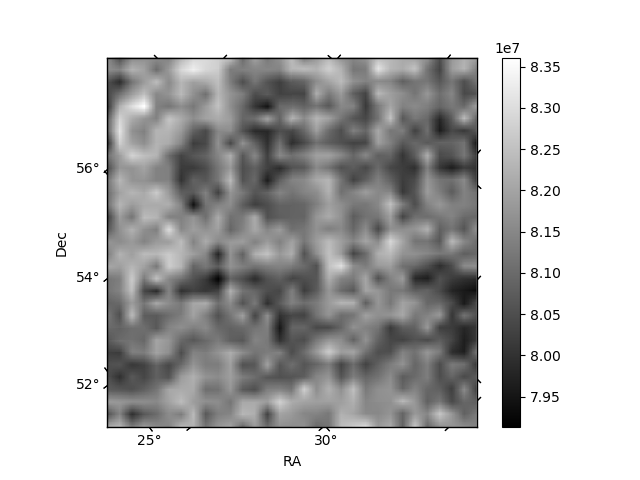
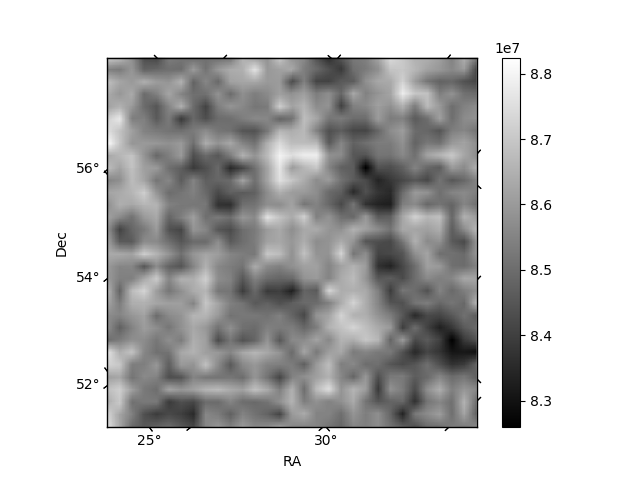
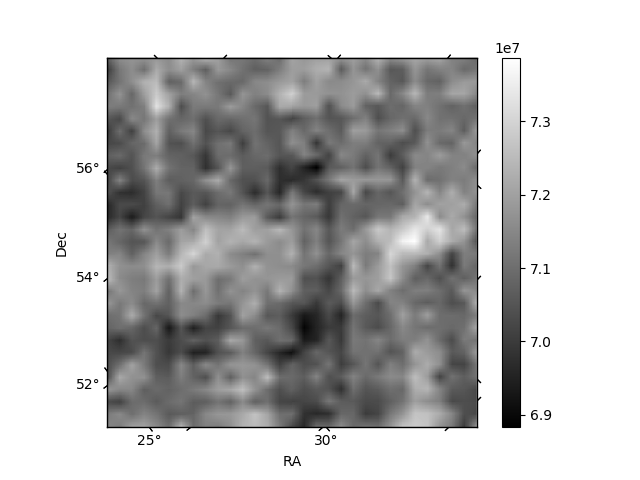
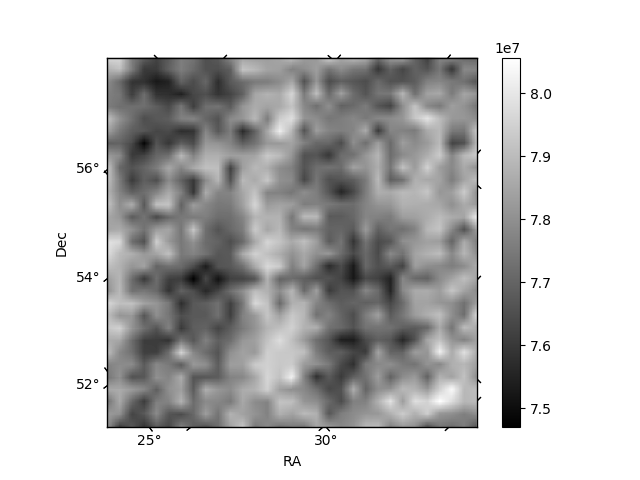
Histogram calculated using DETX and DETY for each event in the final _common_clean file
| Quadrant A | 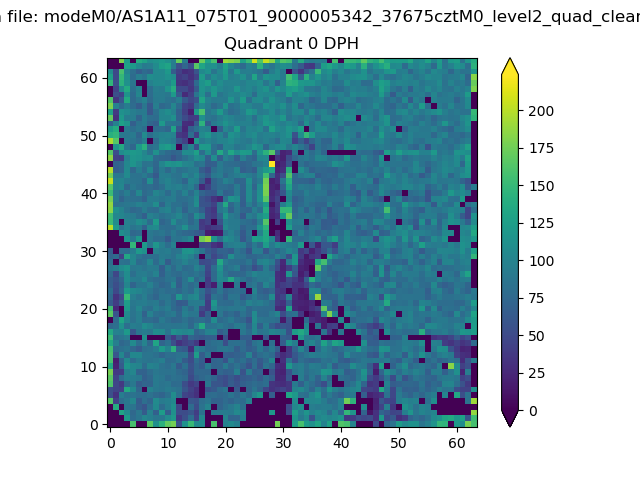 |
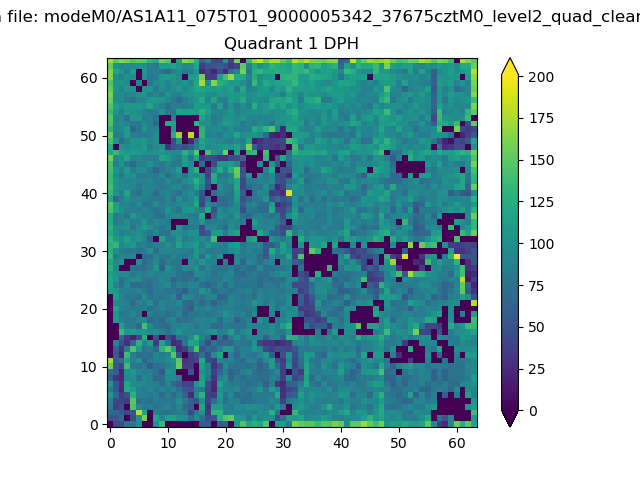 |
Quadrant B |
|---|---|---|---|
| Quadrant D | 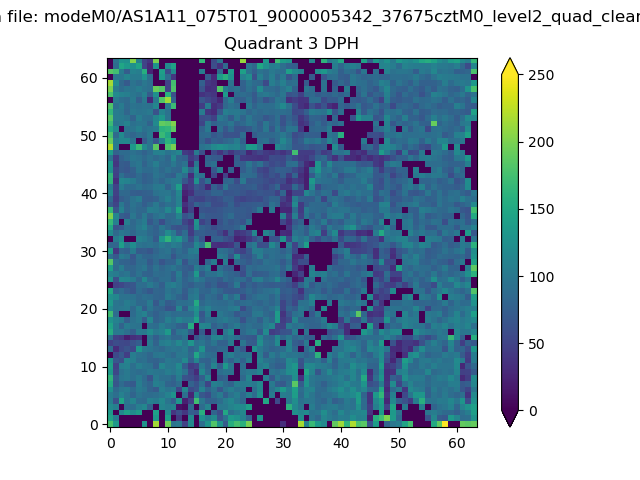 |
 |
Quadrant C |
| Plot type | Count rate plots | Images |
|---|---|---|
| Comparison with Poisson distribution Blue bars denote a histogram of data divided into 1 sec bins. Red curve is a Poisson curve with rate = median count rate of data. |
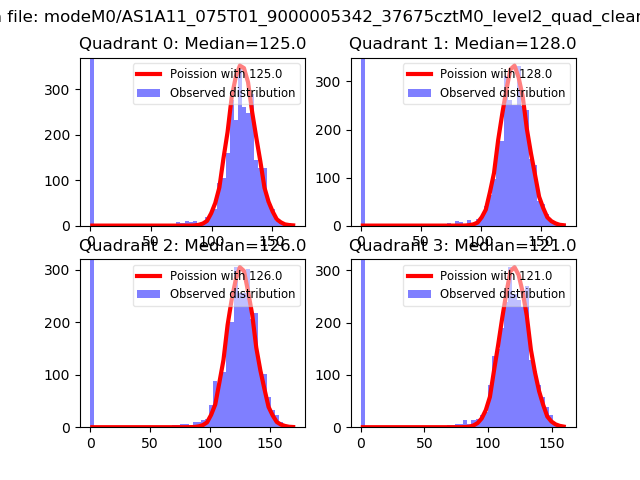 |
 |
| Quadrant-wise count rates Data is divided into 100 sec bins |
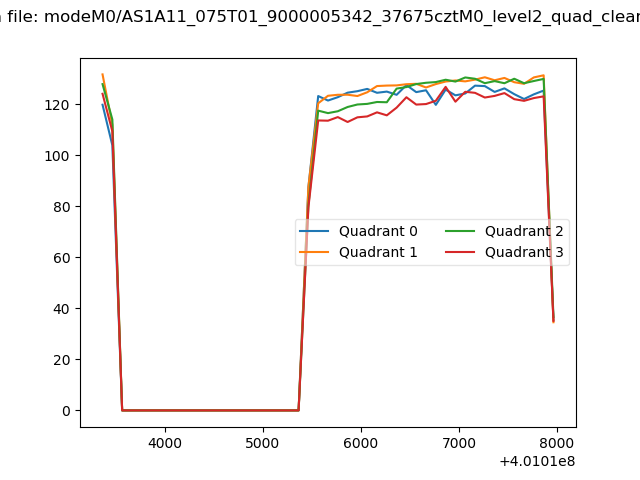 |
|
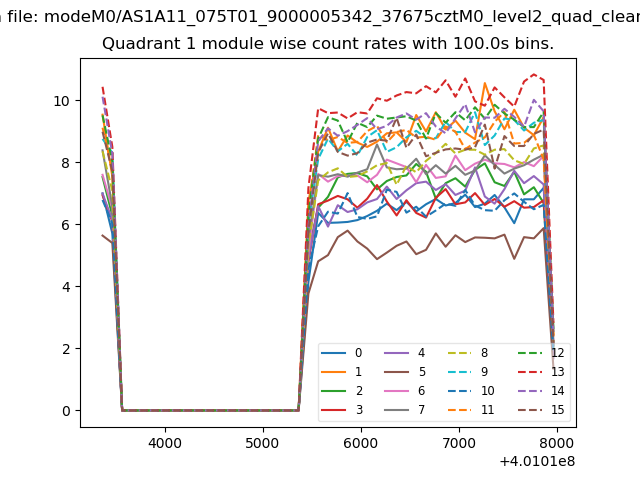
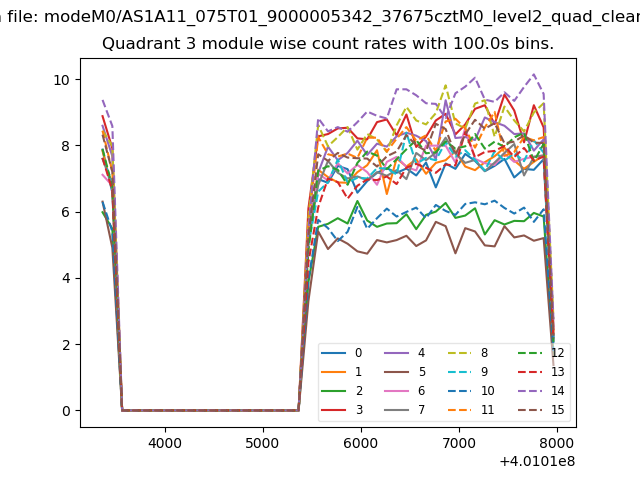
| Module-wise count rates for Quadrant A Data is divided into 100 sec bins |
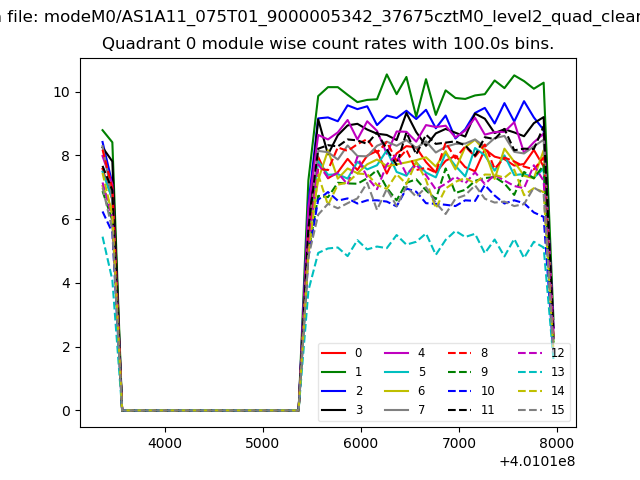 |
 |
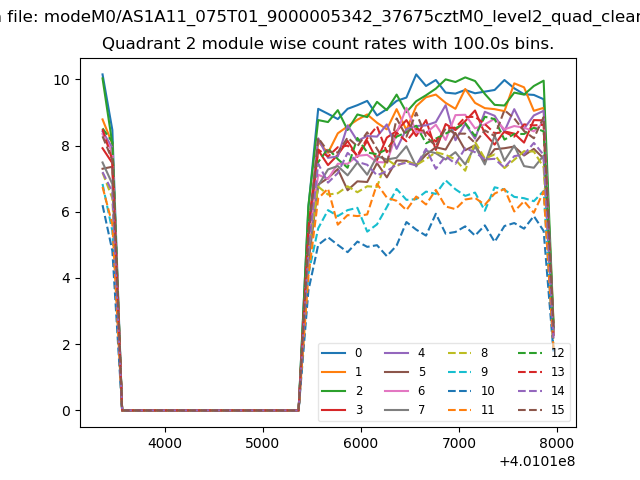
| Module-wise count rates for Quadrant B Data is divided into 100 sec bins |
 |
 |
| Module-wise count rates for Quadrant C Data is divided into 100 sec bins |
 |
 |
| Module-wise count rates for Quadrant D Data is divided into 100 sec bins |
 |
 |
| Parameter | Plot |
|---|---|
| CZT HV Monitor | 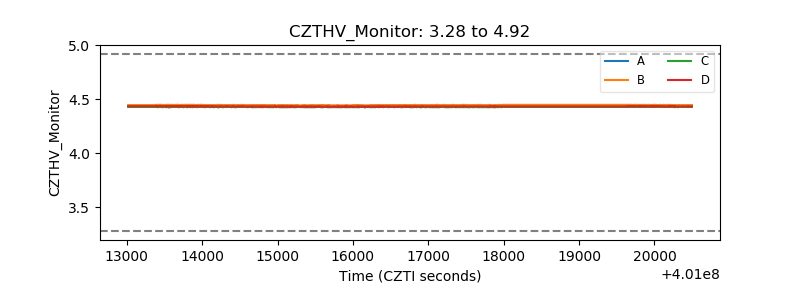 |
| D_VDD | 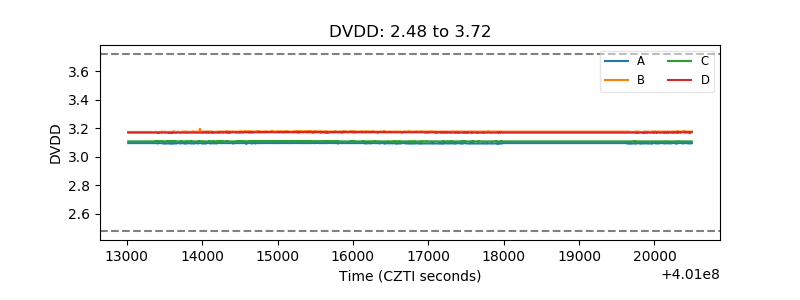 |
| Temperature 1 | 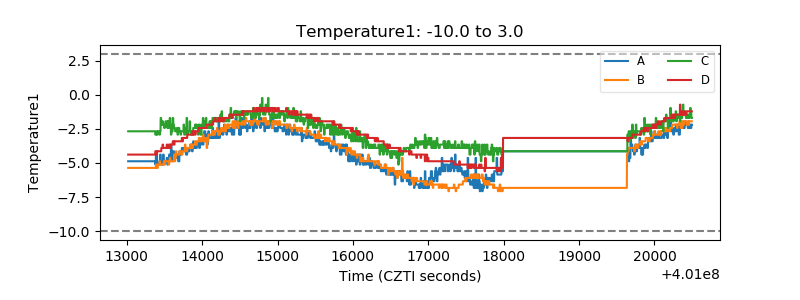 |
| Veto HV Monitor | 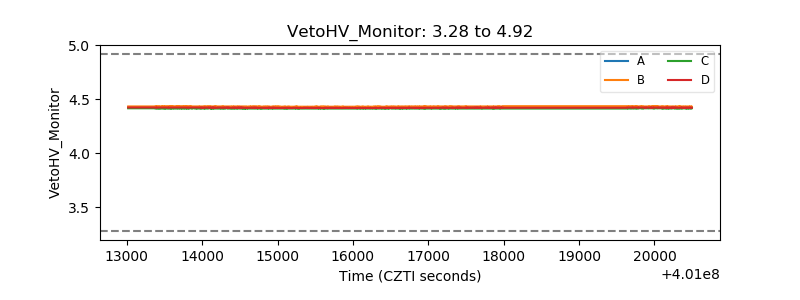 |
| Veto LLD | 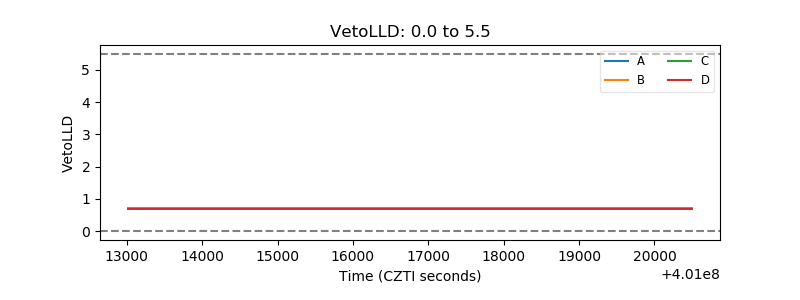 |
| Alpha Counter | 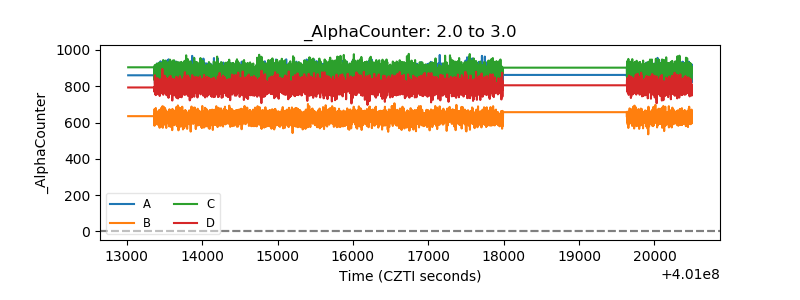 |
| _CPM_Rate | 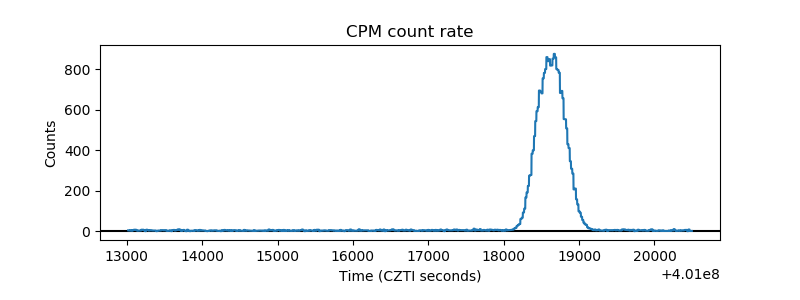 |
| CZT Counter | 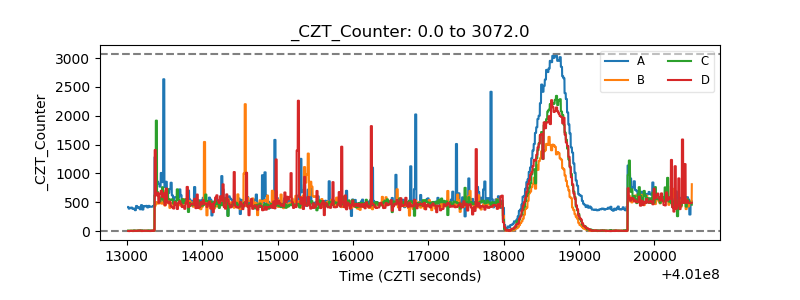 |
| +2.5 Volts monitor | 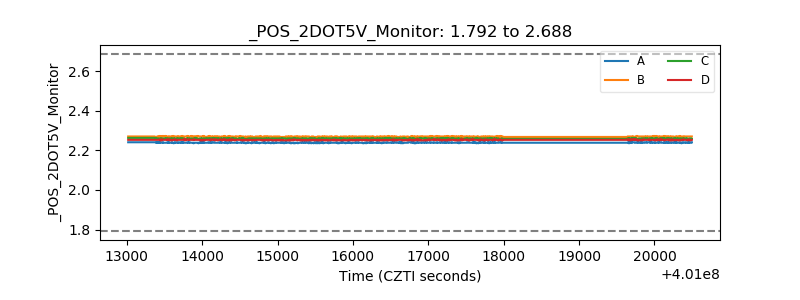 |
| +5 Volts monitor | 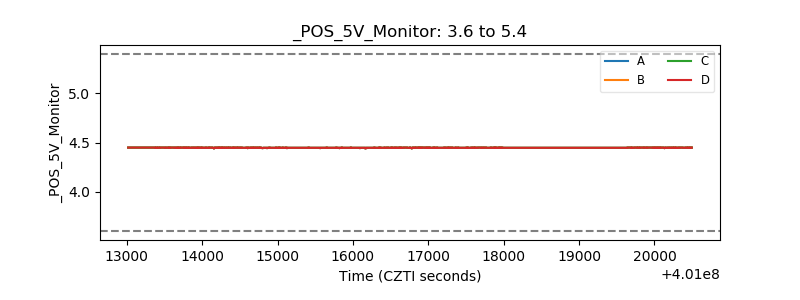 |
| _ROLL_ROT | 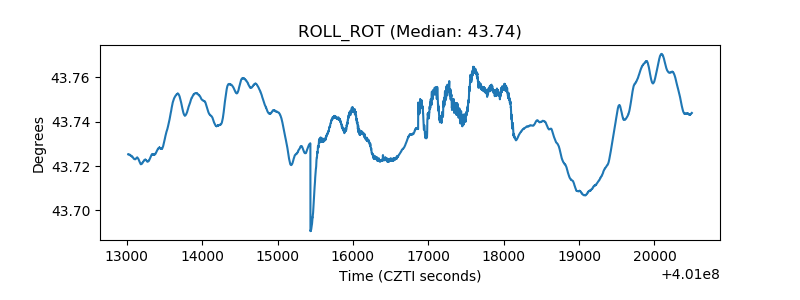 |
| _Roll_DEC | 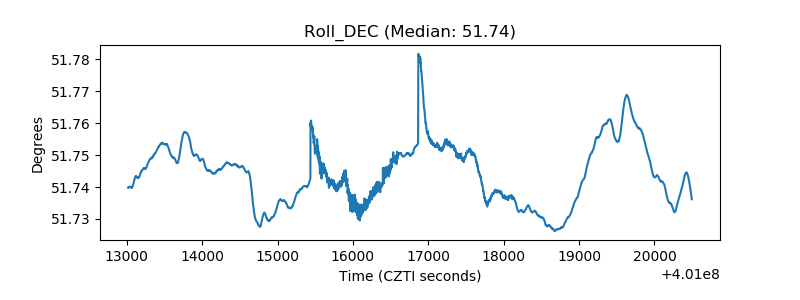 |
| _Roll_RA | 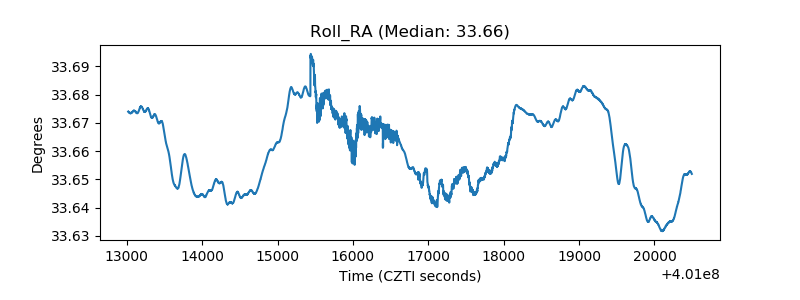 |
| Veto Counter | 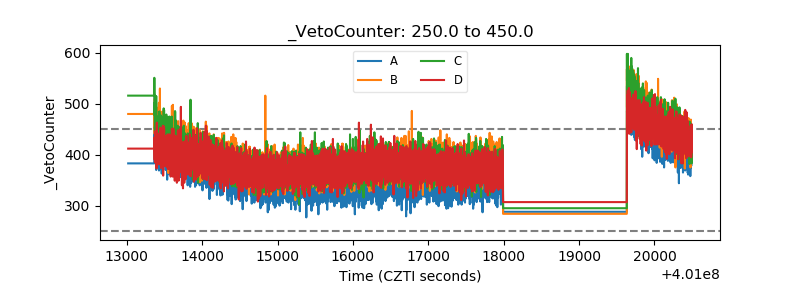 |