| Param | Original file | Final file |
|---|---|---|
| Filename | modeM0/AS1A11_075T01_9000005342_37677cztM0_level2.evt | modeM0/AS1A11_075T01_9000005342_37677cztM0_level2_quad_clean.evt |
| Size (bytes) | 438,641,280 | 58,671,360 |
| Size | 418.3 MB | 56.0 MB |
| Events in quadrant A | 3,131,990 | 353,096 |
| Events in quadrant B | 3,082,271 | 357,435 |
| Events in quadrant C | 2,768,326 | 356,380 |
| Events in quadrant D | 3,939,685 | 335,991 |
| Mode SS | |||
|---|---|---|---|
| Quadrant | BADHDUFLAG | Total packets | Discarded packets |
| A | 0 | 108 | 0 |
| B | 0 | 108 | 0 |
| C | 0 | 108 | 0 |
| D | 0 | 108 | 0 |
| Mode M0 | |||
|---|---|---|---|
| Quadrant | BADHDUFLAG | Total packets | Discarded packets |
| A | 0 | 12639 | 3 |
| B | 0 | 12453 | 2 |
| C | 0 | 11250 | 2 |
| D | 0 | 15261 | 2 |
| Mode M9 | |||
|---|---|---|---|
| Quadrant | BADHDUFLAG | Total packets | Discarded packets |
| A | 0 | 29 | 0 |
| B | 0 | 29 | 0 |
| C | 0 | 29 | 0 |
| D | 0 | 30 | 0 |
| Quadrant | Total seconds | Saturated seconds | Saturation percentage |
|---|---|---|---|
| A | 5336 | 35 | 0.655922% |
| B | 5336 | 84 | 1.574213% |
| C | 5336 | 16 | 0.299850% |
| D | 5336 | 198 | 3.710645% |
Noise dominated data is calculated using 1-second bins in cleaned event files. If a bin has >2000 counts, and if more than 50% of those come from <1% of pixels, then it is considered to be noise-dominated and hence unusable.
| Quadrant | # 1 sec bins | Bins with >0 counts | Bins with >2000 counts | High rate bins dominated by noise | Noise dominated (total time) | Noise dominated (detector-on time) | Marked lightcurve |
|---|---|---|---|---|---|---|---|
| A | 7129 | 5337 | 10 | 10 | 0.14% | 0.19% | 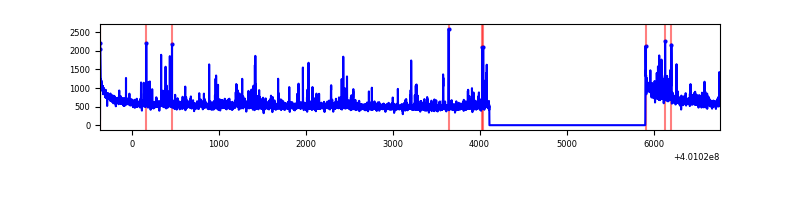 |
| B | 7128 | 5335 | 70 | 70 | 0.98% | 1.31% | 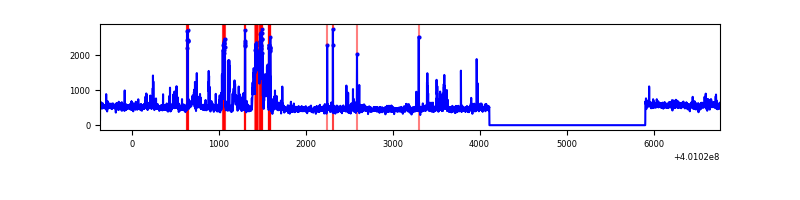 |
| C | 7128 | 5335 | 10 | 10 | 0.14% | 0.19% | 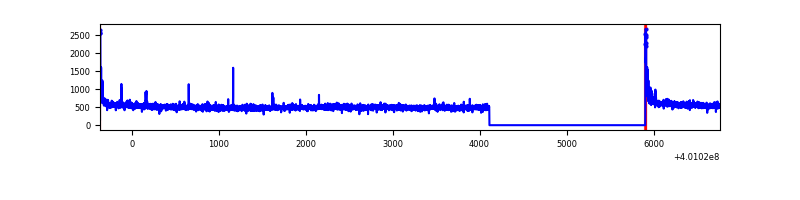 |
| D | 7128 | 5335 | 191 | 191 | 2.68% | 3.58% | 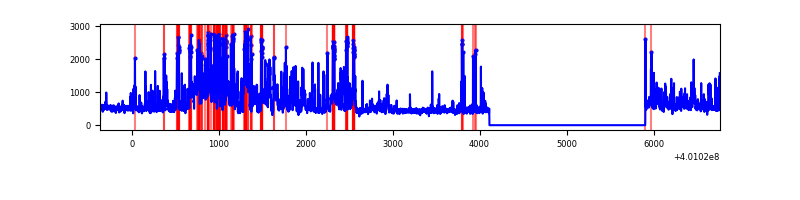 |
Top three noisy pixels from each quadrant. If the there are fewer than three noisy pixels in the level2.evt file, extra rows are filled as -1
| Pixel properties | Quadrant properties | ||||||
|---|---|---|---|---|---|---|---|
| Quadrant | DetID | PixID | Counts | Sigma | Mean | Median | Sigma |
| A | 10 | 83 | 319855 | 2470.25 | 644 | 631 | 129.2 |
| A | 9 | 143 | 111477 | 857.76 | 644 | 631 | 129.2 |
| A | 6 | 10 | 100226 | 770.7 | 644 | 631 | 129.2 |
| B | 5 | 172 | 308594 | 2525.54 | 638 | 622 | 121.9 |
| B | 5 | 200 | 73246 | 595.56 | 638 | 622 | 121.9 |
| B | 5 | 255 | 42825 | 346.09 | 638 | 622 | 121.9 |
| C | 15 | 214 | 247927 | 1717.52 | 625 | 631 | 144.0 |
| C | 0 | 10 | 63306 | 435.29 | 625 | 631 | 144.0 |
| C | 14 | 254 | 14387 | 95.54 | 625 | 631 | 144.0 |
| D | 12 | 227 | 1044372 | 6881.9 | 621 | 603 | 151.7 |
| D | 5 | 222 | 193677 | 1273.0 | 621 | 603 | 151.7 |
| D | 5 | 70 | 79727 | 521.69 | 621 | 603 | 151.7 |
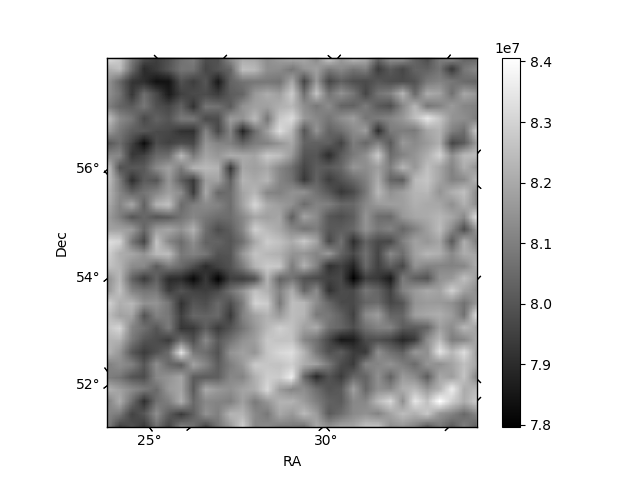
Histogram calculated using DETX and DETY for each event in the final _common_clean file
| Quadrant A | 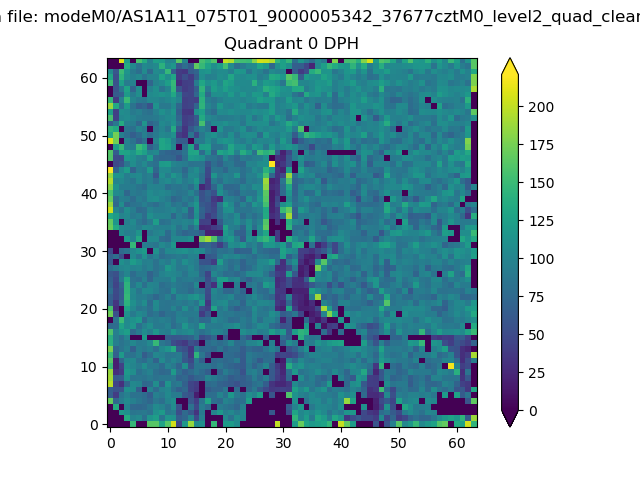 |
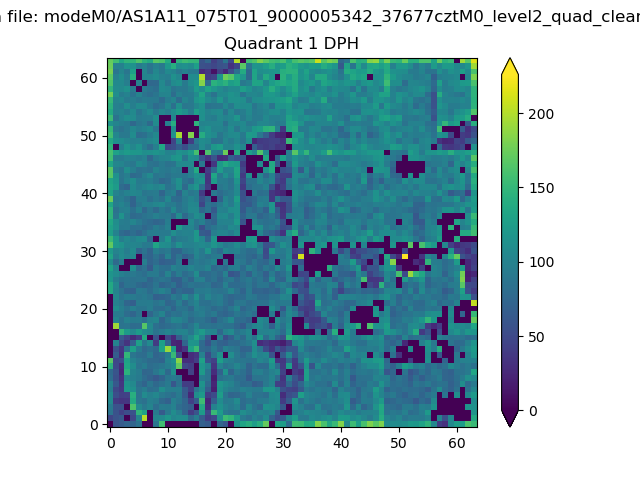 |
Quadrant B |
|---|---|---|---|
| Quadrant D | 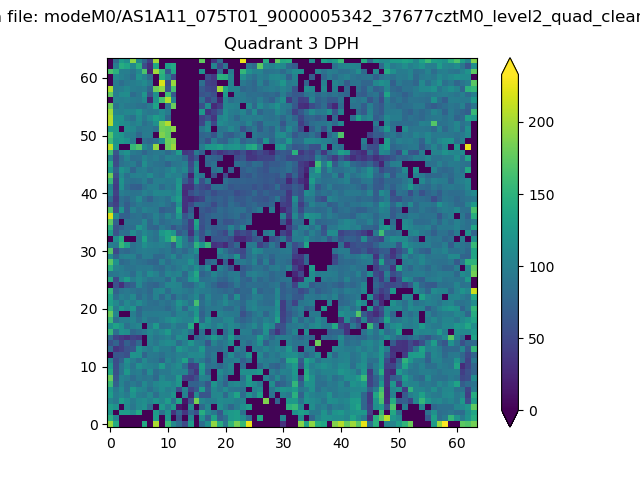 |
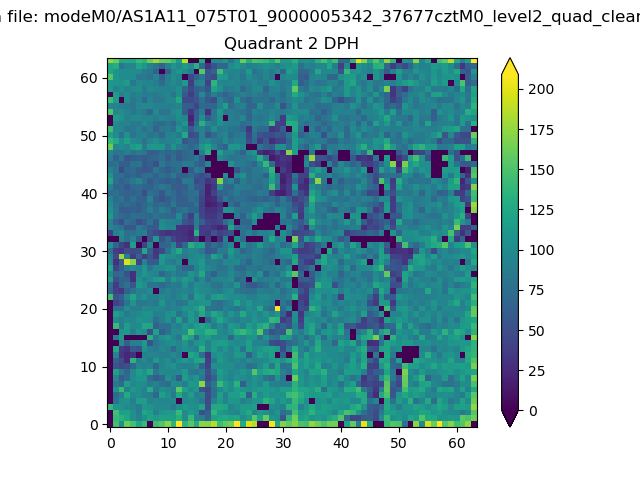 |
Quadrant C |
| Plot type | Count rate plots | Images |
|---|---|---|
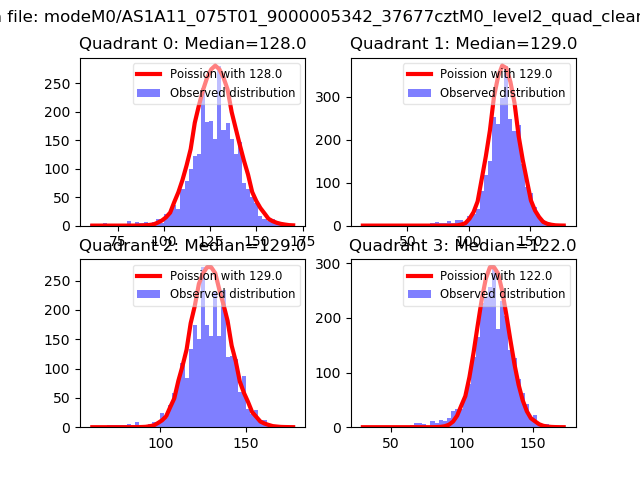
| Comparison with Poisson distribution Blue bars denote a histogram of data divided into 1 sec bins. Red curve is a Poisson curve with rate = median count rate of data. |
 |
 |
| Quadrant-wise count rates Data is divided into 100 sec bins |
 |
|
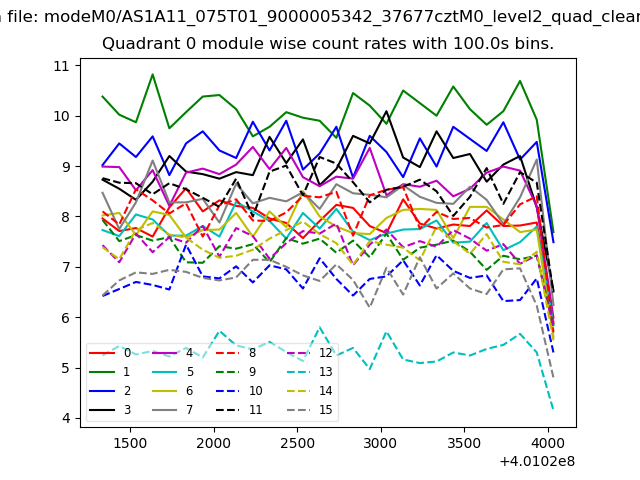
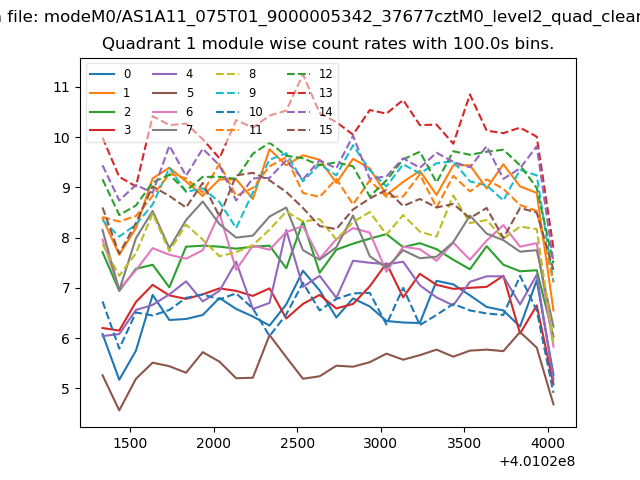
| Module-wise count rates for Quadrant A Data is divided into 100 sec bins |
 |
 |
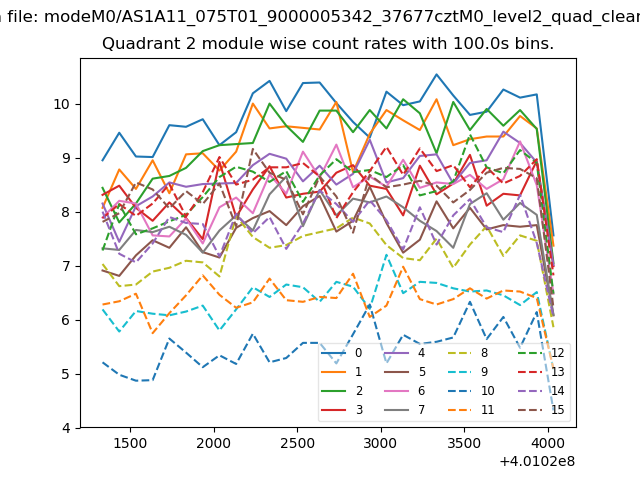
| Module-wise count rates for Quadrant B Data is divided into 100 sec bins |
 |
 |
| Module-wise count rates for Quadrant C Data is divided into 100 sec bins |
 |
 |
| Module-wise count rates for Quadrant D Data is divided into 100 sec bins |
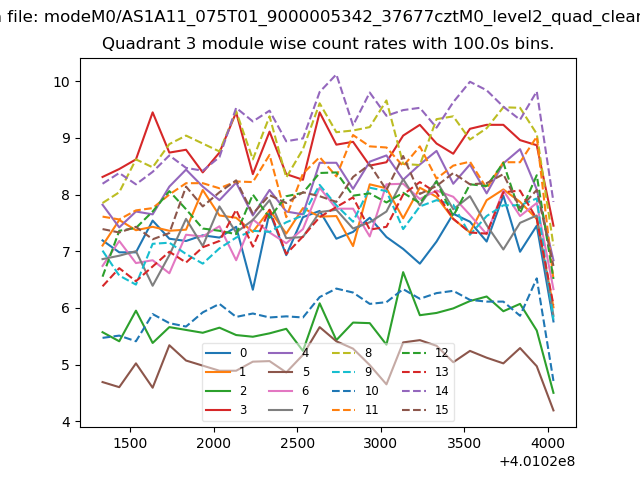 |
 |
| Parameter | Plot |
|---|---|
| CZT HV Monitor | 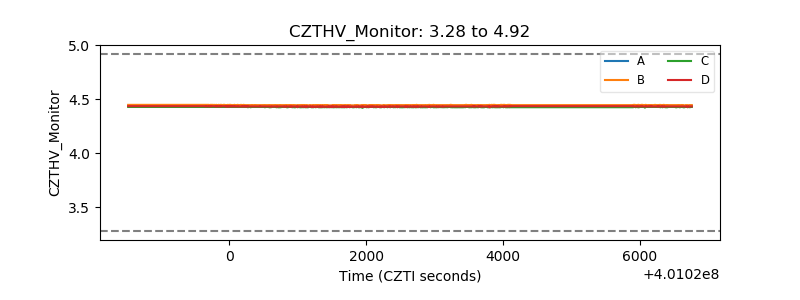 |
| D_VDD | 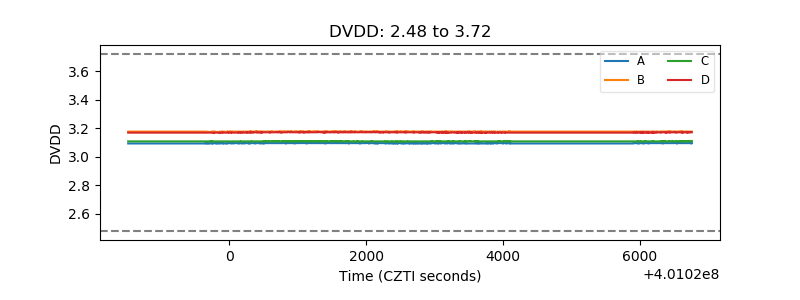 |
| Temperature 1 | 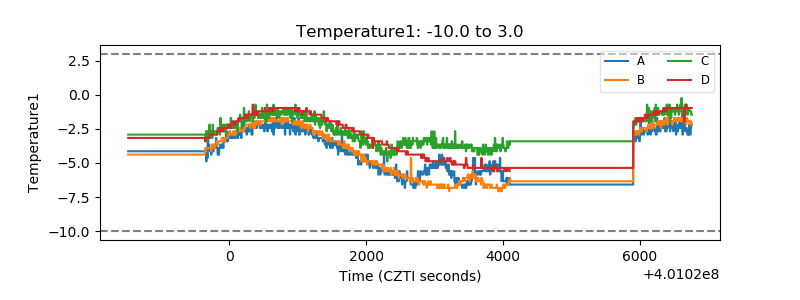 |
| Veto HV Monitor | 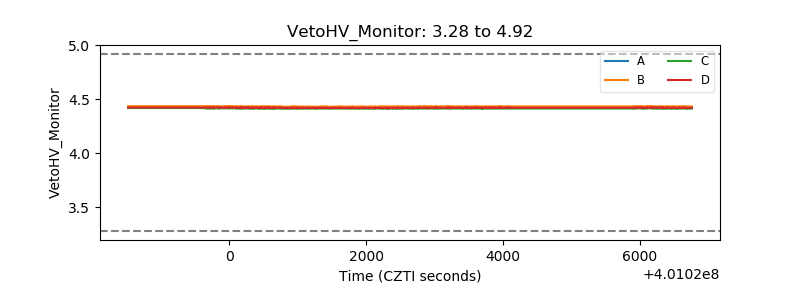 |
| Veto LLD | 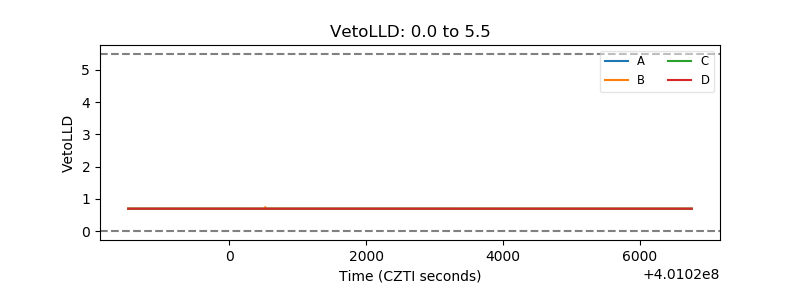 |
| Alpha Counter | 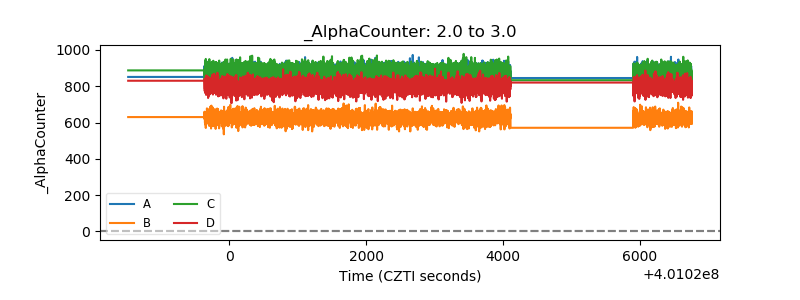 |
| _CPM_Rate | 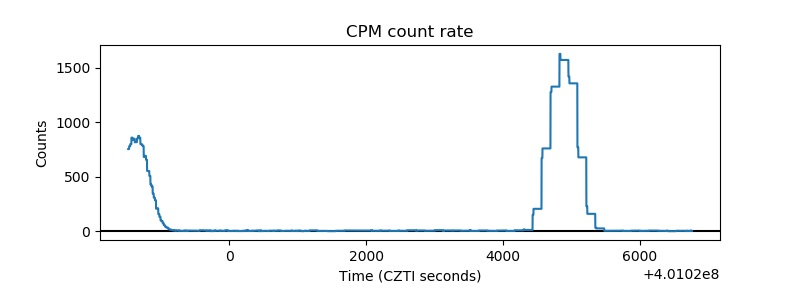 |
| CZT Counter | 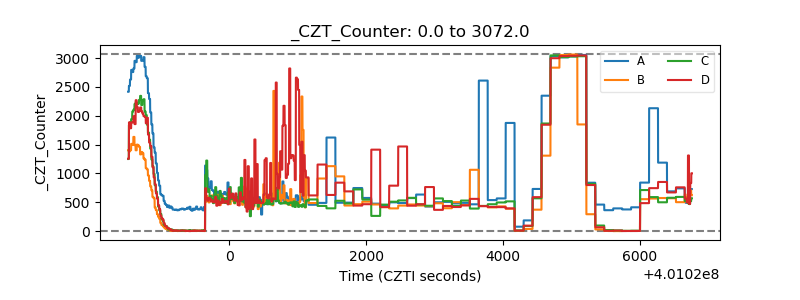 |
| +2.5 Volts monitor | 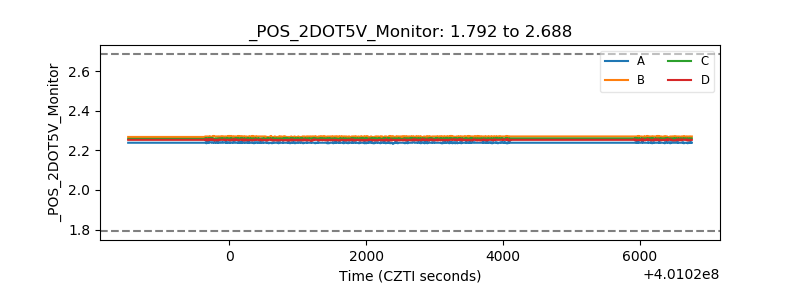 |
| +5 Volts monitor | 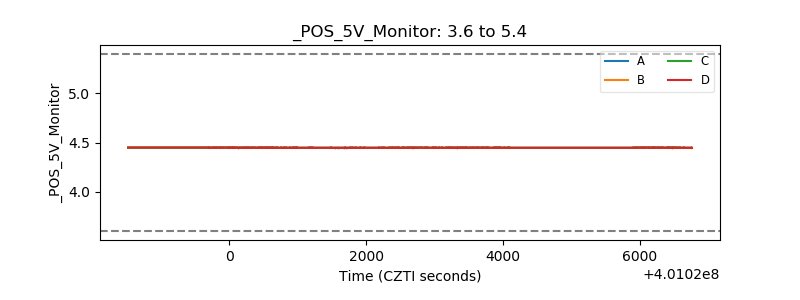 |
| _ROLL_ROT | 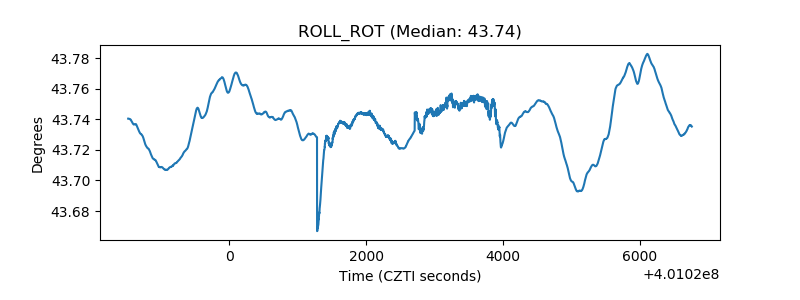 |
| _Roll_DEC | 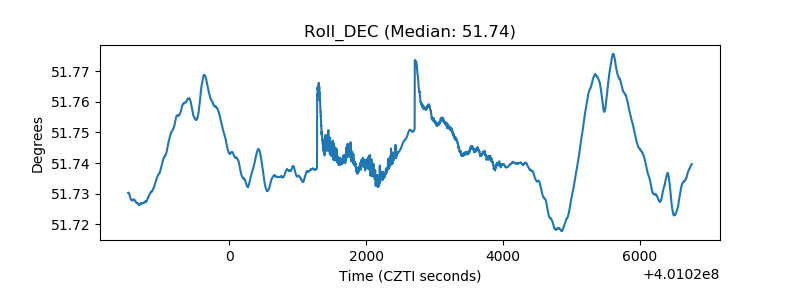 |
| _Roll_RA | 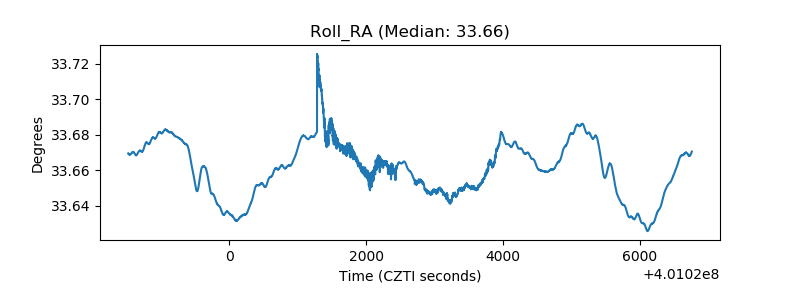 |
| Veto Counter | 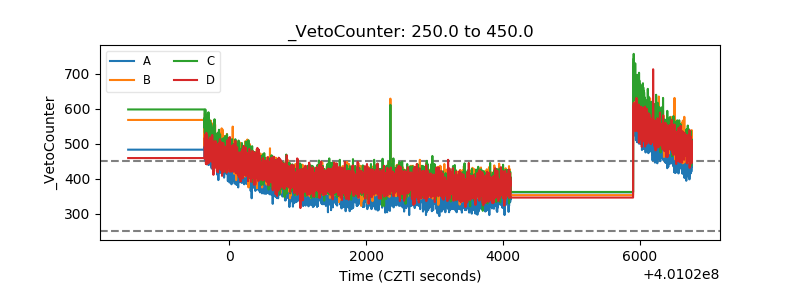 |