| Param | Original file | Final file |
|---|---|---|
| Filename | modeM0/AS1A11_075T01_9000005342_37679cztM0_level2.evt | modeM0/AS1A11_075T01_9000005342_37679cztM0_level2_quad_clean.evt |
| Size (bytes) | 406,356,480 | 82,900,800 |
| Size | 387.5 MB | 79.1 MB |
| Events in quadrant A | 3,141,905 | 539,847 |
| Events in quadrant B | 2,874,320 | 550,060 |
| Events in quadrant C | 2,896,203 | 548,175 |
| Events in quadrant D | 3,052,849 | 520,109 |
| Mode SS | |||
|---|---|---|---|
| Quadrant | BADHDUFLAG | Total packets | Discarded packets |
| A | 0 | 102 | 0 |
| B | 0 | 102 | 0 |
| C | 0 | 102 | 0 |
| D | 0 | 102 | 0 |
| Mode M0 | |||
|---|---|---|---|
| Quadrant | BADHDUFLAG | Total packets | Discarded packets |
| A | 0 | 12599 | 3 |
| B | 0 | 11816 | 2 |
| C | 0 | 11621 | 2 |
| D | 0 | 12385 | 2 |
| Mode M9 | |||
|---|---|---|---|
| Quadrant | BADHDUFLAG | Total packets | Discarded packets |
| A | 0 | 38 | 0 |
| B | 0 | 38 | 0 |
| C | 0 | 38 | 0 |
| D | 0 | 39 | 0 |
| Quadrant | Total seconds | Saturated seconds | Saturation percentage |
|---|---|---|---|
| A | 5027 | 30 | 0.596777% |
| B | 5027 | 57 | 1.133877% |
| C | 5027 | 42 | 0.835488% |
| D | 5027 | 40 | 0.795703% |
Noise dominated data is calculated using 1-second bins in cleaned event files. If a bin has >2000 counts, and if more than 50% of those come from <1% of pixels, then it is considered to be noise-dominated and hence unusable.
| Quadrant | # 1 sec bins | Bins with >0 counts | Bins with >2000 counts | High rate bins dominated by noise | Noise dominated (total time) | Noise dominated (detector-on time) | Marked lightcurve |
|---|---|---|---|---|---|---|---|
| A | 7059 | 5028 | 15 | 15 | 0.21% | 0.30% | 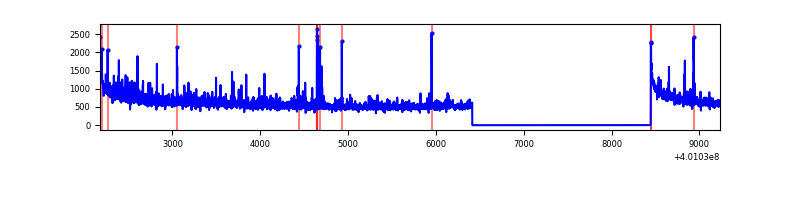 |
| B | 7058 | 5027 | 37 | 37 | 0.52% | 0.74% | 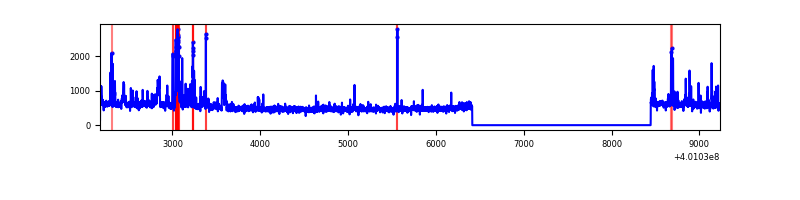 |
| C | 7058 | 5026 | 39 | 39 | 0.55% | 0.78% | 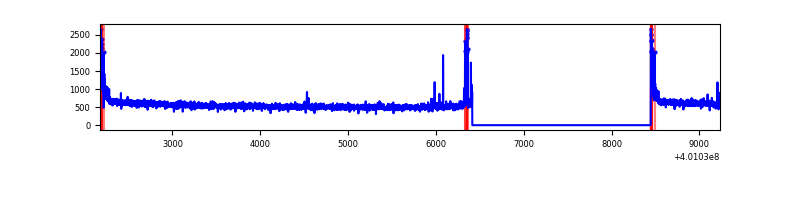 |
| D | 7058 | 5026 | 29 | 29 | 0.41% | 0.58% | 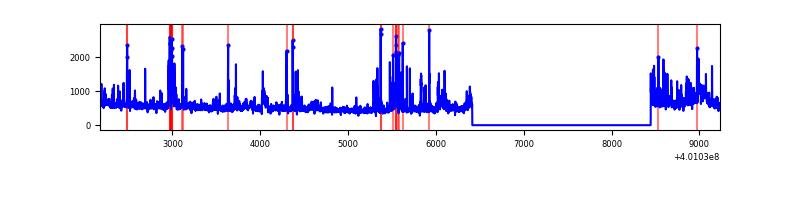 |
Top three noisy pixels from each quadrant. If the there are fewer than three noisy pixels in the level2.evt file, extra rows are filled as -1
| Pixel properties | Quadrant properties | ||||||
|---|---|---|---|---|---|---|---|
| Quadrant | DetID | PixID | Counts | Sigma | Mean | Median | Sigma |
| A | 10 | 83 | 316479 | 2461.8 | 644 | 633 | 128.3 |
| A | 6 | 10 | 142605 | 1106.57 | 644 | 633 | 128.3 |
| A | 15 | 222 | 99394 | 769.77 | 644 | 633 | 128.3 |
| B | 15 | 85 | 157548 | 1314.79 | 640 | 625 | 119.4 |
| B | 5 | 172 | 109835 | 915.03 | 640 | 625 | 119.4 |
| B | 0 | 230 | 33200 | 272.93 | 640 | 625 | 119.4 |
| C | 15 | 214 | 230532 | 1568.11 | 636 | 640 | 146.6 |
| C | 0 | 10 | 113590 | 770.44 | 636 | 640 | 146.6 |
| C | 14 | 254 | 63049 | 425.7 | 636 | 640 | 146.6 |
| D | 2 | 249 | 176994 | 1160.06 | 635 | 619 | 152.0 |
| D | 13 | 249 | 130404 | 853.63 | 635 | 619 | 152.0 |
| D | 12 | 227 | 87104 | 568.83 | 635 | 619 | 152.0 |
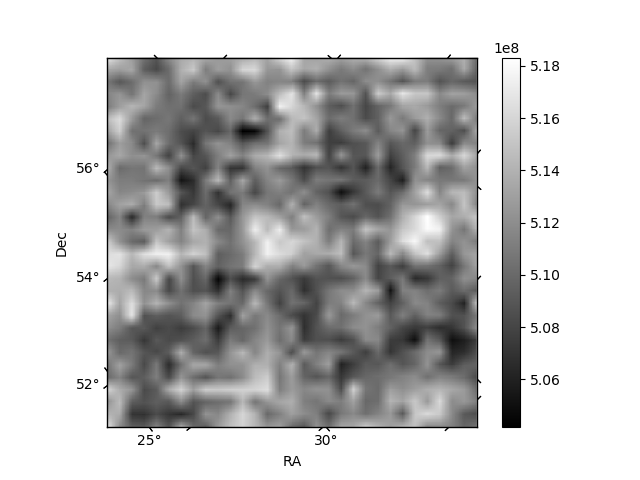
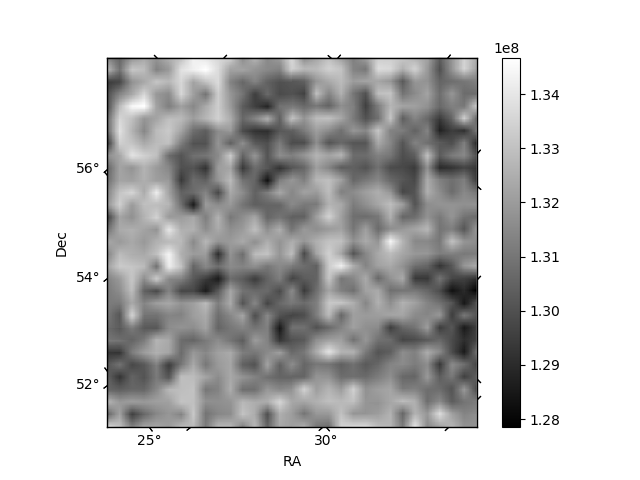
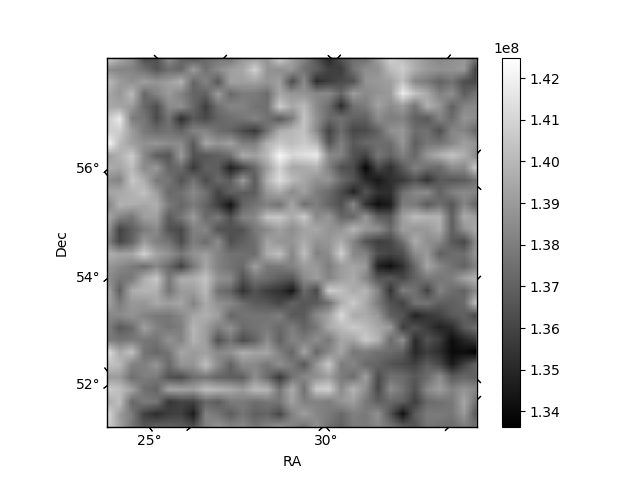
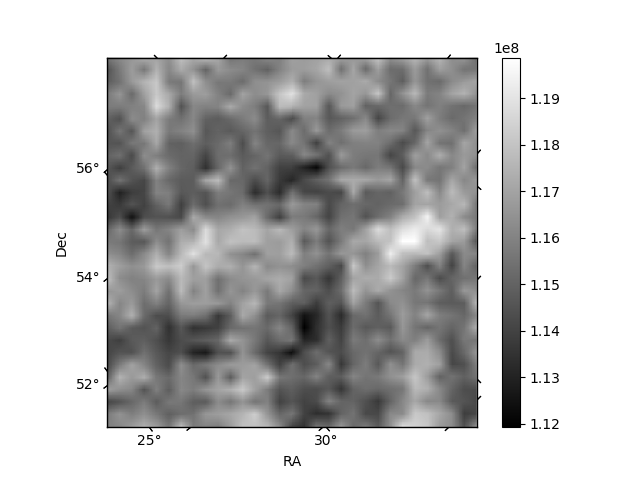
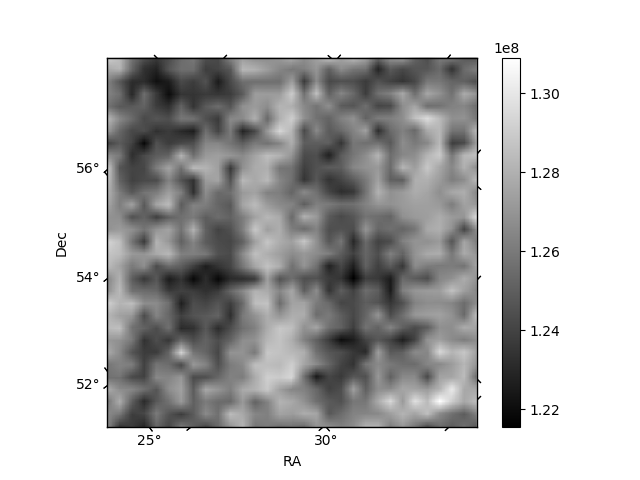
Histogram calculated using DETX and DETY for each event in the final _common_clean file
| Quadrant A | 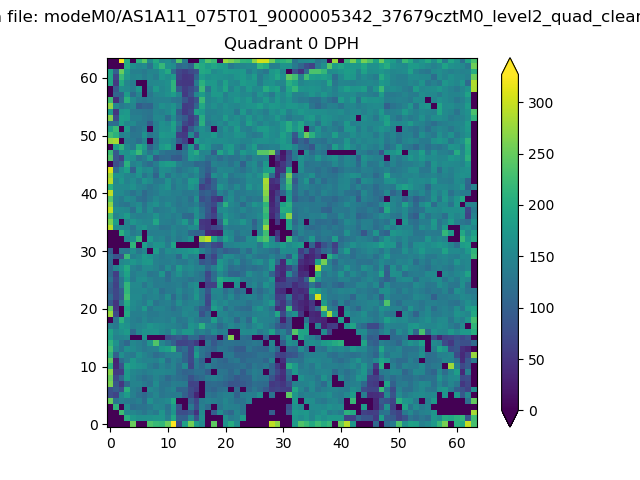 |
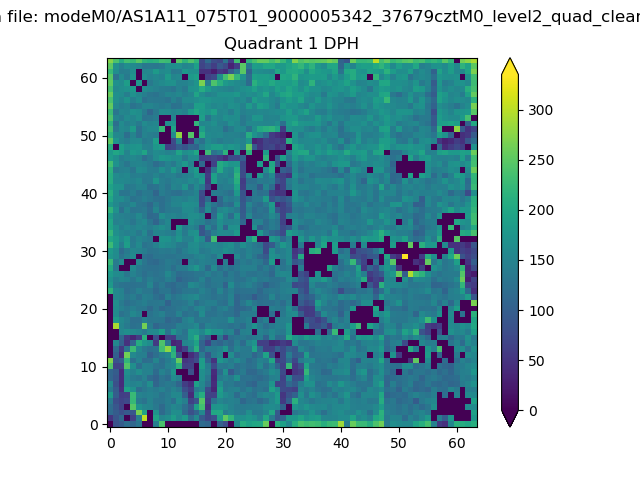 |
Quadrant B |
|---|---|---|---|
| Quadrant D | 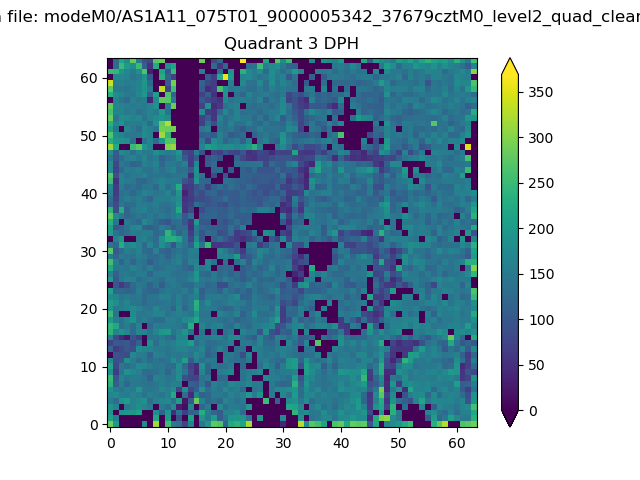 |
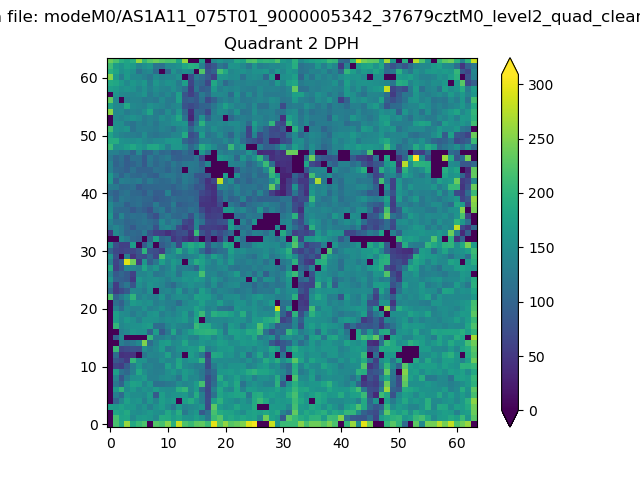 |
Quadrant C |
| Plot type | Count rate plots | Images |
|---|---|---|
| Comparison with Poisson distribution Blue bars denote a histogram of data divided into 1 sec bins. Red curve is a Poisson curve with rate = median count rate of data. |
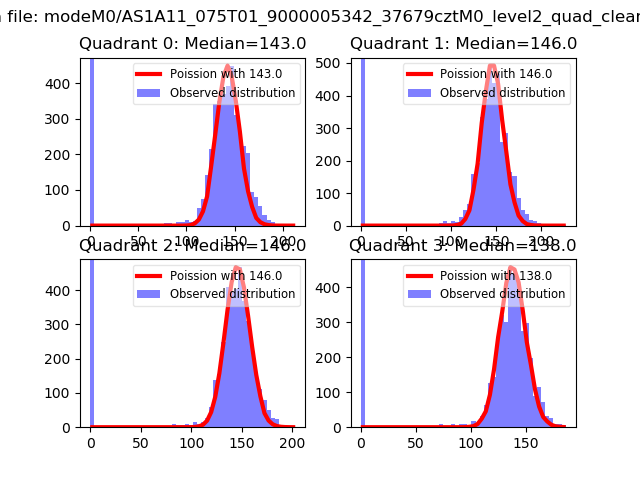 |
 |
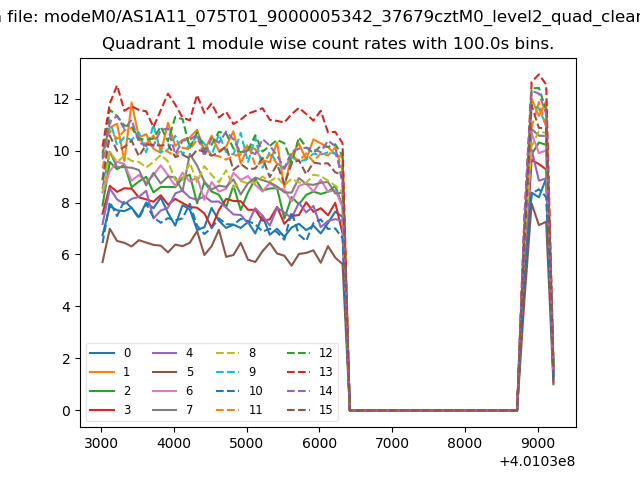
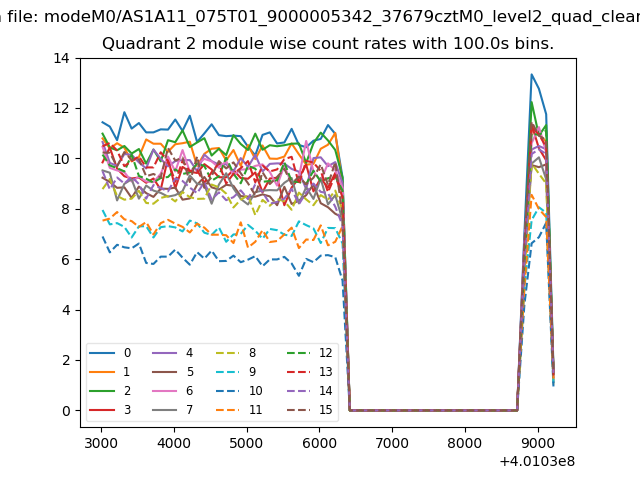
| Quadrant-wise count rates Data is divided into 100 sec bins |
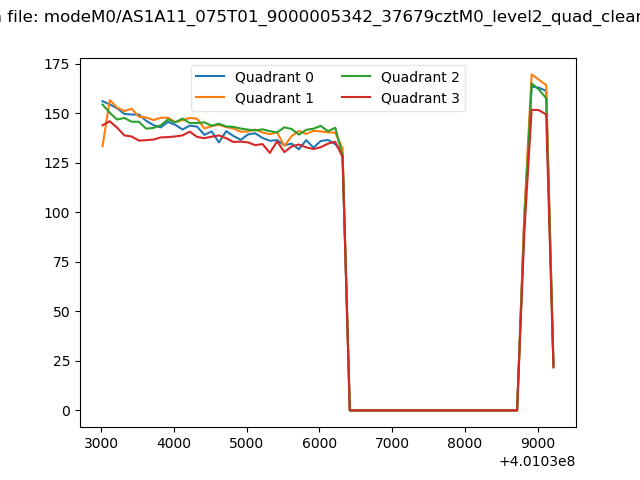 |
|
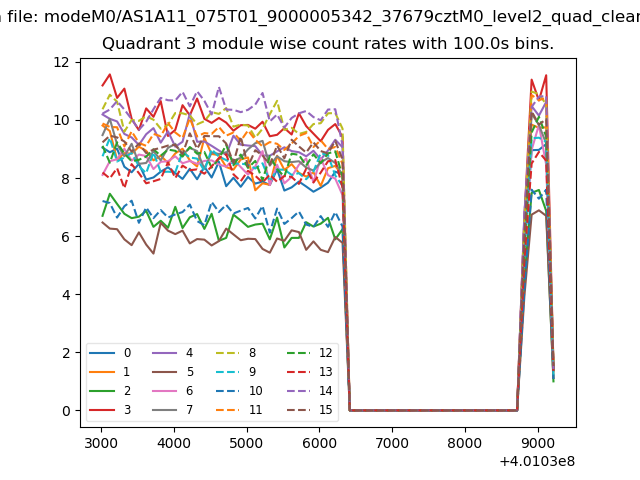
| Module-wise count rates for Quadrant A Data is divided into 100 sec bins |
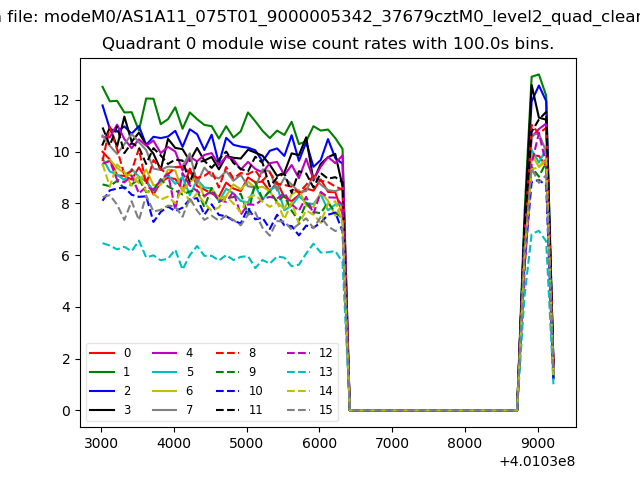 |
 |
| Module-wise count rates for Quadrant B Data is divided into 100 sec bins |
 |
 |
| Module-wise count rates for Quadrant C Data is divided into 100 sec bins |
 |
 |
| Module-wise count rates for Quadrant D Data is divided into 100 sec bins |
 |
 |
| Parameter | Plot |
|---|---|
| CZT HV Monitor | 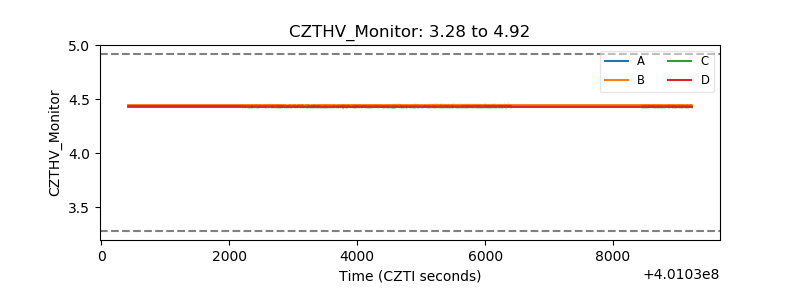 |
| D_VDD | 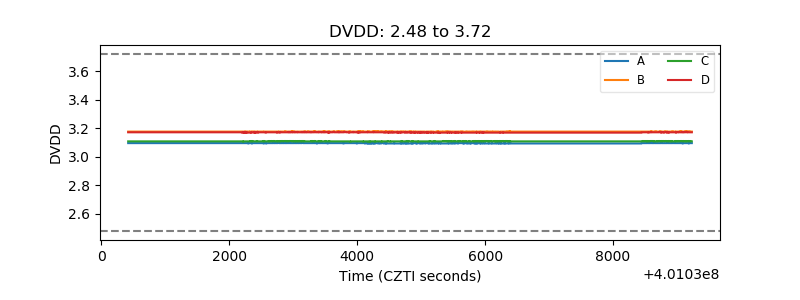 |
| Temperature 1 |  |
| Veto HV Monitor | 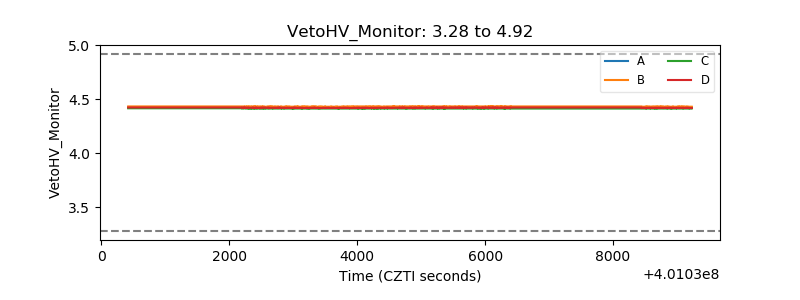 |
| Veto LLD | 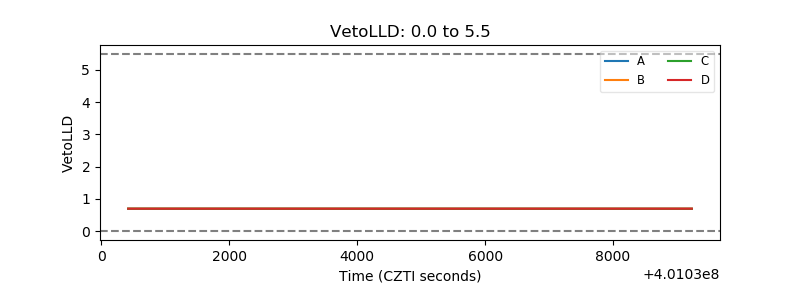 |
| Alpha Counter | 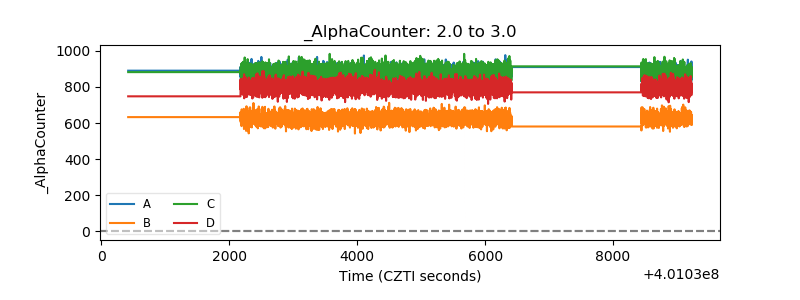 |
| _CPM_Rate | 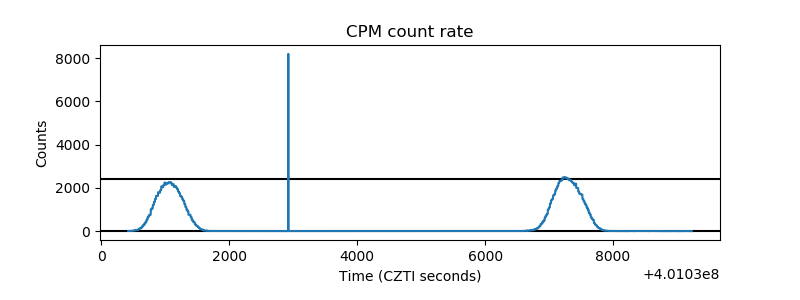 |
| CZT Counter | 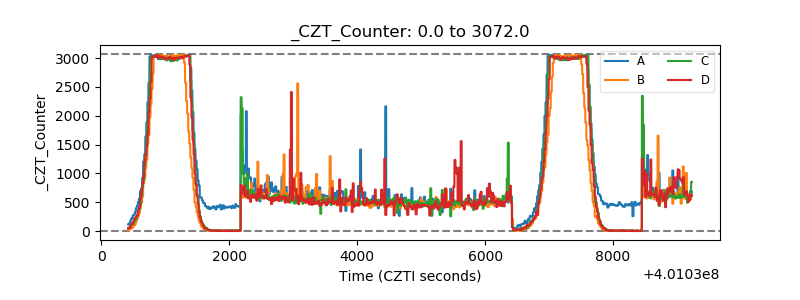 |
| +2.5 Volts monitor | 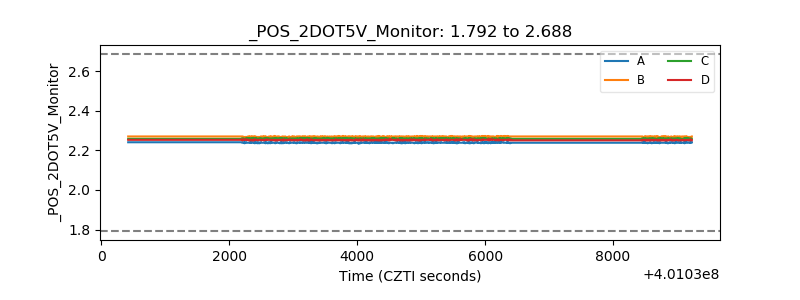 |
| +5 Volts monitor | 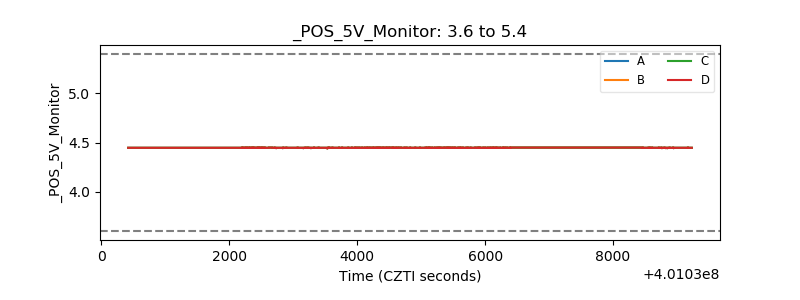 |
| _ROLL_ROT | 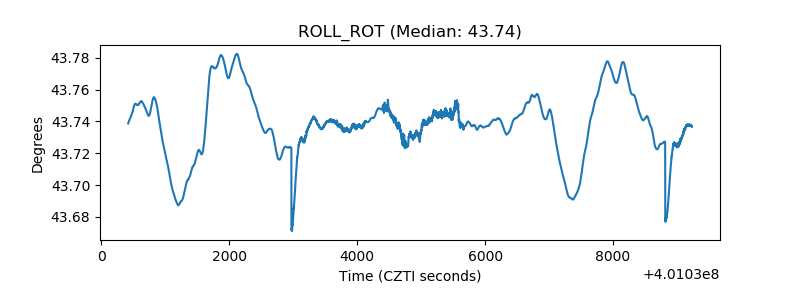 |
| _Roll_DEC | 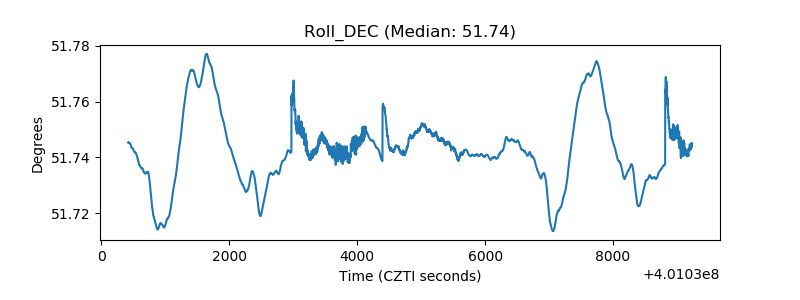 |
| _Roll_RA | 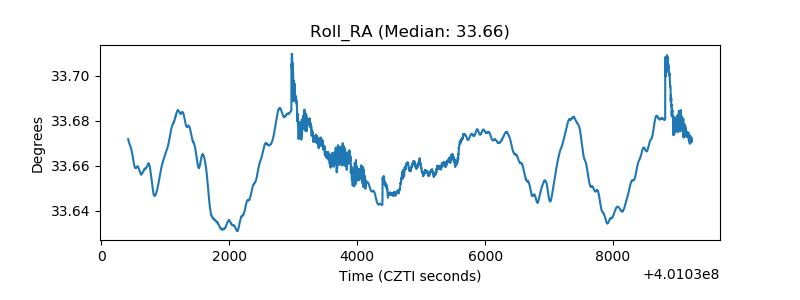 |
| Veto Counter | 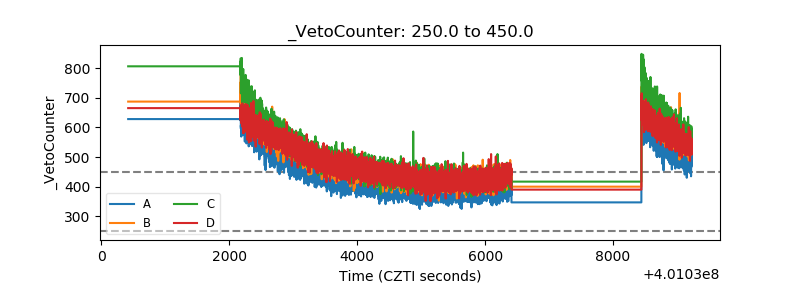 |