| Param | Original file | Final file |
|---|---|---|
| Filename | modeM0/AS1A11_075T01_9000005342_37680cztM0_level2.evt | modeM0/AS1A11_075T01_9000005342_37680cztM0_level2_quad_clean.evt |
| Size (bytes) | 438,189,120 | 98,553,600 |
| Size | 417.9 MB | 94.0 MB |
| Events in quadrant A | 2,952,088 | 660,868 |
| Events in quadrant B | 2,836,448 | 677,332 |
| Events in quadrant C | 2,943,168 | 676,092 |
| Events in quadrant D | 4,202,574 | 622,778 |
| Mode SS | |||
|---|---|---|---|
| Quadrant | BADHDUFLAG | Total packets | Discarded packets |
| A | 0 | 102 | 0 |
| B | 0 | 102 | 0 |
| C | 0 | 102 | 0 |
| D | 0 | 102 | 0 |
| Mode M0 | |||
|---|---|---|---|
| Quadrant | BADHDUFLAG | Total packets | Discarded packets |
| A | 0 | 11912 | 3 |
| B | 0 | 11511 | 2 |
| C | 0 | 11774 | 2 |
| D | 0 | 16001 | 2 |
| Mode M9 | |||
|---|---|---|---|
| Quadrant | BADHDUFLAG | Total packets | Discarded packets |
| A | 0 | 34 | 0 |
| B | 0 | 34 | 0 |
| C | 0 | 34 | 0 |
| D | 0 | 35 | 0 |
| Quadrant | Total seconds | Saturated seconds | Saturation percentage |
|---|---|---|---|
| A | 4955 | 32 | 0.645812% |
| B | 4955 | 79 | 1.594349% |
| C | 4955 | 53 | 1.069627% |
| D | 4955 | 267 | 5.388496% |
Noise dominated data is calculated using 1-second bins in cleaned event files. If a bin has >2000 counts, and if more than 50% of those come from <1% of pixels, then it is considered to be noise-dominated and hence unusable.
| Quadrant | # 1 sec bins | Bins with >0 counts | Bins with >2000 counts | High rate bins dominated by noise | Noise dominated (total time) | Noise dominated (detector-on time) | Marked lightcurve |
|---|---|---|---|---|---|---|---|
| A | 7078 | 4956 | 16 | 16 | 0.23% | 0.32% | 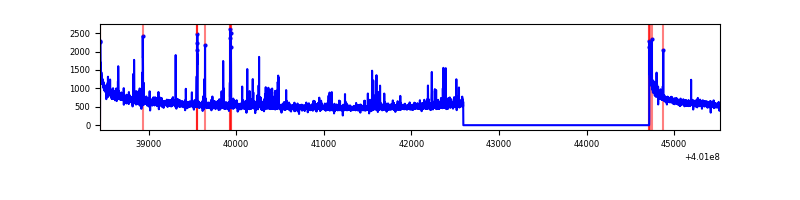 |
| B | 7078 | 4955 | 42 | 42 | 0.59% | 0.85% | 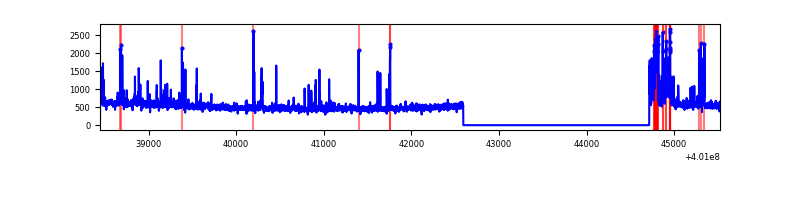 |
| C | 7077 | 4954 | 41 | 41 | 0.58% | 0.83% | 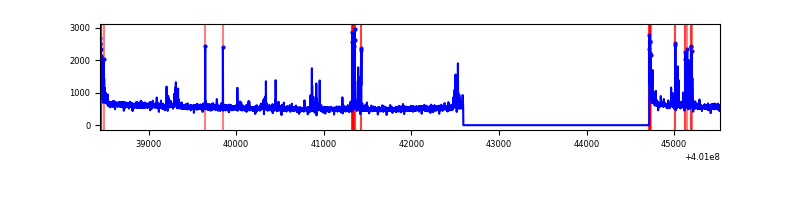 |
| D | 7077 | 4954 | 258 | 258 | 3.65% | 5.21% | 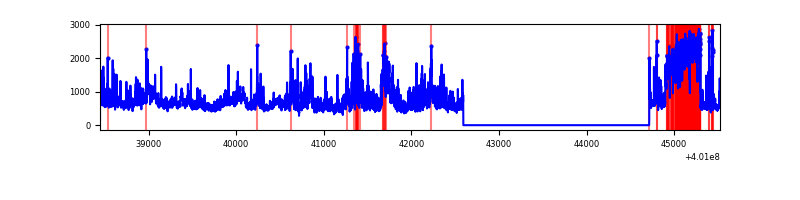 |
Top three noisy pixels from each quadrant. If the there are fewer than three noisy pixels in the level2.evt file, extra rows are filled as -1
| Pixel properties | Quadrant properties | ||||||
|---|---|---|---|---|---|---|---|
| Quadrant | DetID | PixID | Counts | Sigma | Mean | Median | Sigma |
| A | 10 | 83 | 314775 | 2515.93 | 624 | 613 | 124.9 |
| A | 9 | 143 | 91985 | 731.74 | 624 | 613 | 124.9 |
| A | 6 | 10 | 65595 | 520.4 | 624 | 613 | 124.9 |
| B | 5 | 172 | 147611 | 1269.65 | 625 | 610 | 115.8 |
| B | 15 | 85 | 78432 | 672.15 | 625 | 610 | 115.8 |
| B | 4 | 232 | 34755 | 294.91 | 625 | 610 | 115.8 |
| C | 15 | 214 | 229240 | 1589.21 | 623 | 629 | 143.9 |
| C | 14 | 254 | 187271 | 1297.46 | 623 | 629 | 143.9 |
| C | 0 | 10 | 89668 | 618.96 | 623 | 629 | 143.9 |
| D | 12 | 227 | 1360713 | 9357.21 | 608 | 593 | 145.4 |
| D | 5 | 32 | 182534 | 1251.7 | 608 | 593 | 145.4 |
| D | 2 | 249 | 127875 | 875.66 | 608 | 593 | 145.4 |
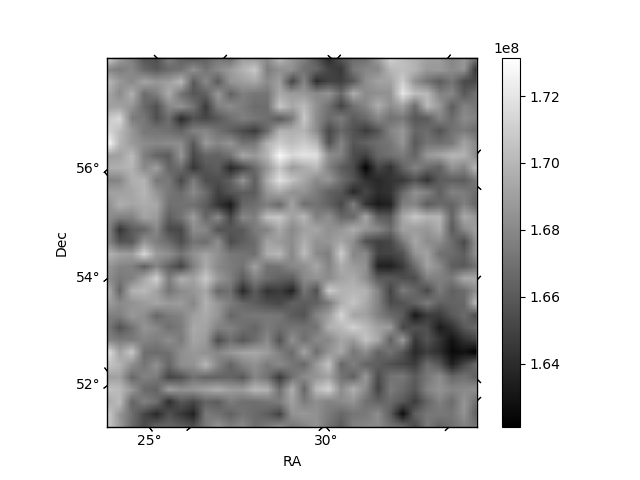
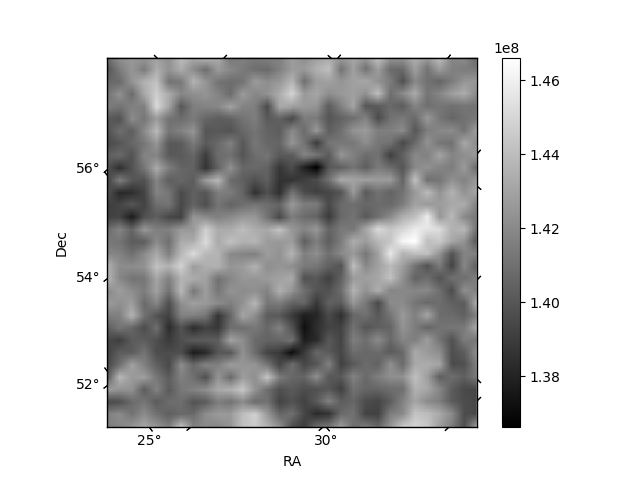
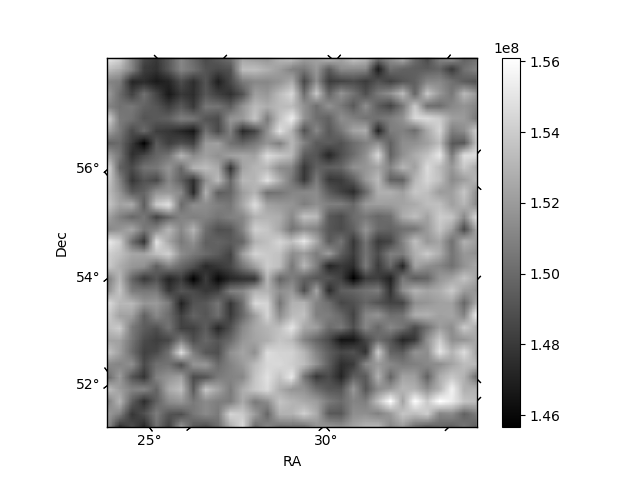
Histogram calculated using DETX and DETY for each event in the final _common_clean file
| Quadrant A | 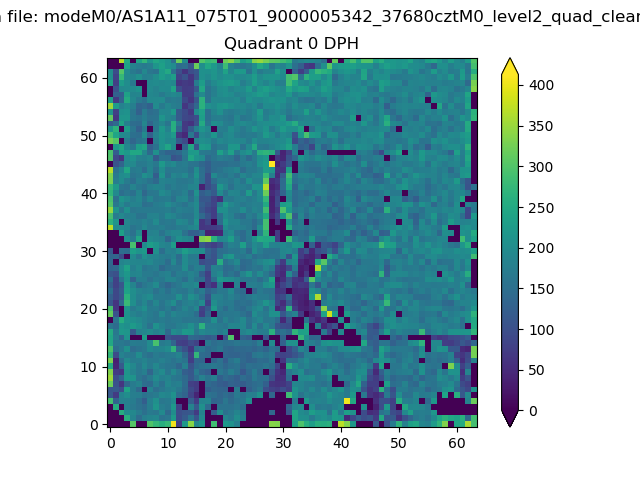 |
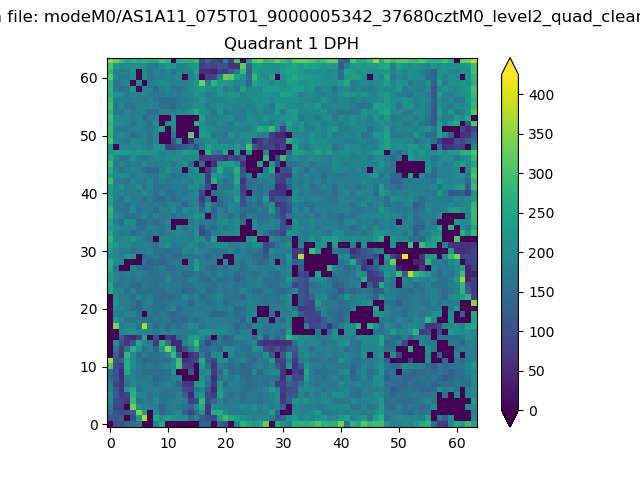 |
Quadrant B |
|---|---|---|---|
| Quadrant D | 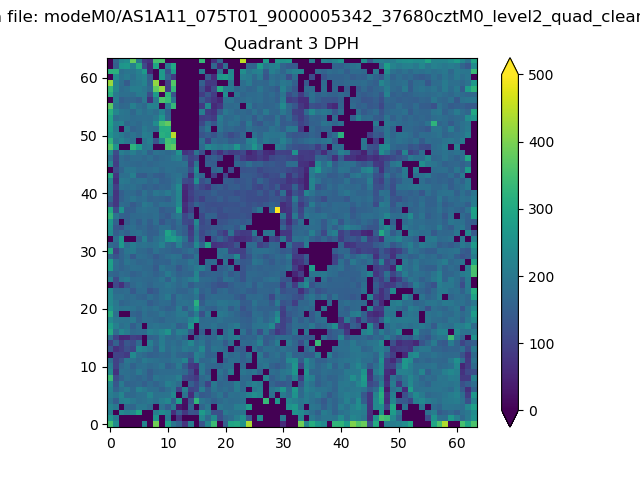 |
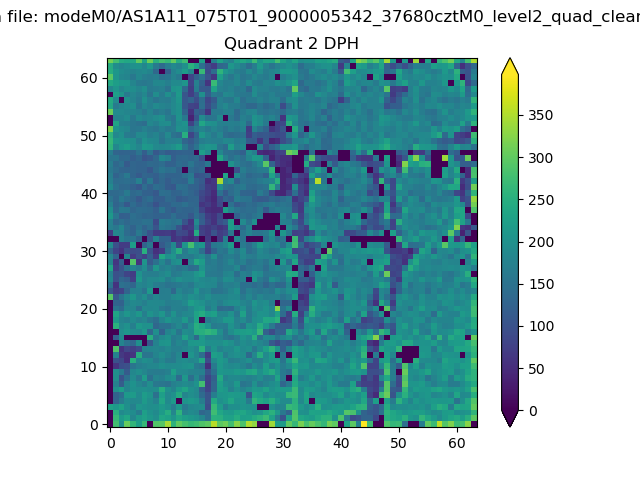 |
Quadrant C |
| Plot type | Count rate plots | Images |
|---|---|---|
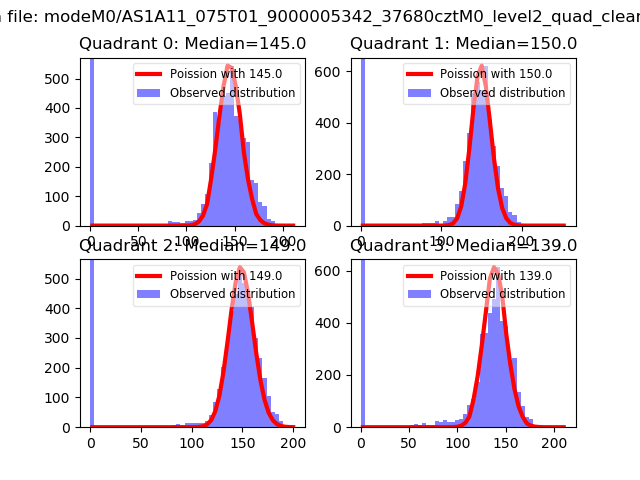
| Comparison with Poisson distribution Blue bars denote a histogram of data divided into 1 sec bins. Red curve is a Poisson curve with rate = median count rate of data. |
 |
 |
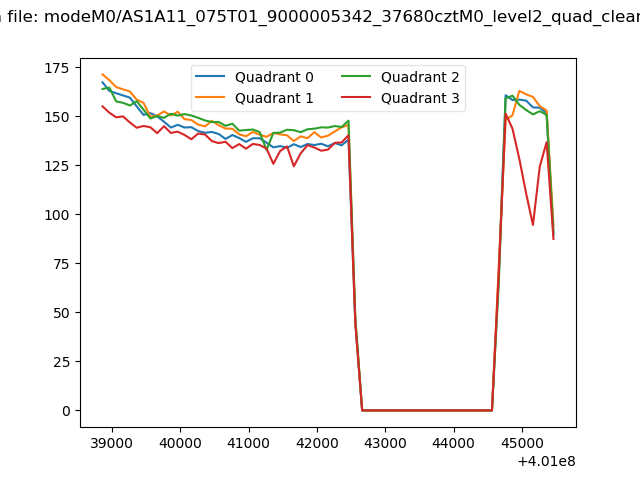
| Quadrant-wise count rates Data is divided into 100 sec bins |
 |
|
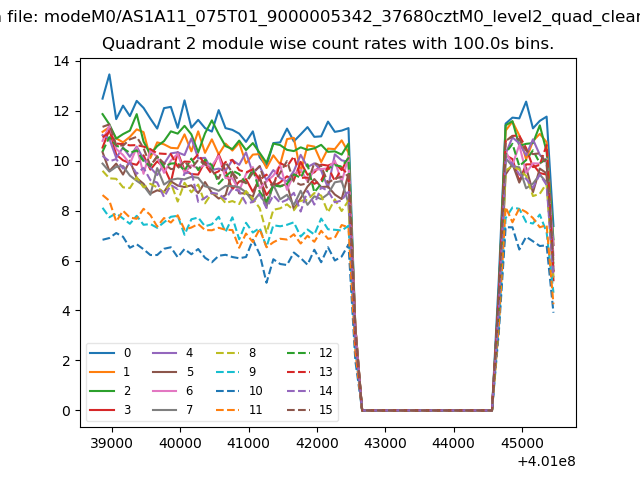
| Module-wise count rates for Quadrant A Data is divided into 100 sec bins |
 |
 |
| Module-wise count rates for Quadrant B Data is divided into 100 sec bins |
 |
 |
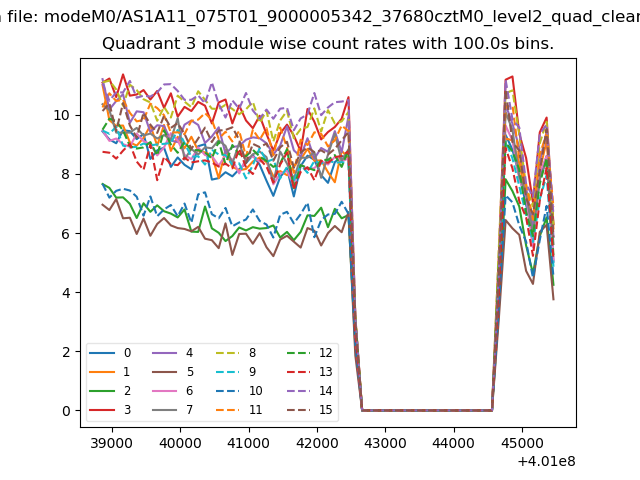
| Module-wise count rates for Quadrant C Data is divided into 100 sec bins |
 |
 |
| Module-wise count rates for Quadrant D Data is divided into 100 sec bins |
 |
 |
| Parameter | Plot |
|---|---|
| CZT HV Monitor | 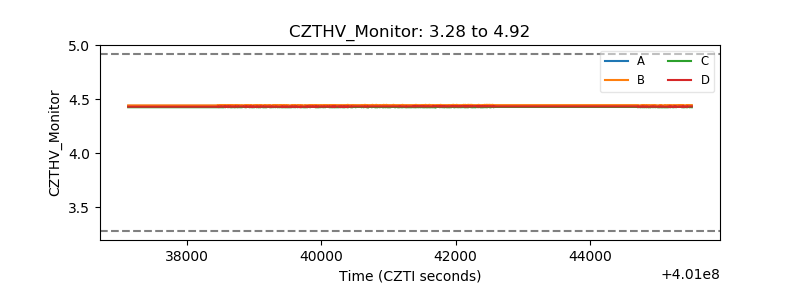 |
| D_VDD | 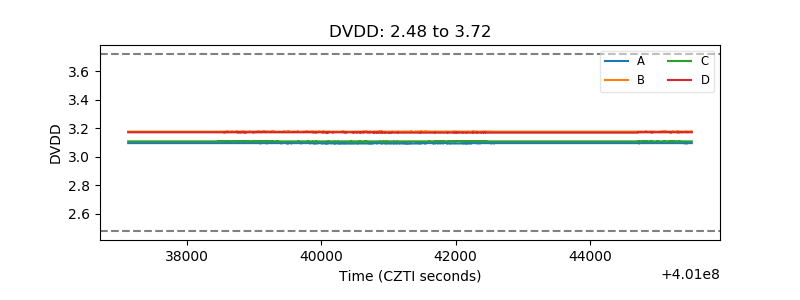 |
| Temperature 1 | 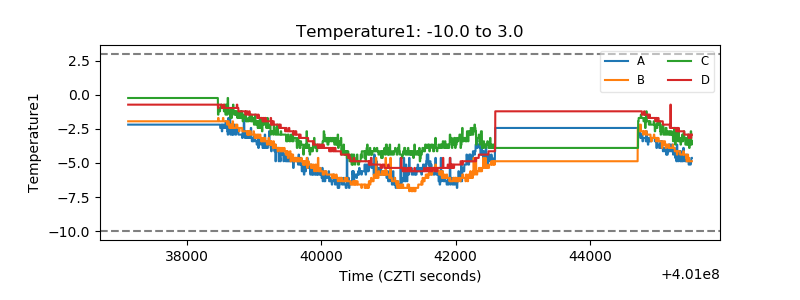 |
| Veto HV Monitor | 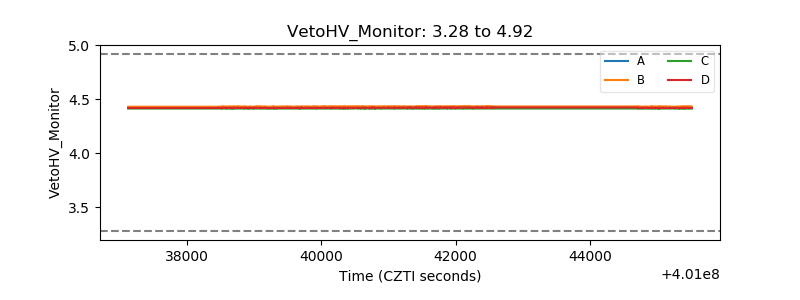 |
| Veto LLD | 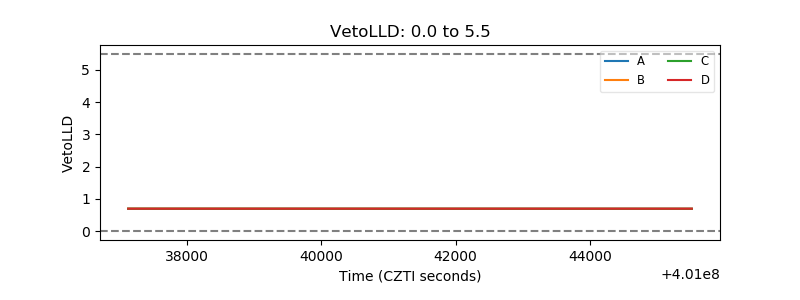 |
| Alpha Counter | 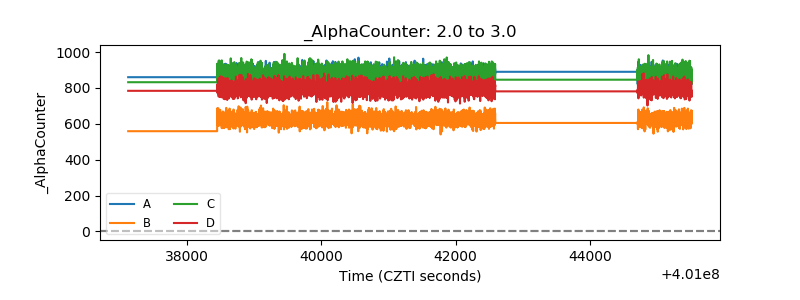 |
| _CPM_Rate | 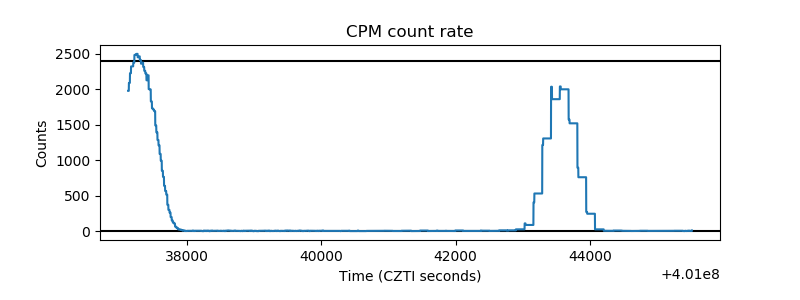 |
| CZT Counter | 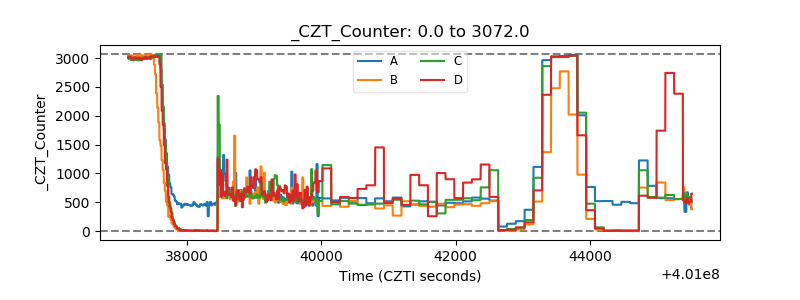 |
| +2.5 Volts monitor | 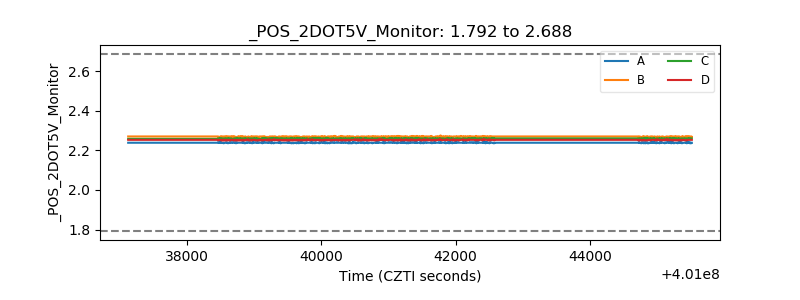 |
| +5 Volts monitor | 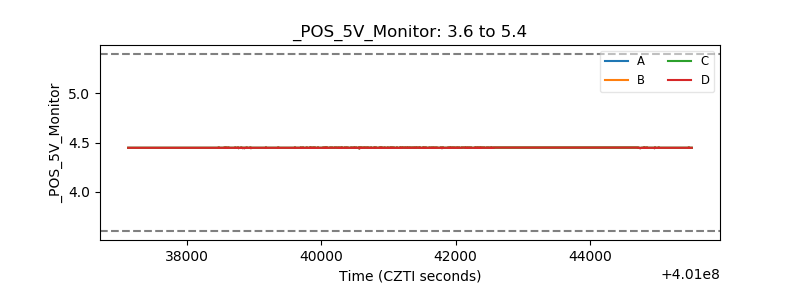 |
| _ROLL_ROT | 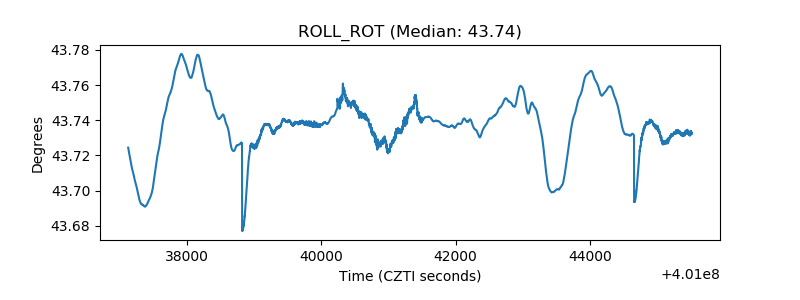 |
| _Roll_DEC | 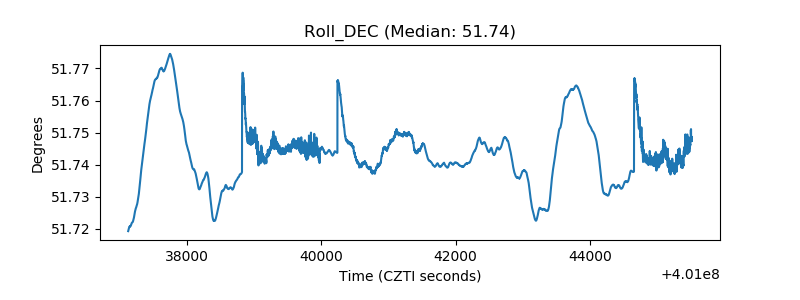 |
| _Roll_RA | 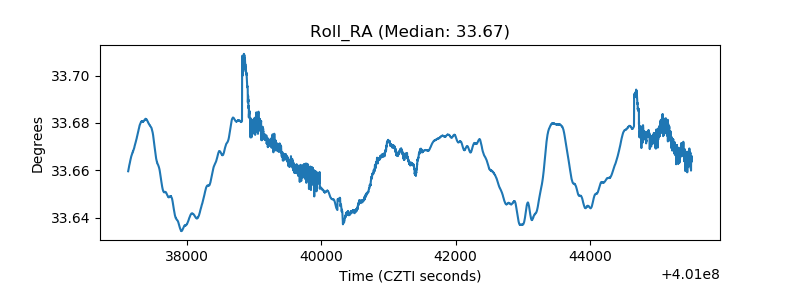 |
| Veto Counter | 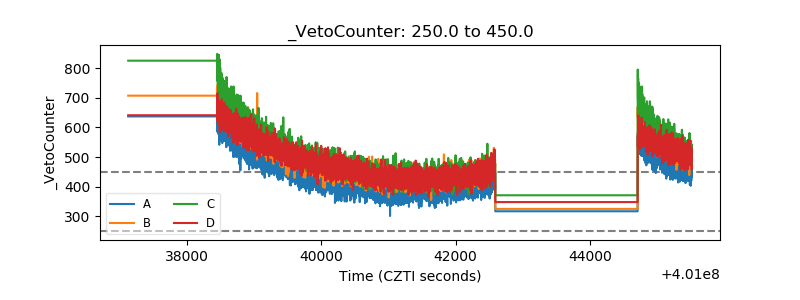 |