| Param | Original file | Final file |
|---|---|---|
| Filename | modeM0/AS1A11_075T01_9000005342_37681cztM0_level2.evt | modeM0/AS1A11_075T01_9000005342_37681cztM0_level2_quad_clean.evt |
| Size (bytes) | 483,655,680 | 95,921,280 |
| Size | 461.2 MB | 91.5 MB |
| Events in quadrant A | 2,698,183 | 646,176 |
| Events in quadrant B | 2,840,451 | 659,186 |
| Events in quadrant C | 2,681,002 | 668,780 |
| Events in quadrant D | 6,098,483 | 589,416 |
| Mode SS | |||
|---|---|---|---|
| Quadrant | BADHDUFLAG | Total packets | Discarded packets |
| A | 0 | 102 | 0 |
| B | 0 | 102 | 0 |
| C | 0 | 102 | 0 |
| D | 0 | 102 | 0 |
| Mode M0 | |||
|---|---|---|---|
| Quadrant | BADHDUFLAG | Total packets | Discarded packets |
| A | 0 | 11057 | 3 |
| B | 0 | 11421 | 2 |
| C | 0 | 10769 | 2 |
| D | 0 | 21466 | 2 |
| Mode M9 | |||
|---|---|---|---|
| Quadrant | BADHDUFLAG | Total packets | Discarded packets |
| A | 0 | 42 | 0 |
| B | 0 | 42 | 0 |
| C | 0 | 42 | 0 |
| D | 0 | 42 | 0 |
| Quadrant | Total seconds | Saturated seconds | Saturation percentage |
|---|---|---|---|
| A | 4859 | 30 | 0.617411% |
| B | 4859 | 102 | 2.099197% |
| C | 4859 | 47 | 0.967277% |
| D | 4859 | 771 | 15.867462% |
Noise dominated data is calculated using 1-second bins in cleaned event files. If a bin has >2000 counts, and if more than 50% of those come from <1% of pixels, then it is considered to be noise-dominated and hence unusable.
| Quadrant | # 1 sec bins | Bins with >0 counts | Bins with >2000 counts | High rate bins dominated by noise | Noise dominated (total time) | Noise dominated (detector-on time) | Marked lightcurve |
|---|---|---|---|---|---|---|---|
| A | 9134 | 4861 | 22 | 22 | 0.24% | 0.45% | 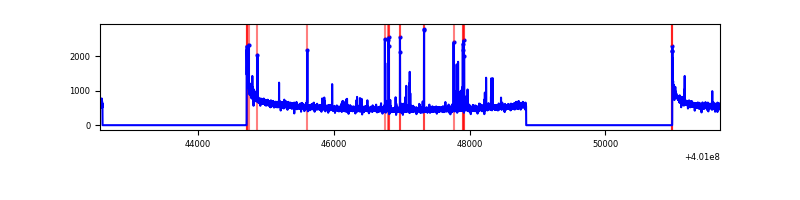 |
| B | 9134 | 4859 | 65 | 65 | 0.71% | 1.34% | 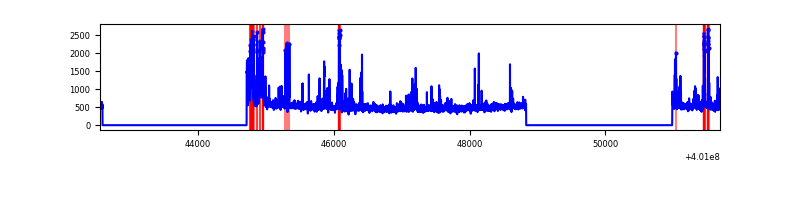 |
| C | 9134 | 4859 | 31 | 31 | 0.34% | 0.64% | 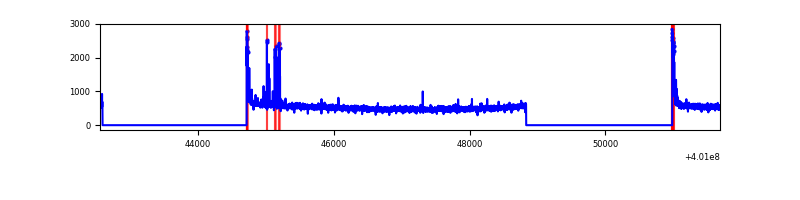 |
| D | 9134 | 4859 | 983 | 983 | 10.76% | 20.23% | 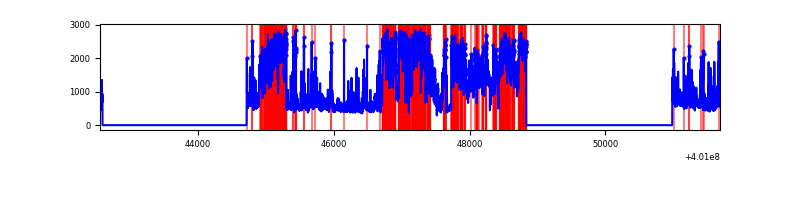 |
Top three noisy pixels from each quadrant. If the there are fewer than three noisy pixels in the level2.evt file, extra rows are filled as -1
| Pixel properties | Quadrant properties | ||||||
|---|---|---|---|---|---|---|---|
| Quadrant | DetID | PixID | Counts | Sigma | Mean | Median | Sigma |
| A | 10 | 83 | 305902 | 2626.21 | 581 | 570 | 116.3 |
| A | 9 | 143 | 99949 | 854.77 | 581 | 570 | 116.3 |
| A | 13 | 6 | 17790 | 148.11 | 581 | 570 | 116.3 |
| B | 5 | 172 | 208097 | 1881.02 | 583 | 569 | 110.3 |
| B | 5 | 255 | 109692 | 989.08 | 583 | 569 | 110.3 |
| B | 0 | 230 | 53193 | 476.98 | 583 | 569 | 110.3 |
| C | 15 | 214 | 225379 | 1678.39 | 586 | 594 | 133.9 |
| C | 0 | 10 | 109991 | 816.83 | 586 | 594 | 133.9 |
| C | 14 | 254 | 59243 | 437.91 | 586 | 594 | 133.9 |
| D | 12 | 227 | 3395900 | 25254.58 | 557 | 544 | 134.4 |
| D | 5 | 32 | 236577 | 1755.61 | 557 | 544 | 134.4 |
| D | 2 | 249 | 161248 | 1195.31 | 557 | 544 | 134.4 |
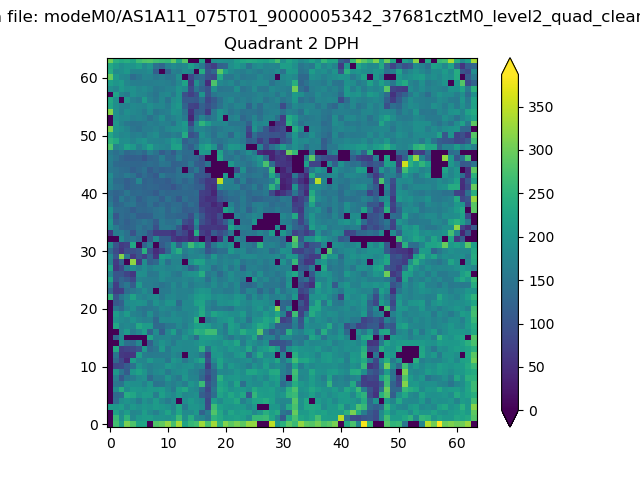
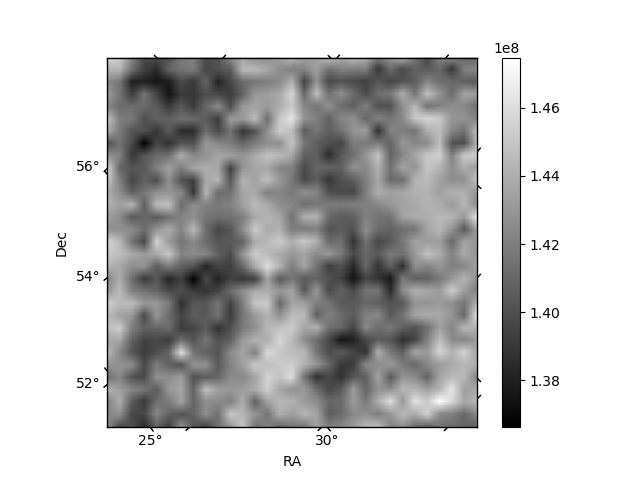
Histogram calculated using DETX and DETY for each event in the final _common_clean file
| Quadrant A | 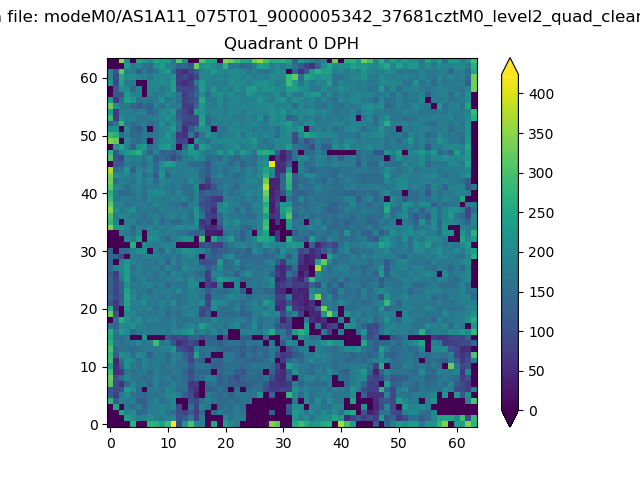 |
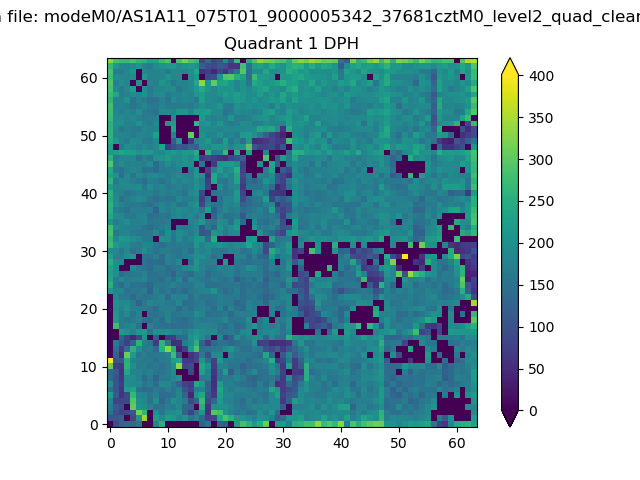 |
Quadrant B |
|---|---|---|---|
| Quadrant D | 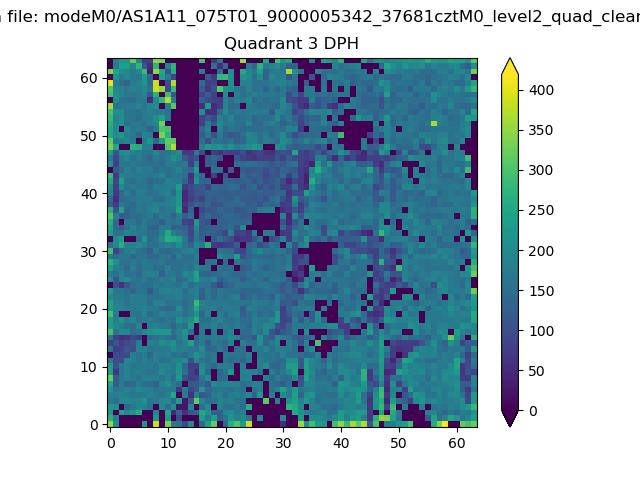 |
 |
Quadrant C |
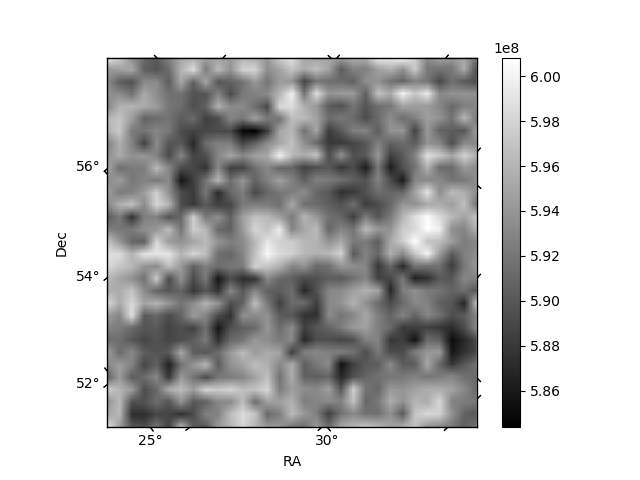
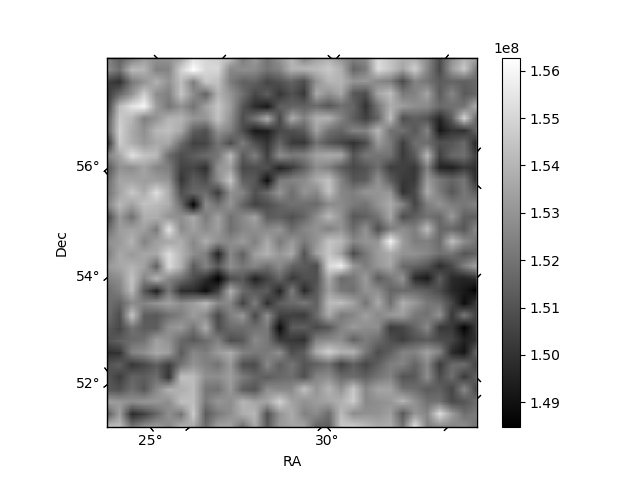
| Plot type | Count rate plots | Images |
|---|---|---|
| Comparison with Poisson distribution Blue bars denote a histogram of data divided into 1 sec bins. Red curve is a Poisson curve with rate = median count rate of data. |
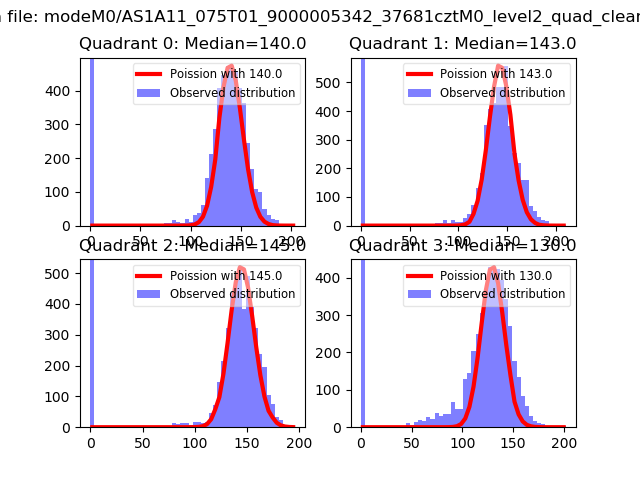 |
 |
| Quadrant-wise count rates Data is divided into 100 sec bins |
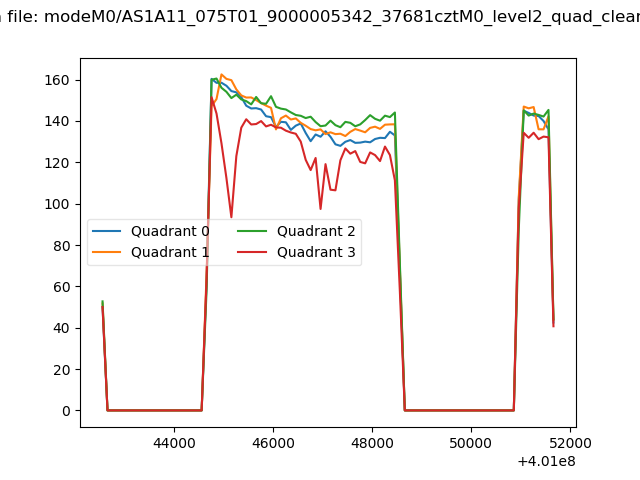 |
|
| Module-wise count rates for Quadrant A Data is divided into 100 sec bins |
 |
 |
| Module-wise count rates for Quadrant B Data is divided into 100 sec bins |
 |
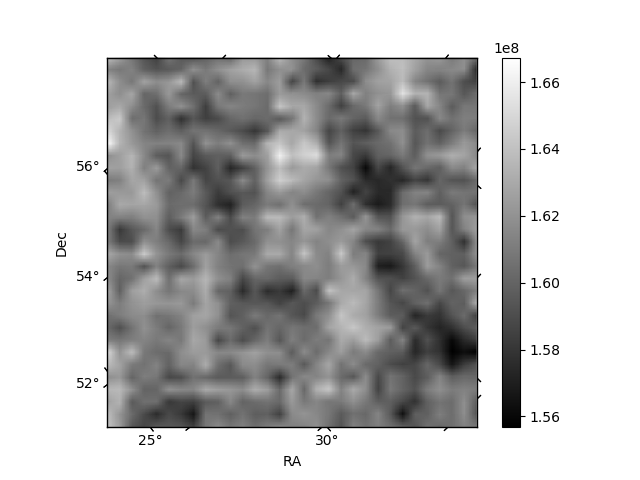 |
| Module-wise count rates for Quadrant C Data is divided into 100 sec bins |
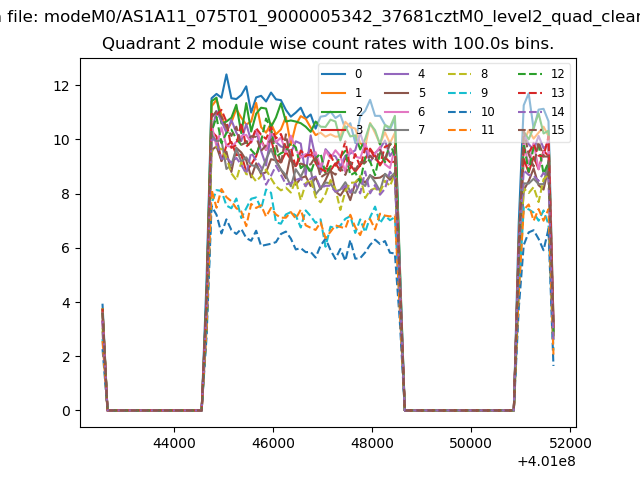 |
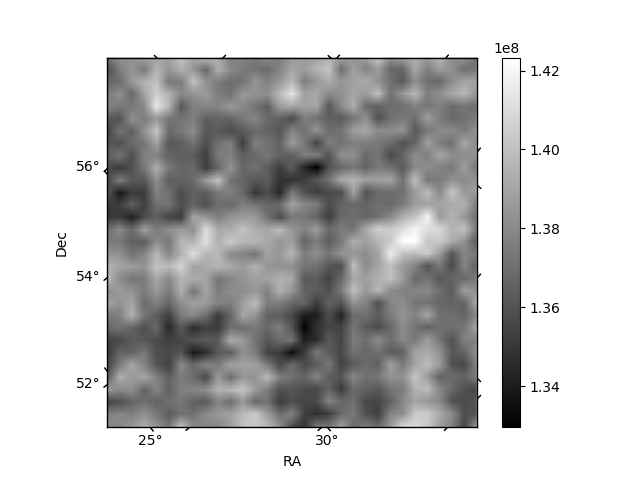 |
| Module-wise count rates for Quadrant D Data is divided into 100 sec bins |
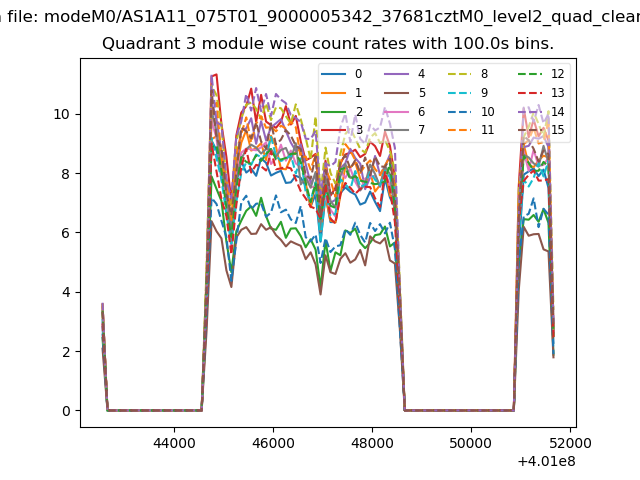 |
 |
| Parameter | Plot |
|---|---|
| CZT HV Monitor | 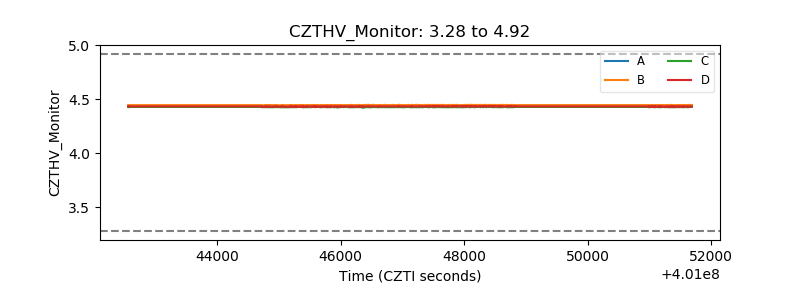 |
| D_VDD | 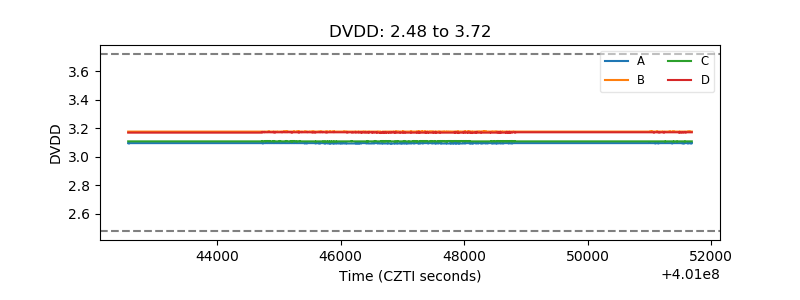 |
| Temperature 1 | 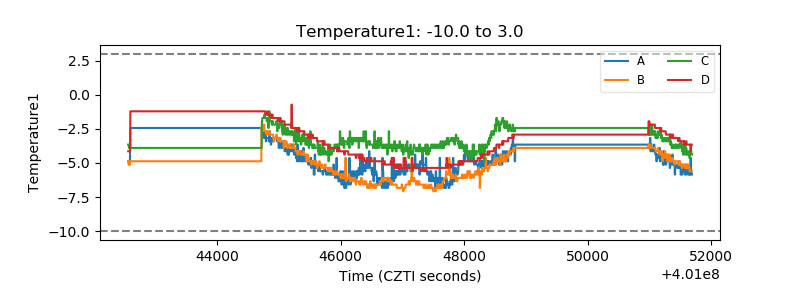 |
| Veto HV Monitor | 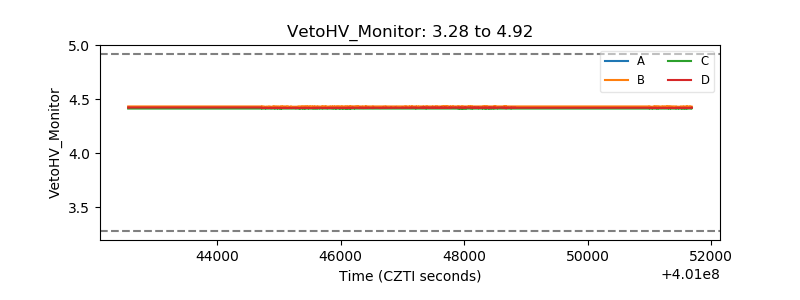 |
| Veto LLD | 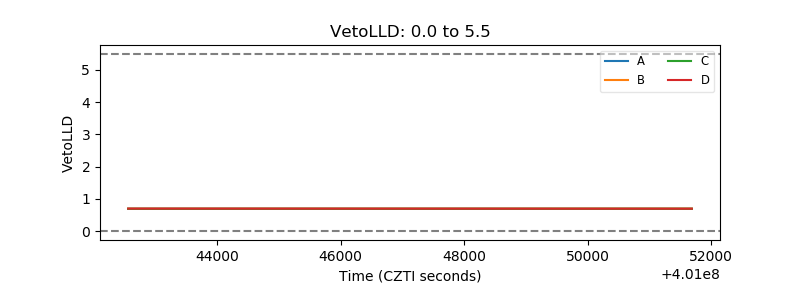 |
| Alpha Counter | 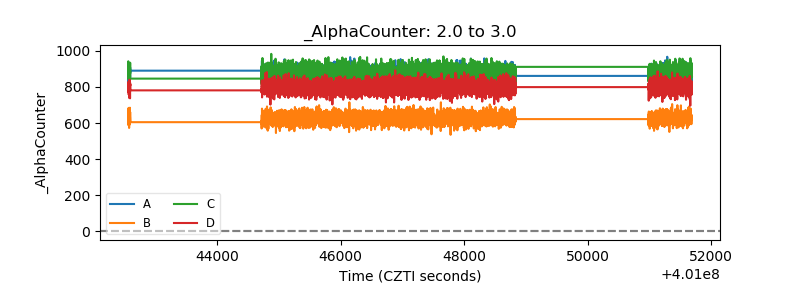 |
| _CPM_Rate | 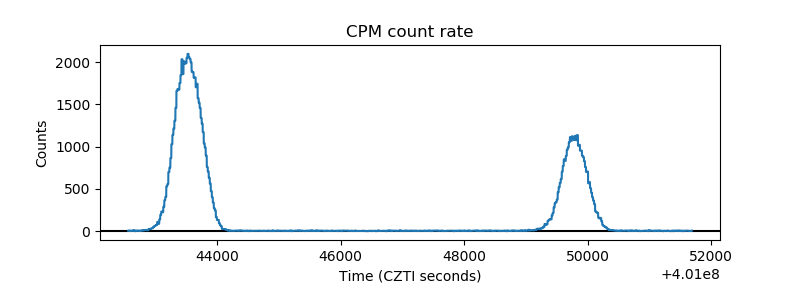 |
| CZT Counter | 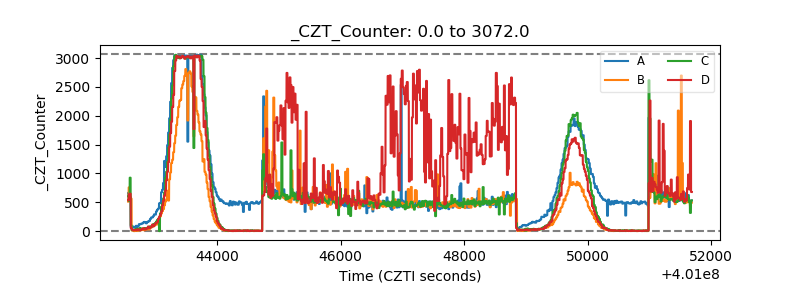 |
| +2.5 Volts monitor | 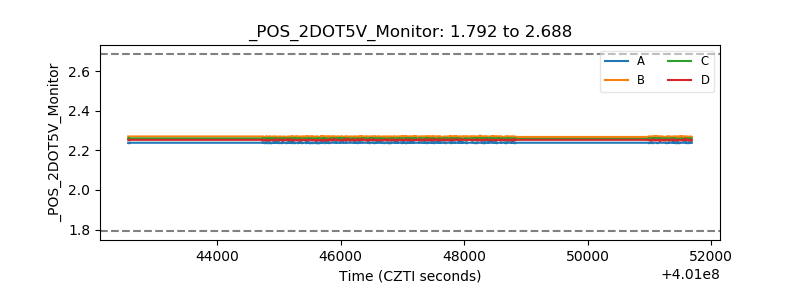 |
| +5 Volts monitor | 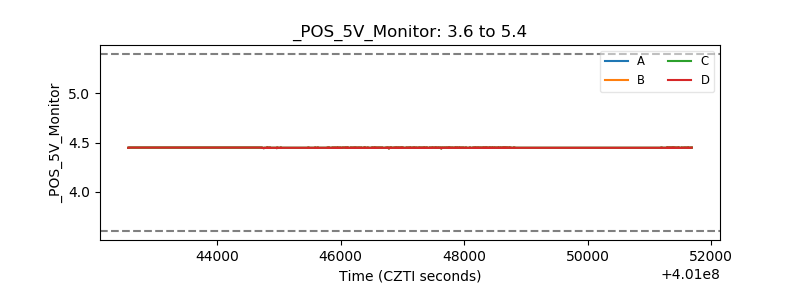 |
| _ROLL_ROT | 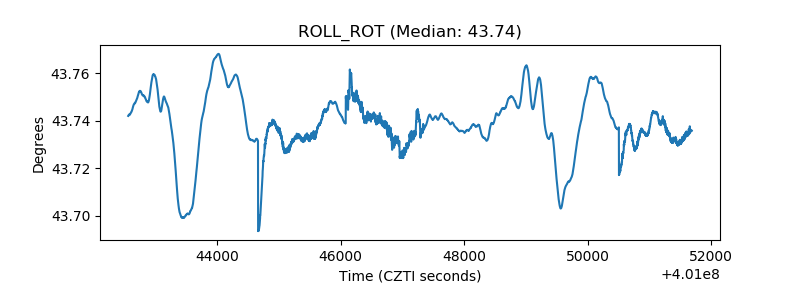 |
| _Roll_DEC | 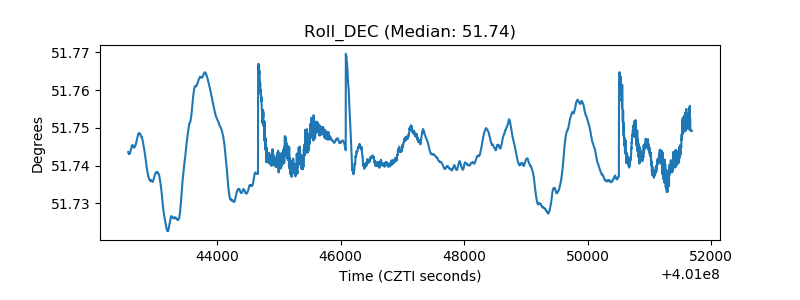 |
| _Roll_RA | 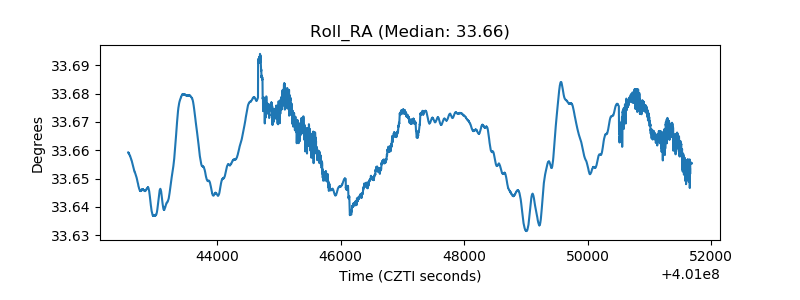 |
| Veto Counter | 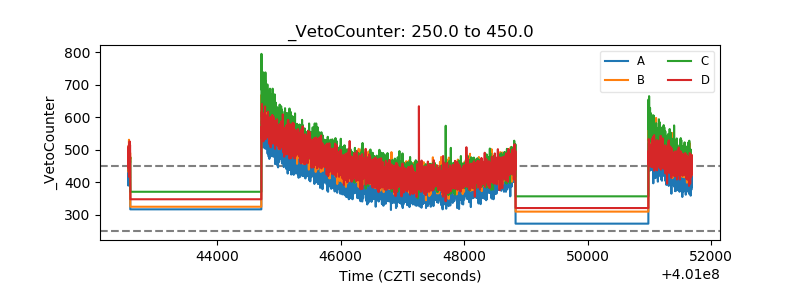 |