| Param | Original file | Final file |
|---|---|---|
| Filename | modeM0/AS1A11_075T01_9000005342_37682cztM0_level2.evt | modeM0/AS1A11_075T01_9000005342_37682cztM0_level2_quad_clean.evt |
| Size (bytes) | 412,781,760 | 84,110,400 |
| Size | 393.7 MB | 80.2 MB |
| Events in quadrant A | 2,597,841 | 548,089 |
| Events in quadrant B | 2,863,499 | 560,128 |
| Events in quadrant C | 2,582,408 | 570,945 |
| Events in quadrant D | 4,119,386 | 518,986 |
| Mode SS | |||
|---|---|---|---|
| Quadrant | BADHDUFLAG | Total packets | Discarded packets |
| A | 0 | 102 | 0 |
| B | 0 | 102 | 0 |
| C | 0 | 102 | 0 |
| D | 0 | 102 | 0 |
| Mode M0 | |||
|---|---|---|---|
| Quadrant | BADHDUFLAG | Total packets | Discarded packets |
| A | 0 | 10916 | 3 |
| B | 0 | 11733 | 2 |
| C | 0 | 10552 | 2 |
| D | 0 | 15692 | 2 |
| Mode M9 | |||
|---|---|---|---|
| Quadrant | BADHDUFLAG | Total packets | Discarded packets |
| A | 0 | 34 | 0 |
| B | 0 | 34 | 0 |
| C | 0 | 34 | 0 |
| D | 0 | 35 | 0 |
| Quadrant | Total seconds | Saturated seconds | Saturation percentage |
|---|---|---|---|
| A | 4971 | 31 | 0.623617% |
| B | 4971 | 121 | 2.434118% |
| C | 4971 | 43 | 0.865017% |
| D | 4971 | 422 | 8.489238% |
Noise dominated data is calculated using 1-second bins in cleaned event files. If a bin has >2000 counts, and if more than 50% of those come from <1% of pixels, then it is considered to be noise-dominated and hence unusable.
| Quadrant | # 1 sec bins | Bins with >0 counts | Bins with >2000 counts | High rate bins dominated by noise | Noise dominated (total time) | Noise dominated (detector-on time) | Marked lightcurve |
|---|---|---|---|---|---|---|---|
| A | 7034 | 4972 | 24 | 24 | 0.34% | 0.48% | 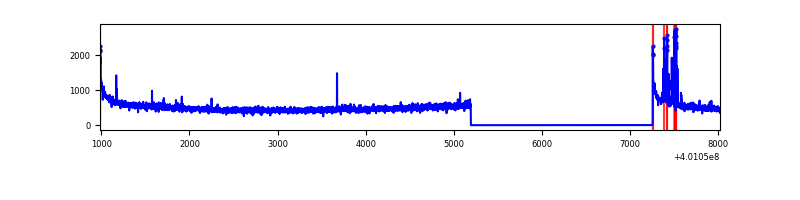 |
| B | 7033 | 4970 | 111 | 111 | 1.58% | 2.23% | 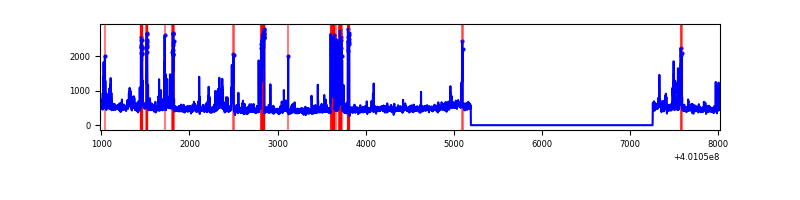 |
| C | 7033 | 4970 | 33 | 33 | 0.47% | 0.66% | 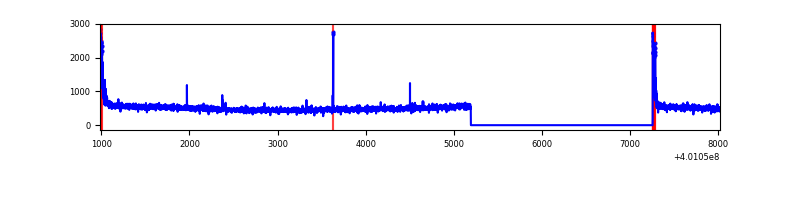 |
| D | 7033 | 4971 | 438 | 438 | 6.23% | 8.81% | 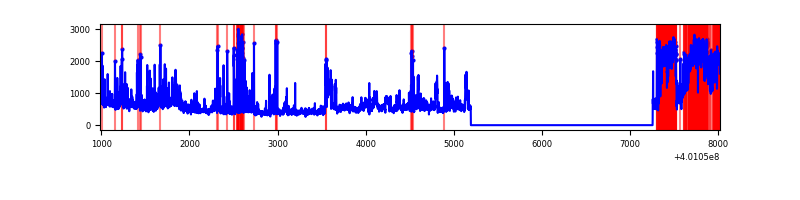 |
Top three noisy pixels from each quadrant. If the there are fewer than three noisy pixels in the level2.evt file, extra rows are filled as -1
| Pixel properties | Quadrant properties | ||||||
|---|---|---|---|---|---|---|---|
| Quadrant | DetID | PixID | Counts | Sigma | Mean | Median | Sigma |
| A | 10 | 83 | 296224 | 2618.24 | 564 | 553 | 112.9 |
| A | 13 | 248 | 79682 | 700.71 | 564 | 553 | 112.9 |
| A | 9 | 143 | 11871 | 100.22 | 564 | 553 | 112.9 |
| B | 5 | 255 | 175965 | 1627.72 | 565 | 550 | 107.8 |
| B | 10 | 246 | 167934 | 1553.2 | 565 | 550 | 107.8 |
| B | 5 | 172 | 147517 | 1363.74 | 565 | 550 | 107.8 |
| C | 15 | 214 | 229377 | 1754.87 | 566 | 572 | 130.4 |
| C | 0 | 10 | 122550 | 935.54 | 566 | 572 | 130.4 |
| C | 14 | 254 | 15087 | 111.33 | 566 | 572 | 130.4 |
| D | 12 | 227 | 1321908 | 9795.8 | 549 | 535 | 134.9 |
| D | 5 | 32 | 282441 | 2089.87 | 549 | 535 | 134.9 |
| D | 2 | 249 | 108481 | 800.24 | 549 | 535 | 134.9 |
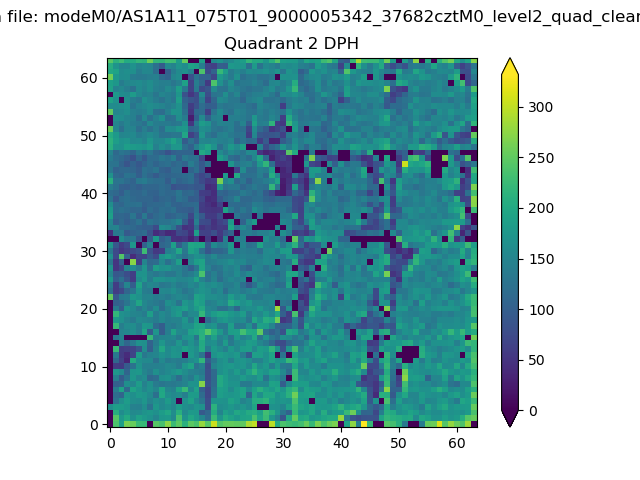
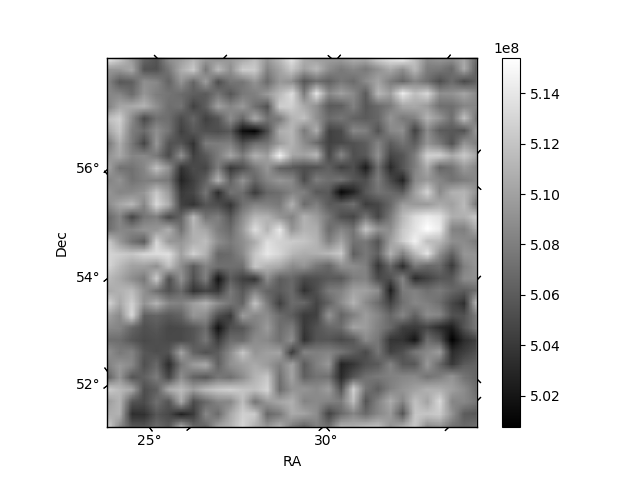
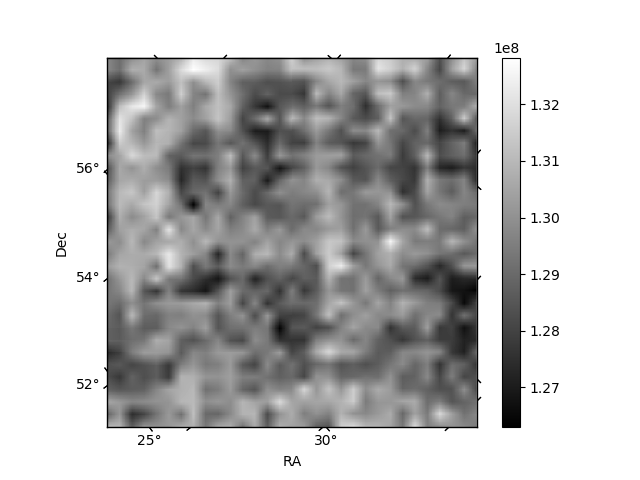
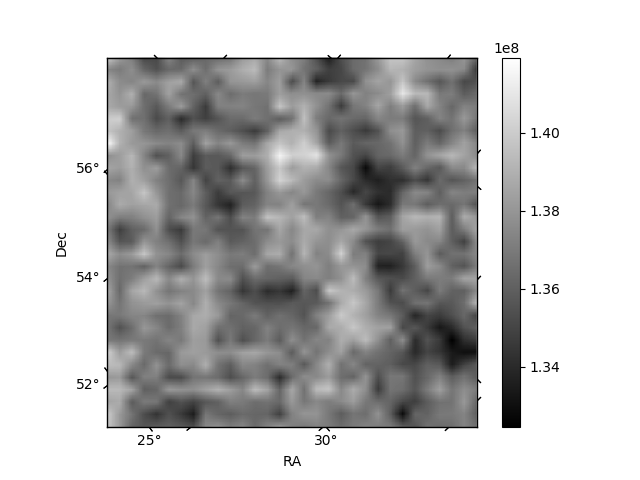
Histogram calculated using DETX and DETY for each event in the final _common_clean file
| Quadrant A | 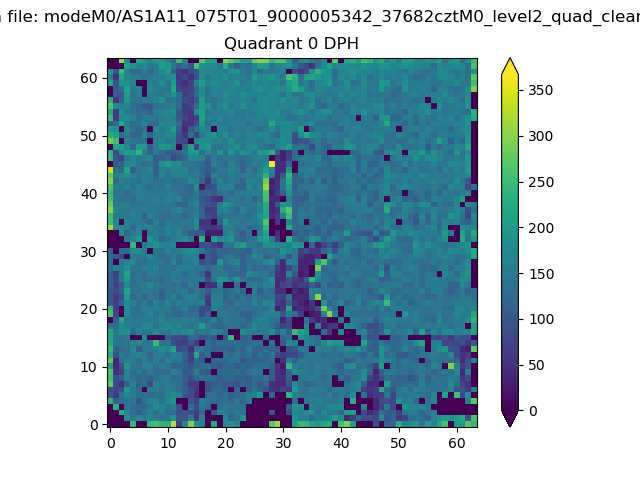 |
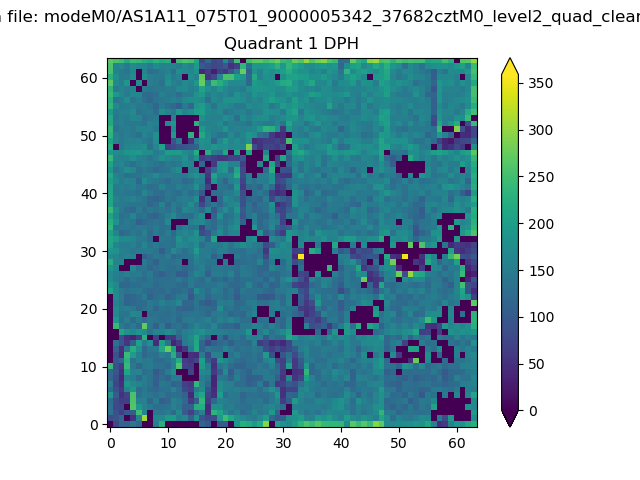 |
Quadrant B |
|---|---|---|---|
| Quadrant D | 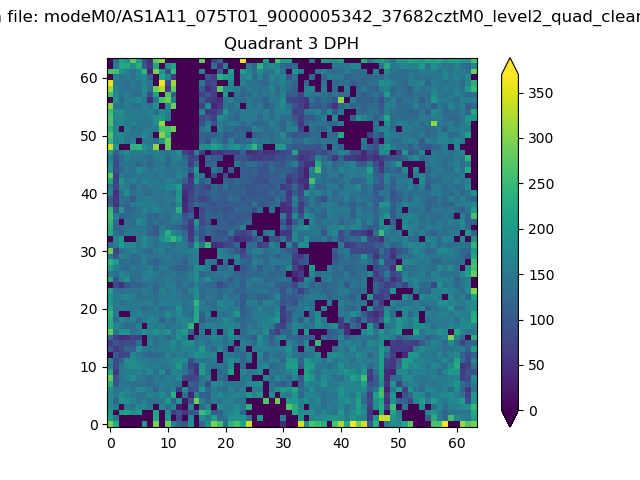 |
 |
Quadrant C |
| Plot type | Count rate plots | Images |
|---|---|---|
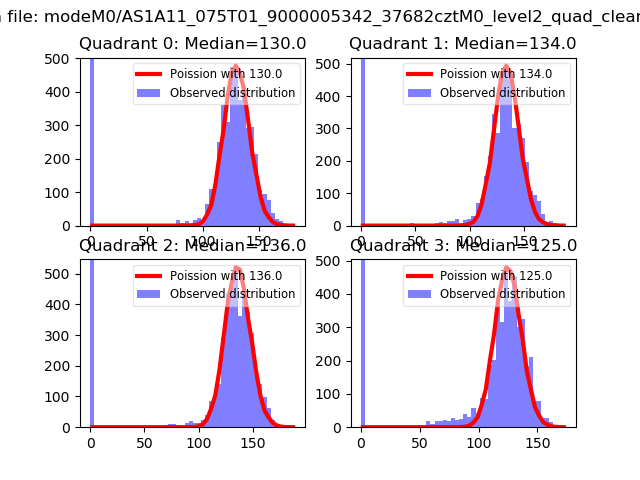
| Comparison with Poisson distribution Blue bars denote a histogram of data divided into 1 sec bins. Red curve is a Poisson curve with rate = median count rate of data. |
 |
 |
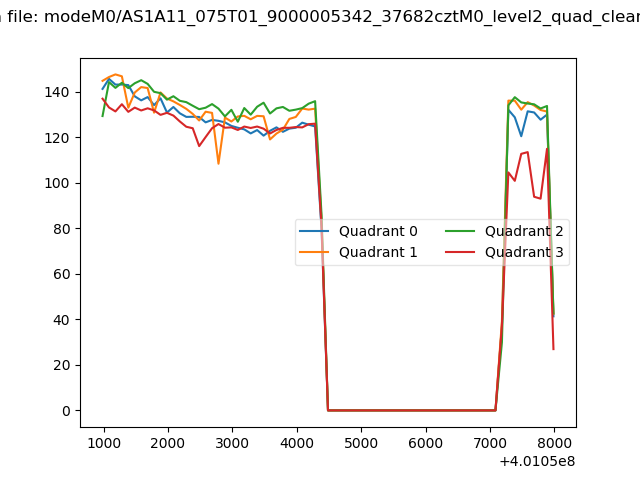
| Quadrant-wise count rates Data is divided into 100 sec bins |
 |
|
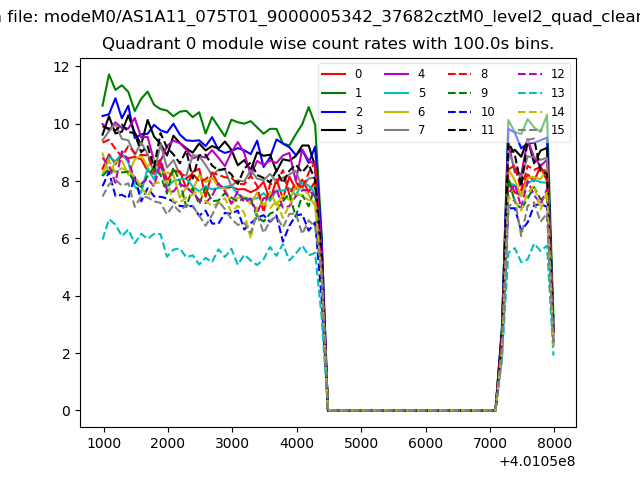
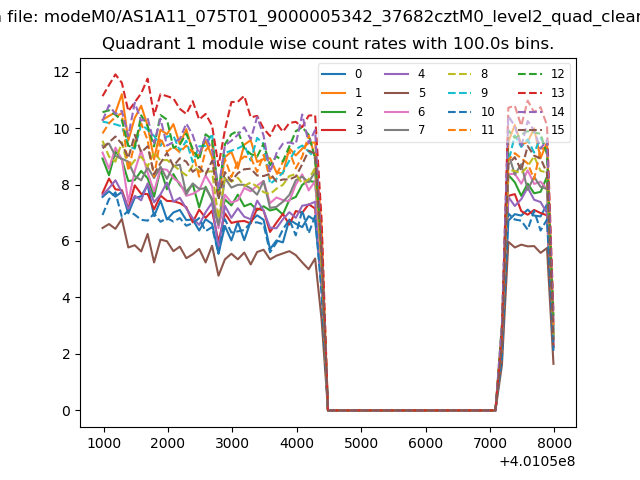
| Module-wise count rates for Quadrant A Data is divided into 100 sec bins |
 |
 |
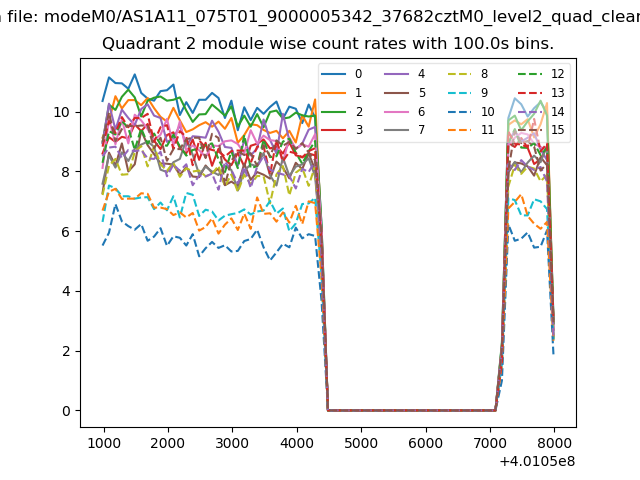
| Module-wise count rates for Quadrant B Data is divided into 100 sec bins |
 |
 |
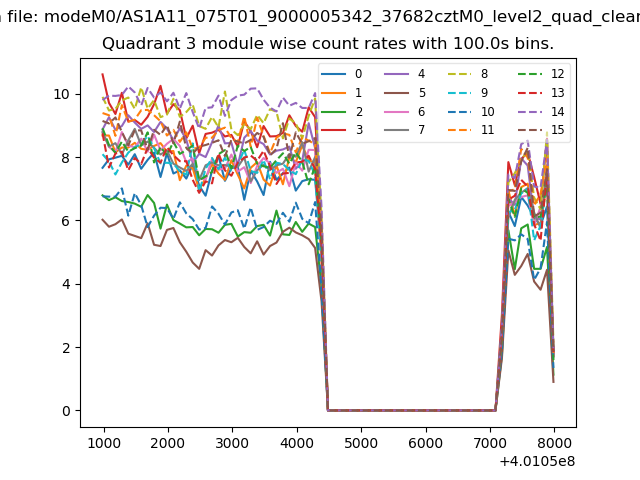
| Module-wise count rates for Quadrant C Data is divided into 100 sec bins |
 |
 |
| Module-wise count rates for Quadrant D Data is divided into 100 sec bins |
 |
 |
| Parameter | Plot |
|---|---|
| CZT HV Monitor | 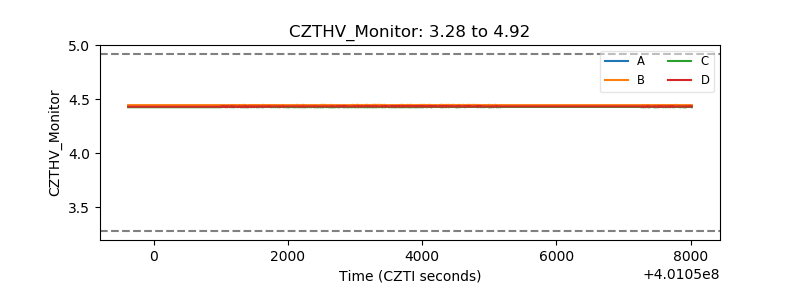 |
| D_VDD | 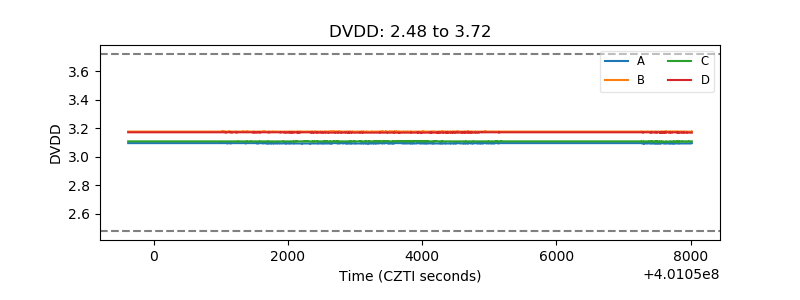 |
| Temperature 1 | 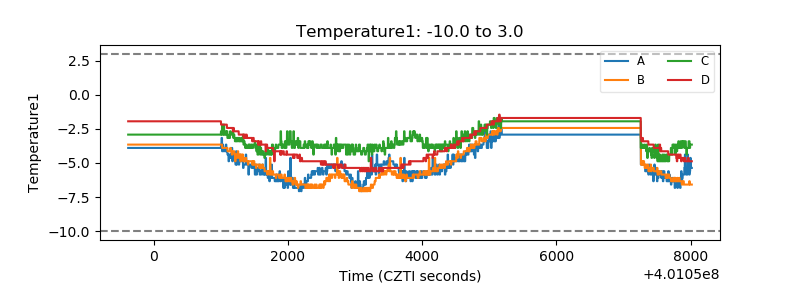 |
| Veto HV Monitor | 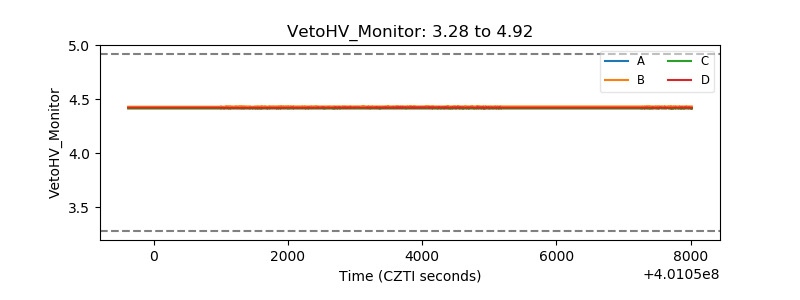 |
| Veto LLD | 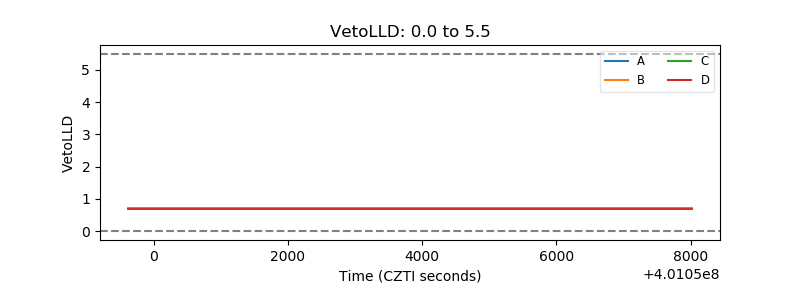 |
| Alpha Counter | 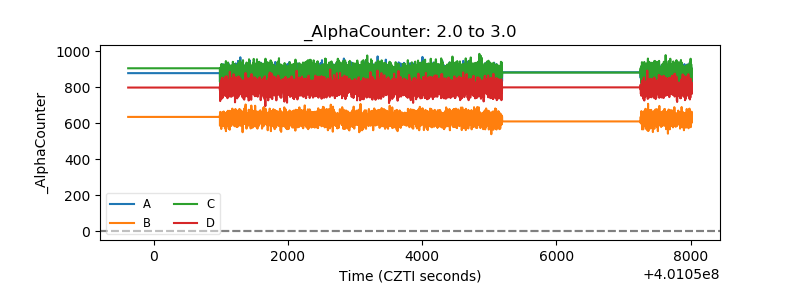 |
| _CPM_Rate | 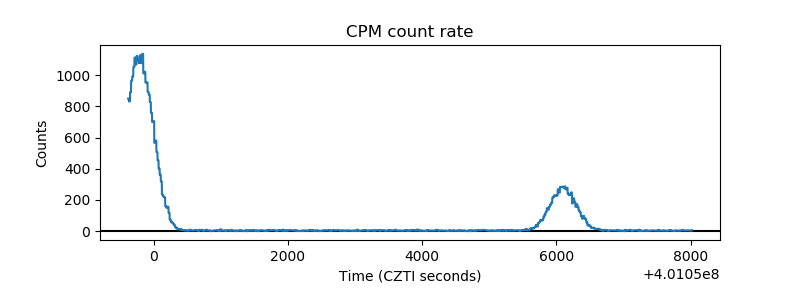 |
| CZT Counter | 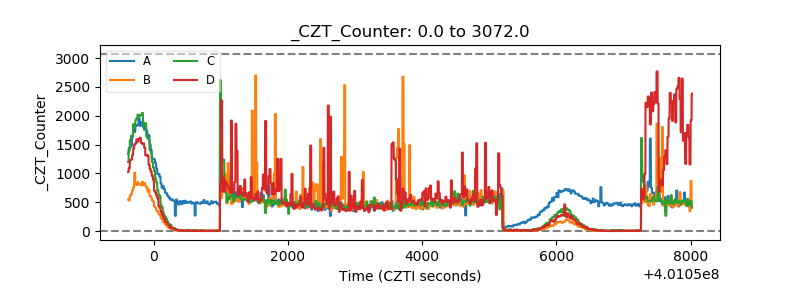 |
| +2.5 Volts monitor | 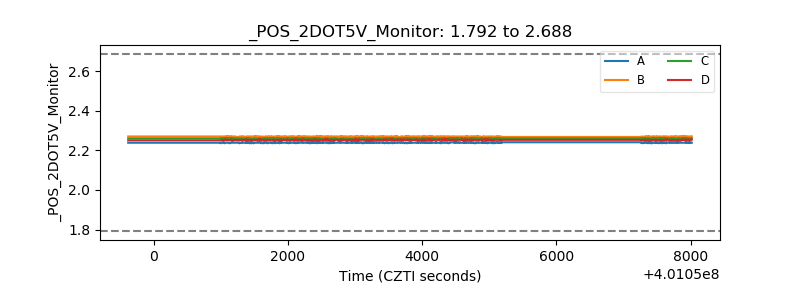 |
| +5 Volts monitor |  |
| _ROLL_ROT | 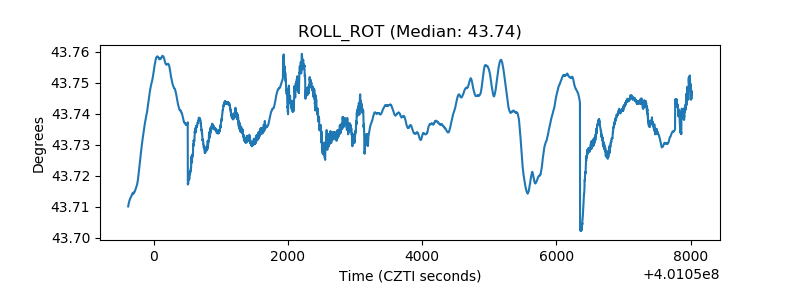 |
| _Roll_DEC | 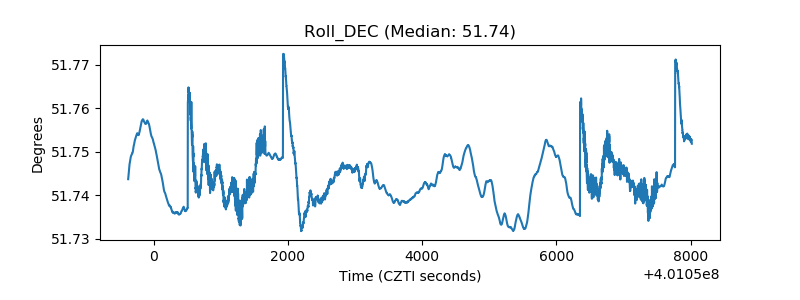 |
| _Roll_RA | 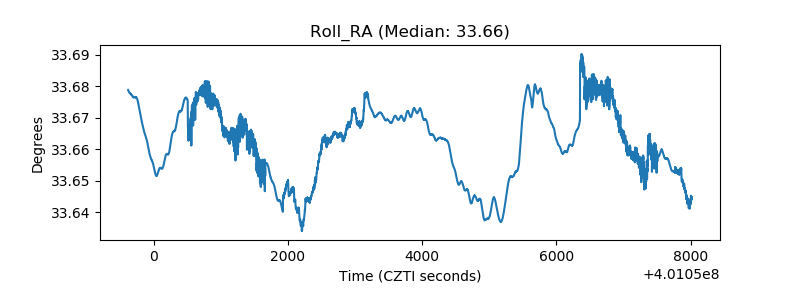 |
| Veto Counter | 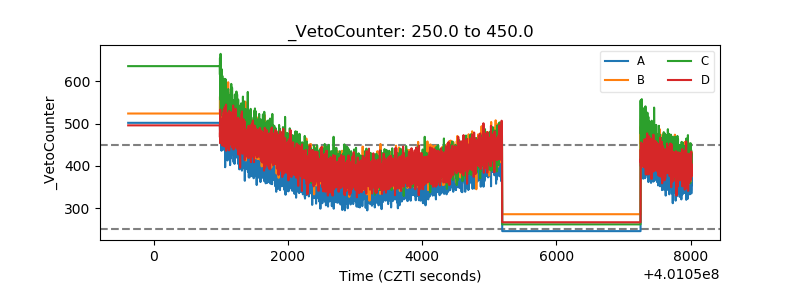 |