| Param | Original file | Final file |
|---|---|---|
| Filename | modeM0/AS1A11_075T01_9000005342_37683cztM0_level2.evt | modeM0/AS1A11_075T01_9000005342_37683cztM0_level2_quad_clean.evt |
| Size (bytes) | 434,931,840 | 73,393,920 |
| Size | 414.8 MB | 70.0 MB |
| Events in quadrant A | 2,929,008 | 456,668 |
| Events in quadrant B | 2,756,531 | 472,521 |
| Events in quadrant C | 2,722,994 | 478,792 |
| Events in quadrant D | 4,389,863 | 429,606 |
| Mode SS | |||
|---|---|---|---|
| Quadrant | BADHDUFLAG | Total packets | Discarded packets |
| A | 0 | 112 | 0 |
| B | 0 | 112 | 0 |
| C | 0 | 112 | 0 |
| D | 0 | 112 | 0 |
| Mode M0 | |||
|---|---|---|---|
| Quadrant | BADHDUFLAG | Total packets | Discarded packets |
| A | 0 | 12193 | 3 |
| B | 0 | 11864 | 2 |
| C | 0 | 11392 | 2 |
| D | 0 | 16988 | 2 |
| Mode M9 | |||
|---|---|---|---|
| Quadrant | BADHDUFLAG | Total packets | Discarded packets |
| A | 0 | 40 | 0 |
| B | 0 | 40 | 0 |
| C | 0 | 40 | 0 |
| D | 0 | 40 | 0 |
| Quadrant | Total seconds | Saturated seconds | Saturation percentage |
|---|---|---|---|
| A | 5502 | 28 | 0.508906% |
| B | 5502 | 45 | 0.817884% |
| C | 5502 | 25 | 0.454380% |
| D | 5502 | 494 | 8.978553% |
Noise dominated data is calculated using 1-second bins in cleaned event files. If a bin has >2000 counts, and if more than 50% of those come from <1% of pixels, then it is considered to be noise-dominated and hence unusable.
| Quadrant | # 1 sec bins | Bins with >0 counts | Bins with >2000 counts | High rate bins dominated by noise | Noise dominated (total time) | Noise dominated (detector-on time) | Marked lightcurve |
|---|---|---|---|---|---|---|---|
| A | 9388 | 5503 | 24 | 24 | 0.26% | 0.44% | 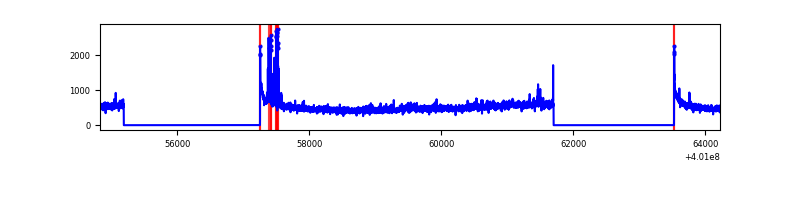 |
| B | 9389 | 5502 | 26 | 26 | 0.28% | 0.47% |  |
| C | 9389 | 5502 | 18 | 18 | 0.19% | 0.33% | 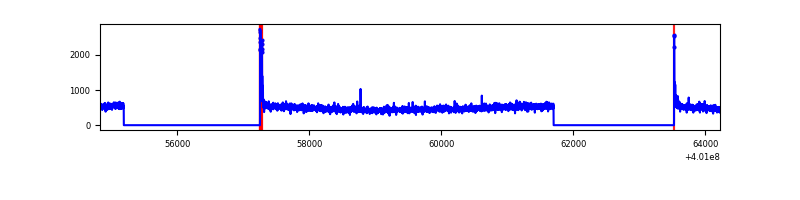 |
| D | 9389 | 5503 | 496 | 496 | 5.28% | 9.01% | 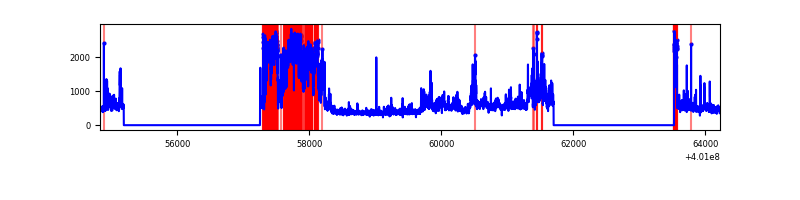 |
Top three noisy pixels from each quadrant. If the there are fewer than three noisy pixels in the level2.evt file, extra rows are filled as -1
| Pixel properties | Quadrant properties | ||||||
|---|---|---|---|---|---|---|---|
| Quadrant | DetID | PixID | Counts | Sigma | Mean | Median | Sigma |
| A | 10 | 83 | 306899 | 2457.69 | 615 | 603 | 124.6 |
| A | 15 | 222 | 135898 | 1085.6 | 615 | 603 | 124.6 |
| A | 13 | 248 | 80303 | 639.51 | 615 | 603 | 124.6 |
| B | 5 | 200 | 89489 | 747.53 | 618 | 600 | 118.9 |
| B | 5 | 172 | 64928 | 540.98 | 618 | 600 | 118.9 |
| B | 5 | 255 | 38450 | 318.31 | 618 | 600 | 118.9 |
| C | 15 | 214 | 252661 | 1778.22 | 611 | 617 | 141.7 |
| C | 0 | 10 | 71002 | 496.58 | 611 | 617 | 141.7 |
| C | 14 | 254 | 9262 | 60.99 | 611 | 617 | 141.7 |
| D | 12 | 227 | 1586325 | 11013.99 | 591 | 575 | 144.0 |
| D | 5 | 32 | 261531 | 1812.5 | 591 | 575 | 144.0 |
| D | 2 | 153 | 146129 | 1010.96 | 591 | 575 | 144.0 |
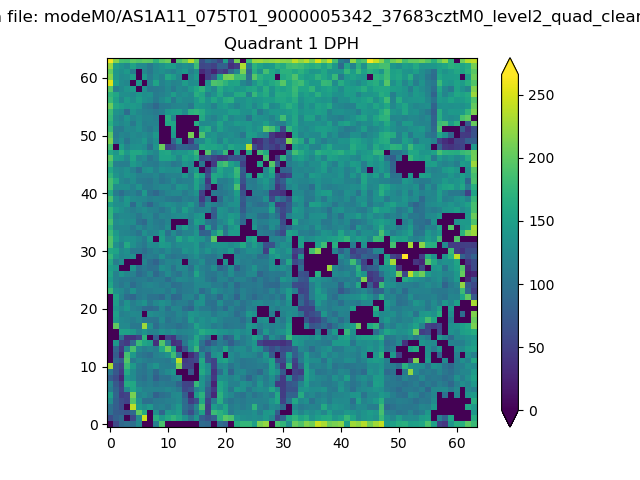
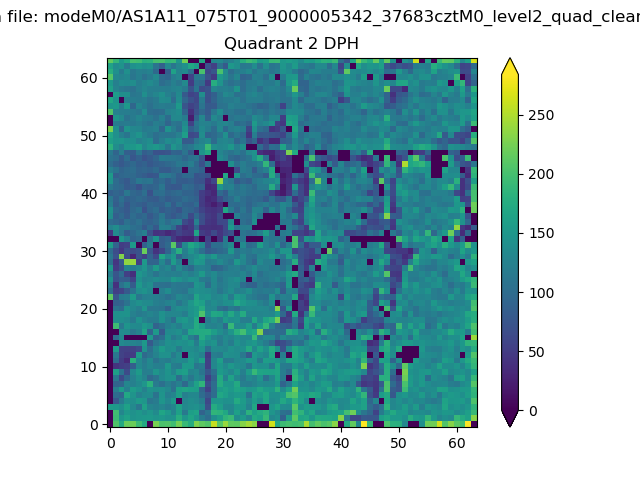
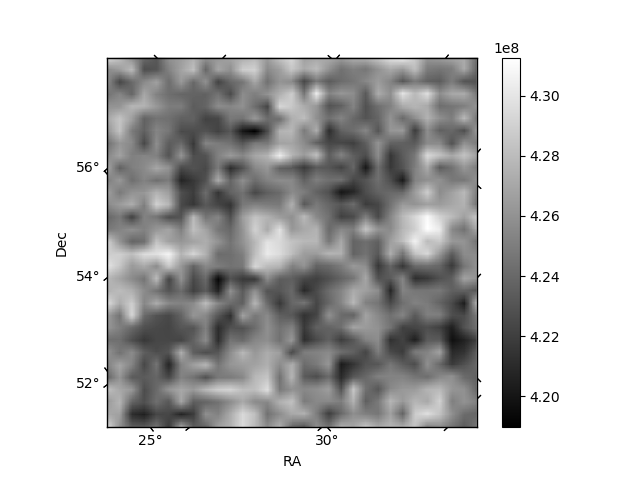
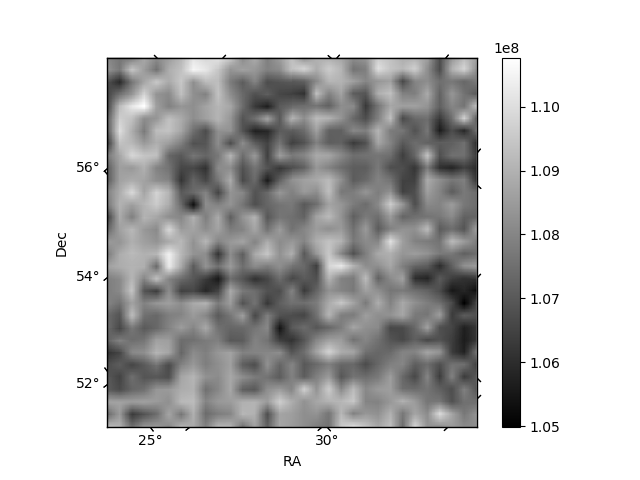
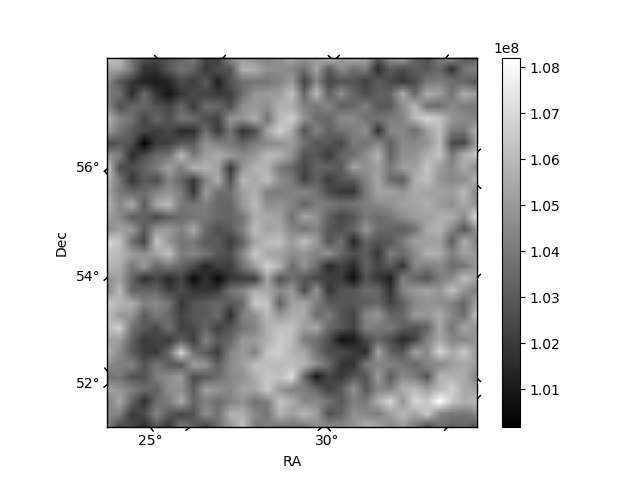
Histogram calculated using DETX and DETY for each event in the final _common_clean file
| Quadrant A | 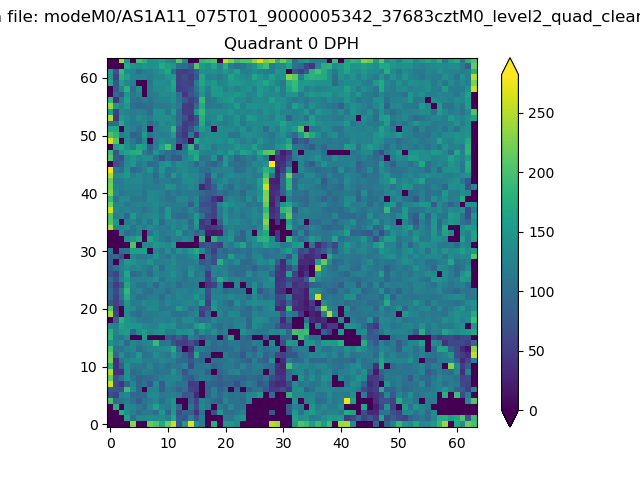 |
 |
Quadrant B |
|---|---|---|---|
| Quadrant D | 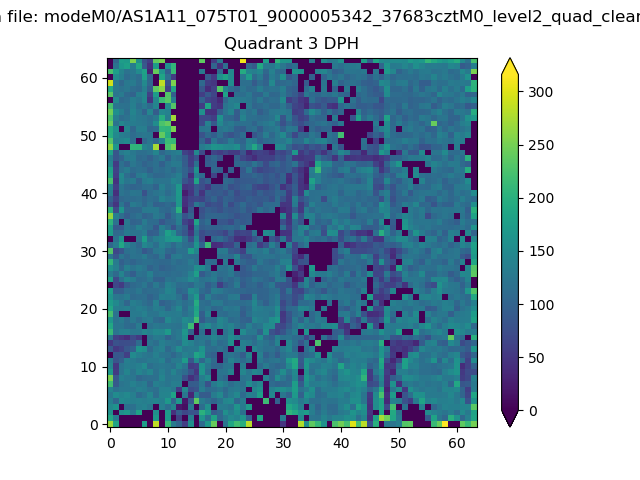 |
 |
Quadrant C |
| Plot type | Count rate plots | Images |
|---|---|---|
| Comparison with Poisson distribution Blue bars denote a histogram of data divided into 1 sec bins. Red curve is a Poisson curve with rate = median count rate of data. |
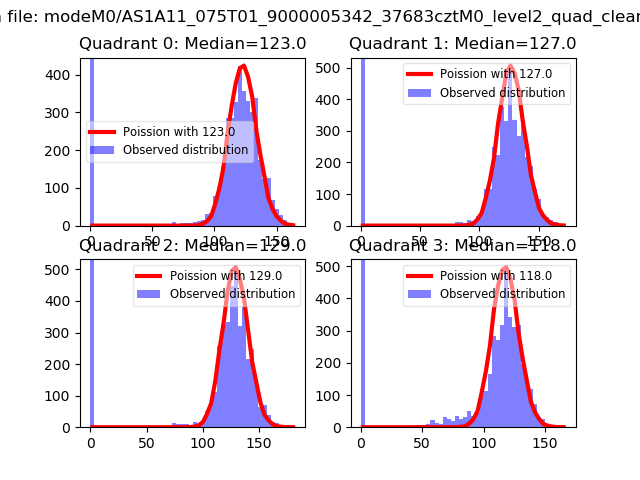 |
 |
| Quadrant-wise count rates Data is divided into 100 sec bins |
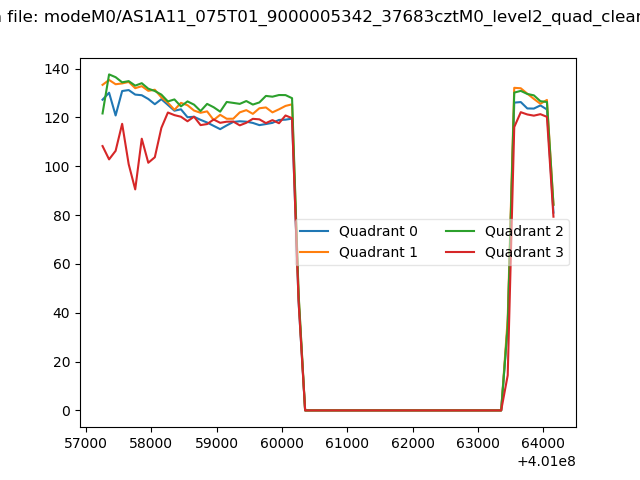 |
|
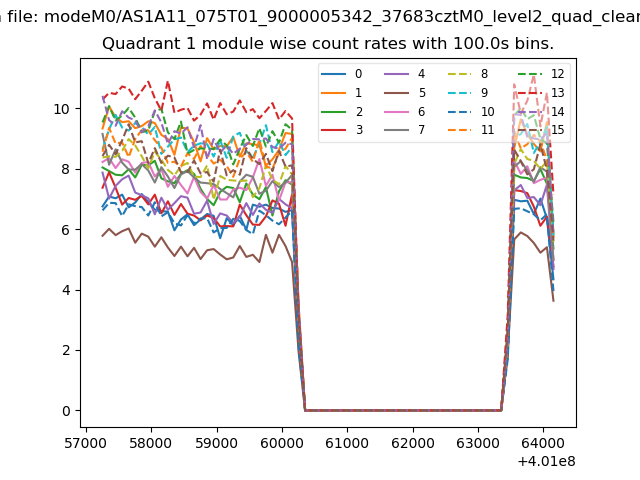
| Module-wise count rates for Quadrant A Data is divided into 100 sec bins |
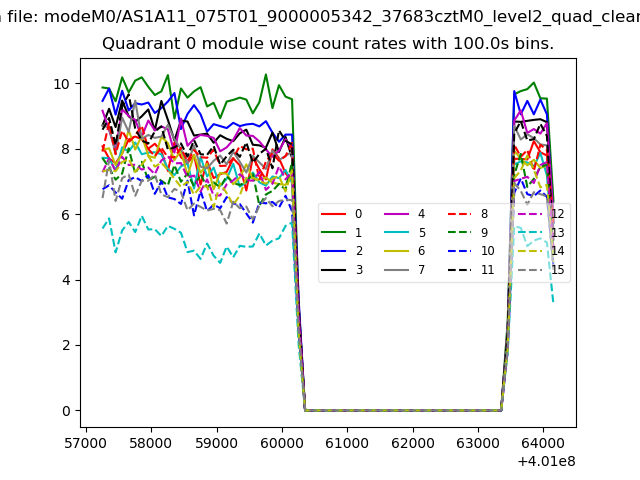 |
 |
| Module-wise count rates for Quadrant B Data is divided into 100 sec bins |
 |
 |
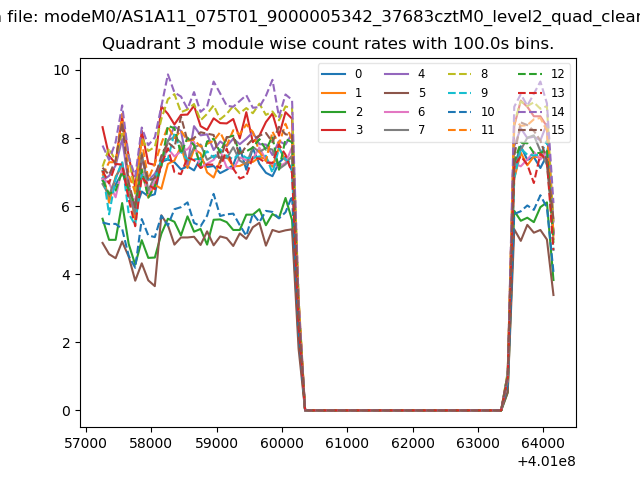
| Module-wise count rates for Quadrant C Data is divided into 100 sec bins |
 |
 |
| Module-wise count rates for Quadrant D Data is divided into 100 sec bins |
 |
 |
| Parameter | Plot |
|---|---|
| CZT HV Monitor | 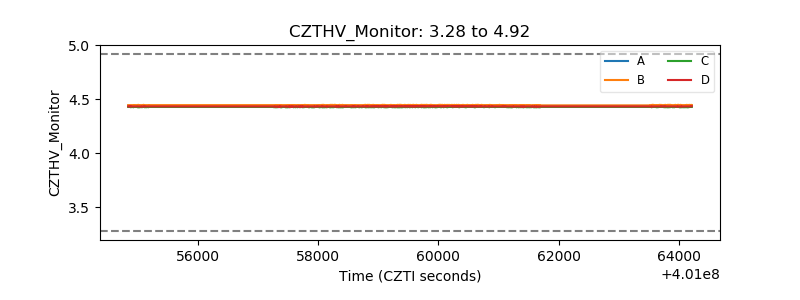 |
| D_VDD | 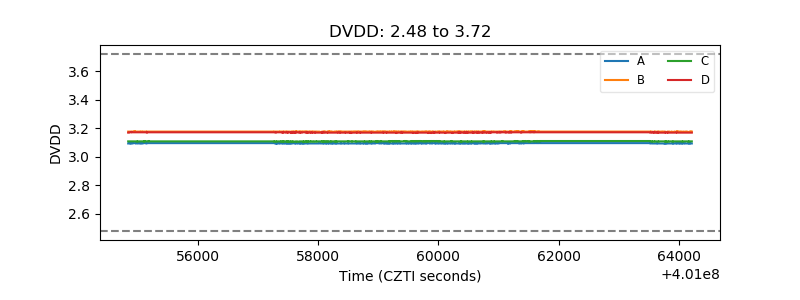 |
| Temperature 1 | 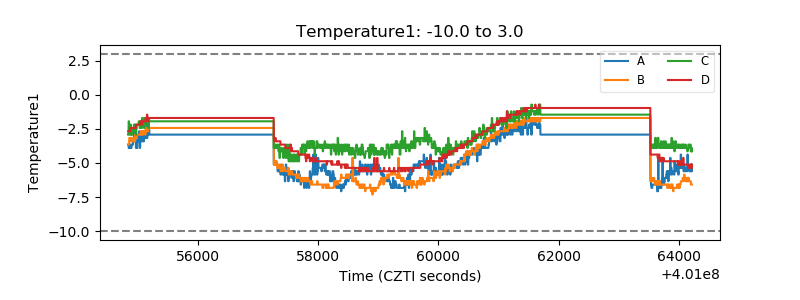 |
| Veto HV Monitor | 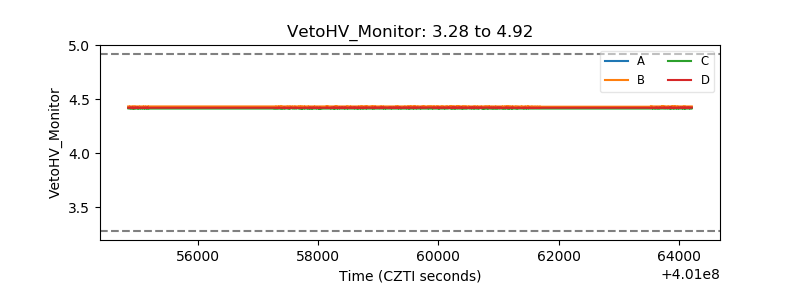 |
| Veto LLD | 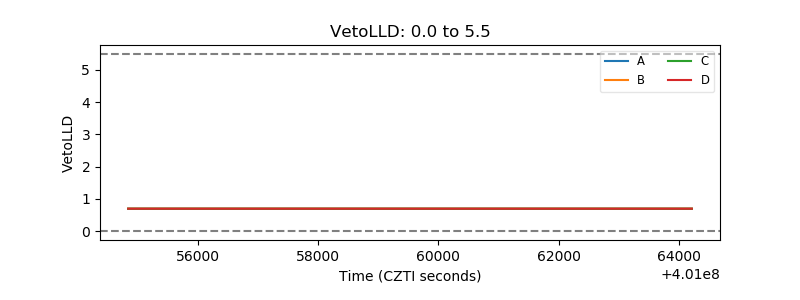 |
| Alpha Counter | 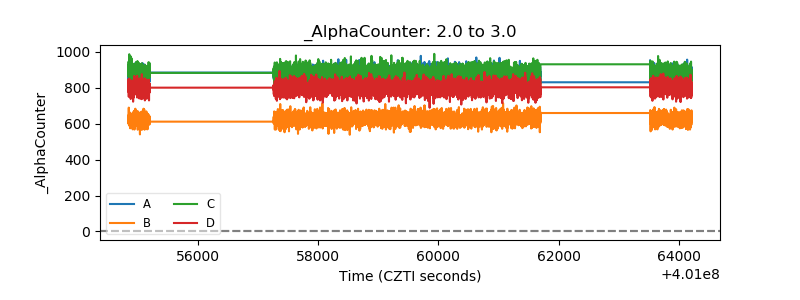 |
| _CPM_Rate | 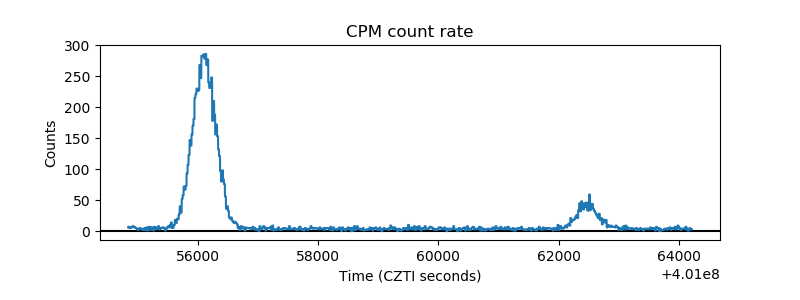 |
| CZT Counter | 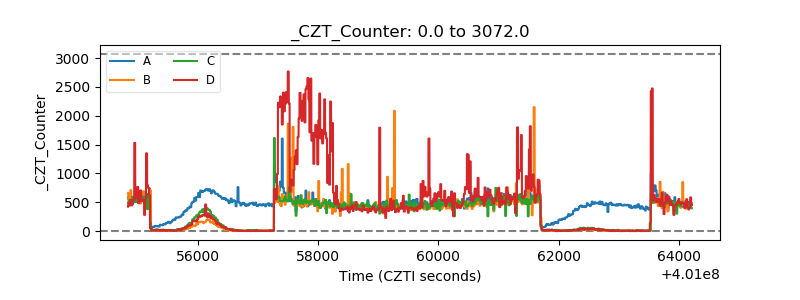 |
| +2.5 Volts monitor | 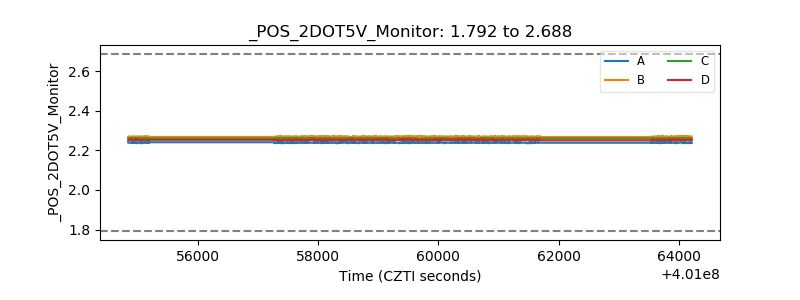 |
| +5 Volts monitor | 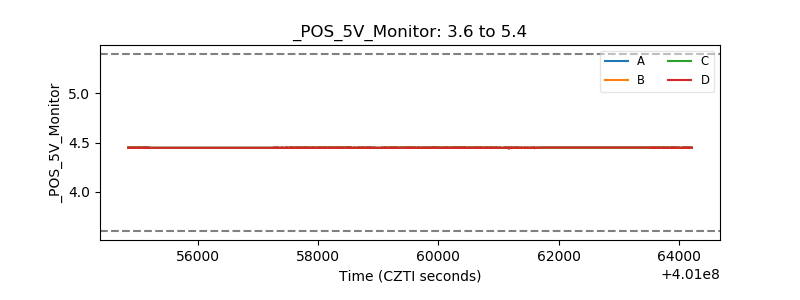 |
| _ROLL_ROT | 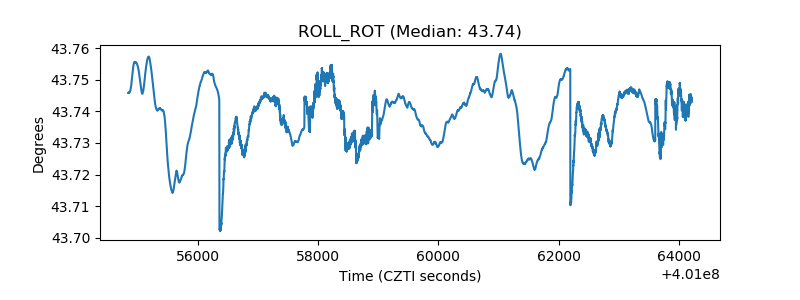 |
| _Roll_DEC | 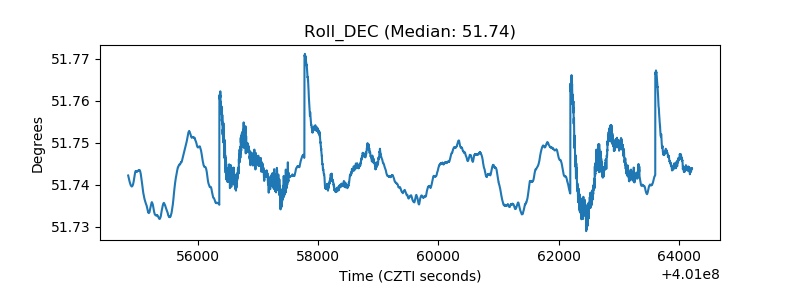 |
| _Roll_RA | 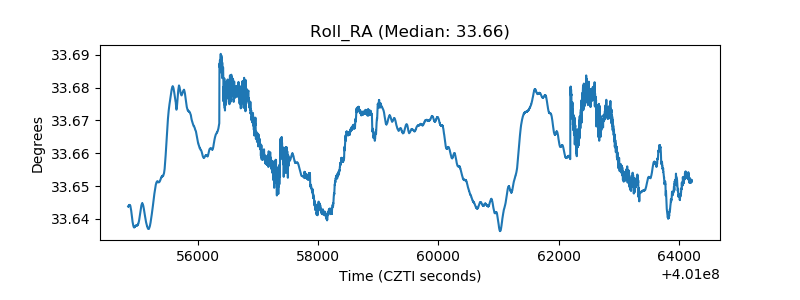 |
| Veto Counter | 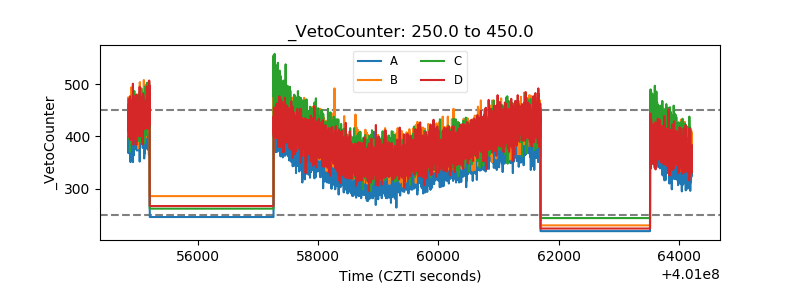 |