| Param | Original file | Final file |
|---|---|---|
| Filename | modeM0/AS1A11_075T01_9000005342_37684cztM0_level2.evt | modeM0/AS1A11_075T01_9000005342_37684cztM0_level2_quad_clean.evt |
| Size (bytes) | 378,616,320 | 69,684,480 |
| Size | 361.1 MB | 66.5 MB |
| Events in quadrant A | 2,808,075 | 425,998 |
| Events in quadrant B | 2,706,460 | 440,406 |
| Events in quadrant C | 2,656,668 | 442,877 |
| Events in quadrant D | 2,921,616 | 416,550 |
| Mode SS | |||
|---|---|---|---|
| Quadrant | BADHDUFLAG | Total packets | Discarded packets |
| A | 0 | 110 | 0 |
| B | 0 | 110 | 0 |
| C | 0 | 110 | 0 |
| D | 0 | 110 | 0 |
| Mode M0 | |||
|---|---|---|---|
| Quadrant | BADHDUFLAG | Total packets | Discarded packets |
| A | 0 | 11910 | 3 |
| B | 0 | 11850 | 2 |
| C | 0 | 11318 | 2 |
| D | 0 | 12563 | 2 |
| Mode M9 | |||
|---|---|---|---|
| Quadrant | BADHDUFLAG | Total packets | Discarded packets |
| A | 0 | 27 | 0 |
| B | 0 | 27 | 0 |
| C | 0 | 27 | 0 |
| D | 0 | 28 | 0 |
| Quadrant | Total seconds | Saturated seconds | Saturation percentage |
|---|---|---|---|
| A | 5495 | 11 | 0.200182% |
| B | 5495 | 91 | 1.656051% |
| C | 5495 | 12 | 0.218380% |
| D | 5495 | 91 | 1.656051% |
Noise dominated data is calculated using 1-second bins in cleaned event files. If a bin has >2000 counts, and if more than 50% of those come from <1% of pixels, then it is considered to be noise-dominated and hence unusable.
| Quadrant | # 1 sec bins | Bins with >0 counts | Bins with >2000 counts | High rate bins dominated by noise | Noise dominated (total time) | Noise dominated (detector-on time) | Marked lightcurve |
|---|---|---|---|---|---|---|---|
| A | 6959 | 5495 | 4 | 4 | 0.06% | 0.07% | 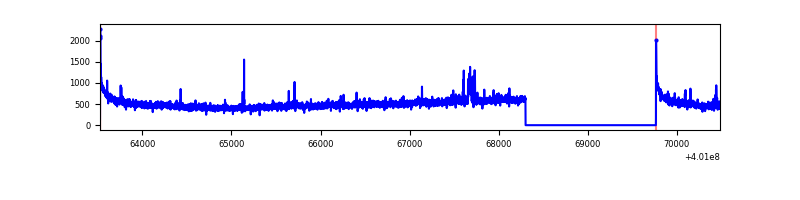 |
| B | 6958 | 5494 | 56 | 56 | 0.80% | 1.02% | 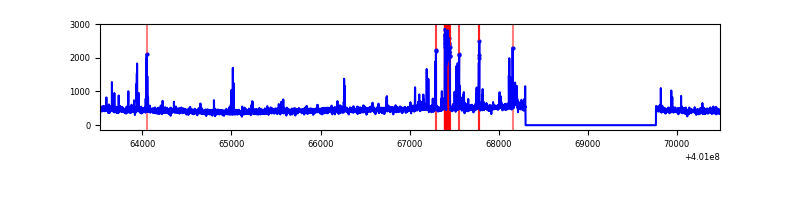 |
| C | 6958 | 5494 | 10 | 10 | 0.14% | 0.18% | 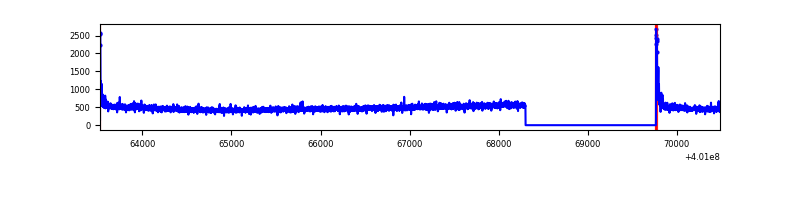 |
| D | 6958 | 5494 | 73 | 73 | 1.05% | 1.33% | 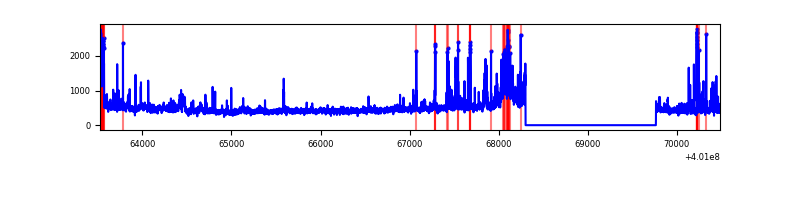 |
Top three noisy pixels from each quadrant. If the there are fewer than three noisy pixels in the level2.evt file, extra rows are filled as -1
| Pixel properties | Quadrant properties | ||||||
|---|---|---|---|---|---|---|---|
| Quadrant | DetID | PixID | Counts | Sigma | Mean | Median | Sigma |
| A | 10 | 83 | 310103 | 2509.93 | 609 | 596 | 123.3 |
| A | 15 | 222 | 84145 | 677.54 | 609 | 596 | 123.3 |
| A | 13 | 248 | 29627 | 235.43 | 609 | 596 | 123.3 |
| B | 5 | 200 | 170190 | 1455.64 | 606 | 590 | 116.5 |
| B | 5 | 172 | 44677 | 378.39 | 606 | 590 | 116.5 |
| B | 0 | 230 | 33736 | 284.49 | 606 | 590 | 116.5 |
| C | 15 | 214 | 247187 | 1767.81 | 600 | 604 | 139.5 |
| C | 0 | 10 | 59531 | 422.46 | 600 | 604 | 139.5 |
| C | 15 | 159 | 4370 | 27.0 | 600 | 604 | 139.5 |
| D | 12 | 227 | 170110 | 1188.31 | 591 | 574 | 142.7 |
| D | 2 | 153 | 143073 | 998.8 | 591 | 574 | 142.7 |
| D | 13 | 249 | 114678 | 799.78 | 591 | 574 | 142.7 |
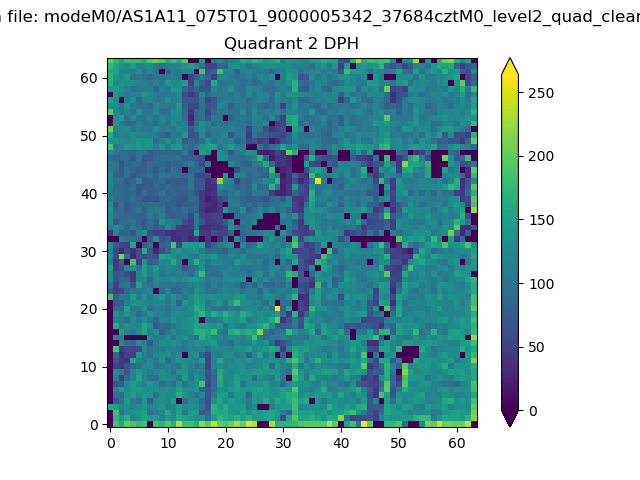
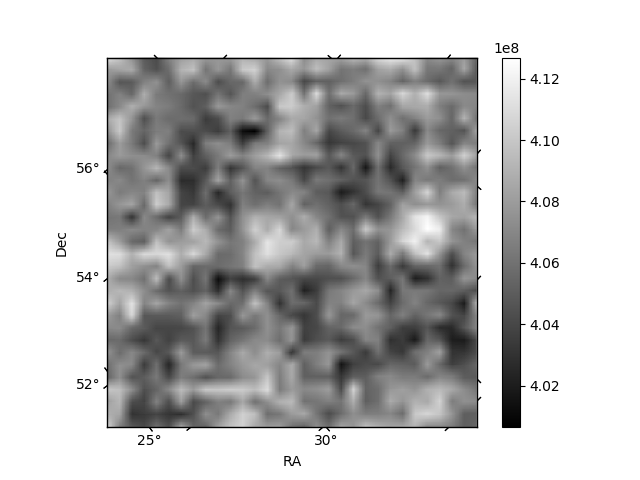
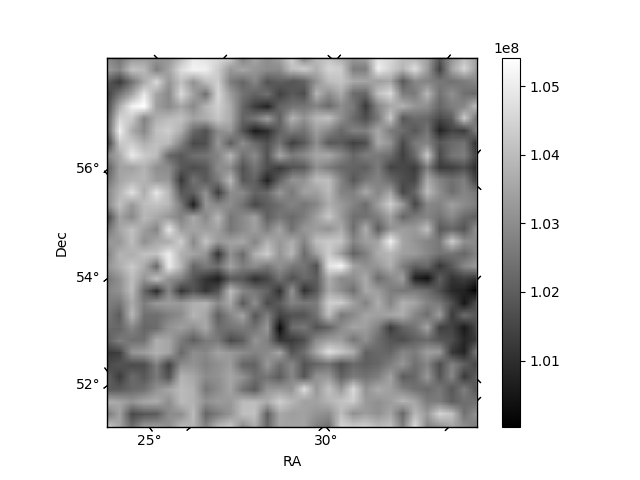
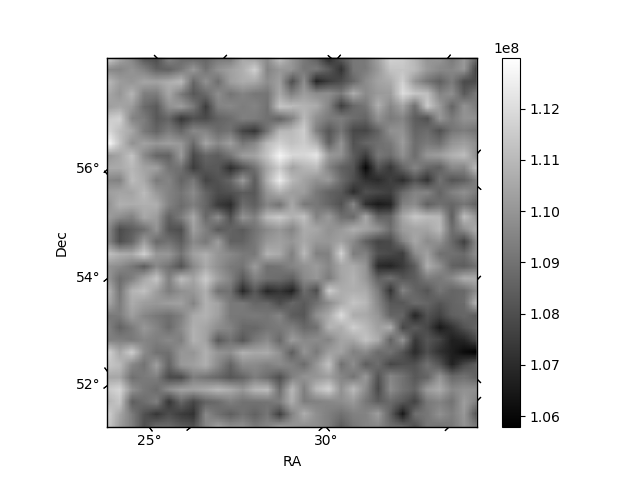
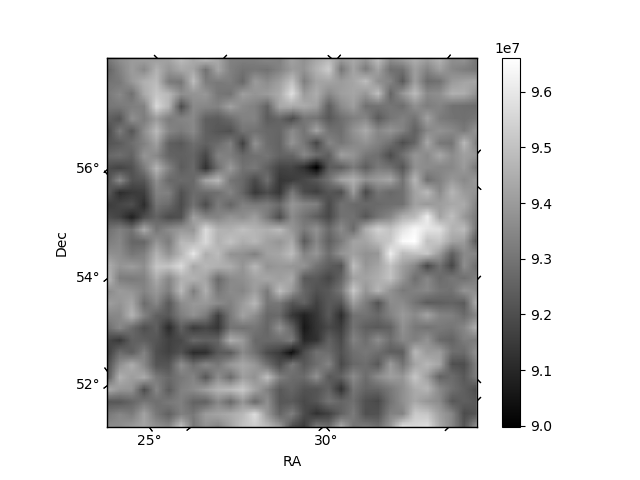
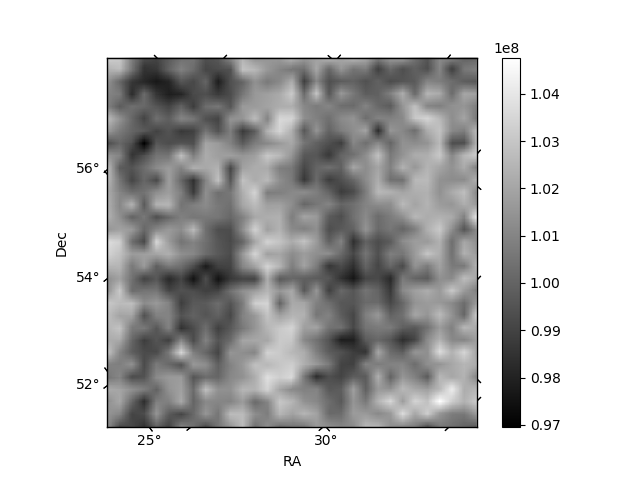
Histogram calculated using DETX and DETY for each event in the final _common_clean file
| Quadrant A | 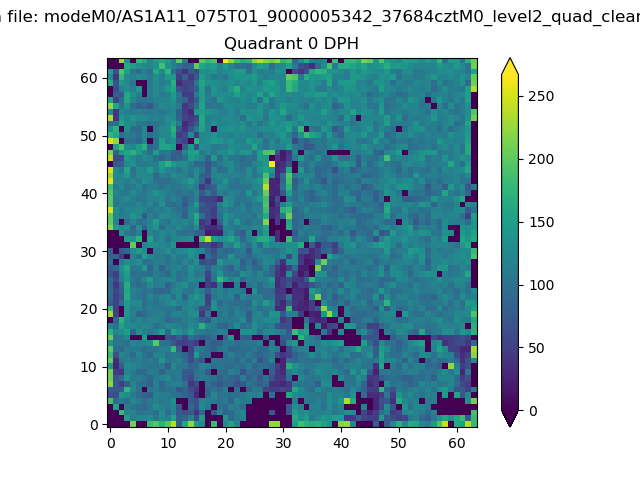 |
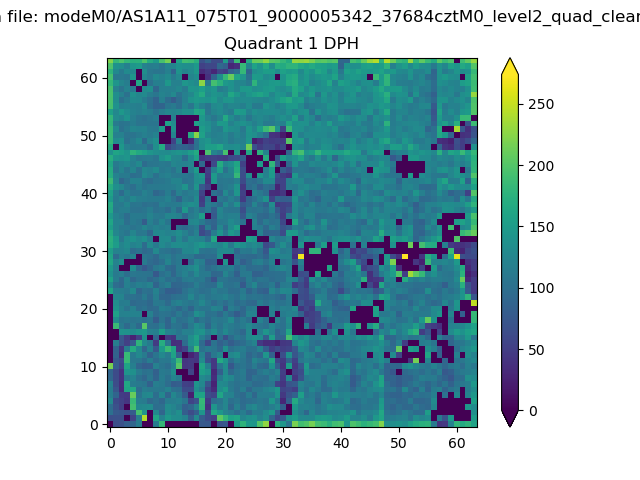 |
Quadrant B |
|---|---|---|---|
| Quadrant D | 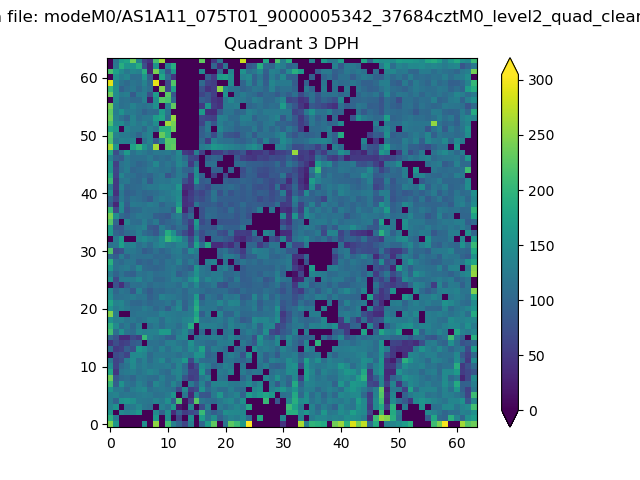 |
 |
Quadrant C |
| Plot type | Count rate plots | Images |
|---|---|---|
| Comparison with Poisson distribution Blue bars denote a histogram of data divided into 1 sec bins. Red curve is a Poisson curve with rate = median count rate of data. |
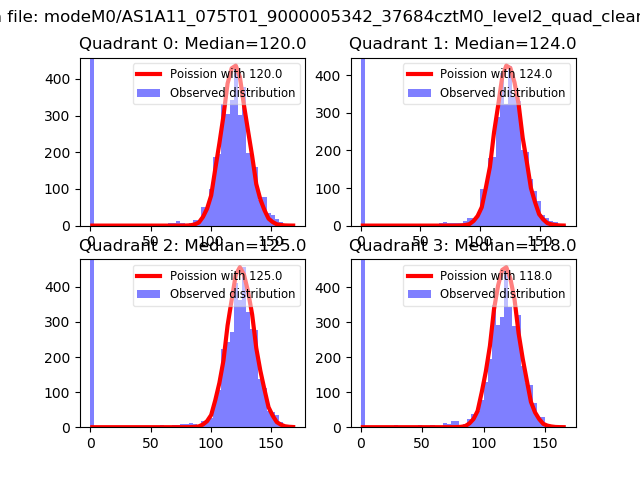 |
 |
| Quadrant-wise count rates Data is divided into 100 sec bins |
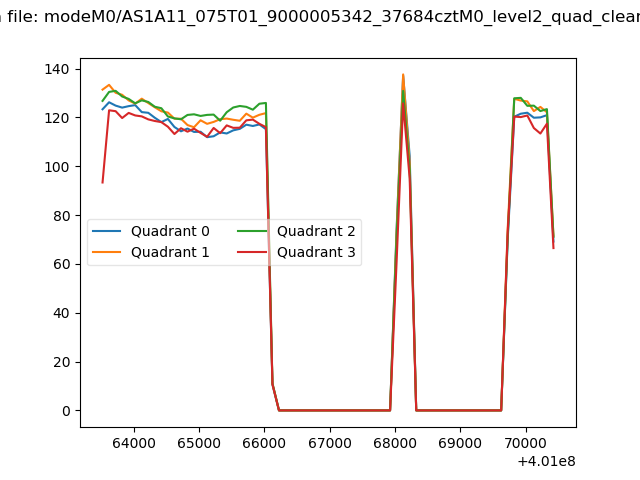 |
|
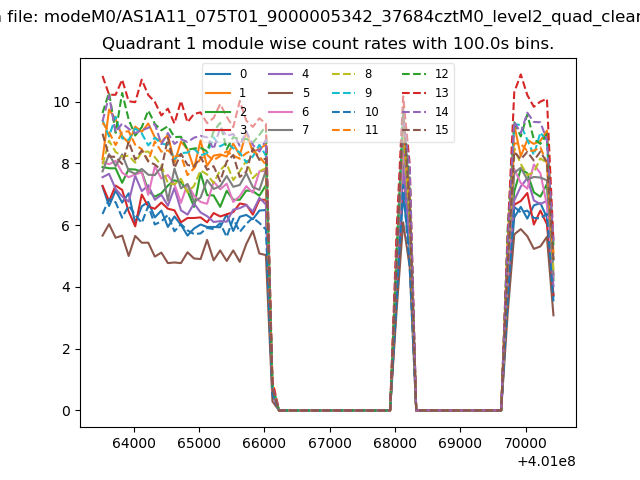
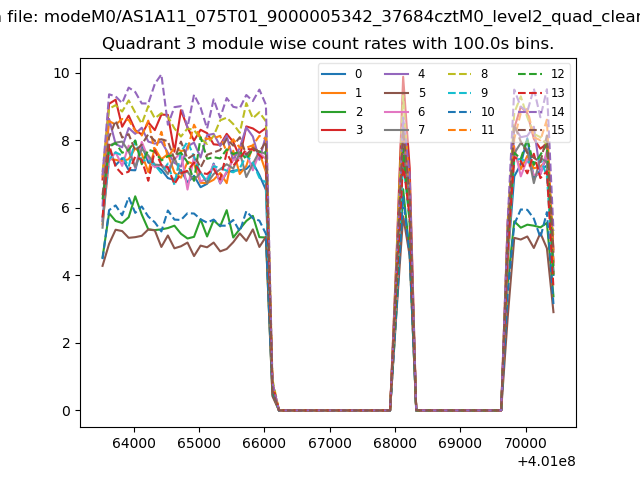
| Module-wise count rates for Quadrant A Data is divided into 100 sec bins |
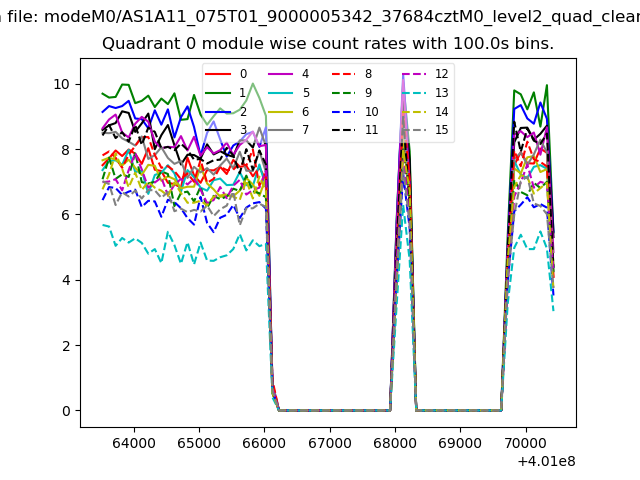 |
 |
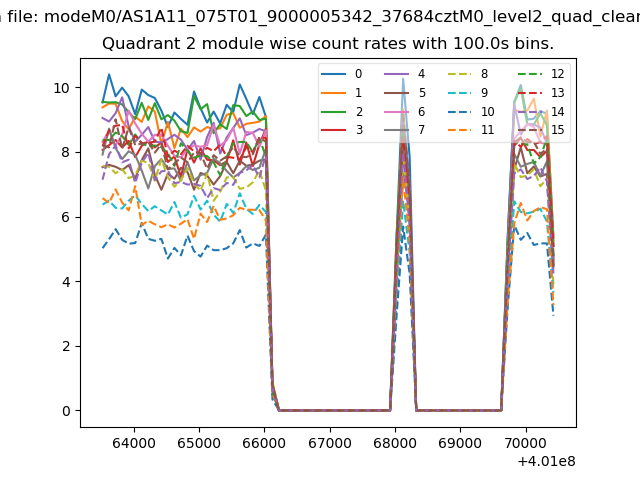
| Module-wise count rates for Quadrant B Data is divided into 100 sec bins |
 |
 |
| Module-wise count rates for Quadrant C Data is divided into 100 sec bins |
 |
 |
| Module-wise count rates for Quadrant D Data is divided into 100 sec bins |
 |
 |
| Parameter | Plot |
|---|---|
| CZT HV Monitor | 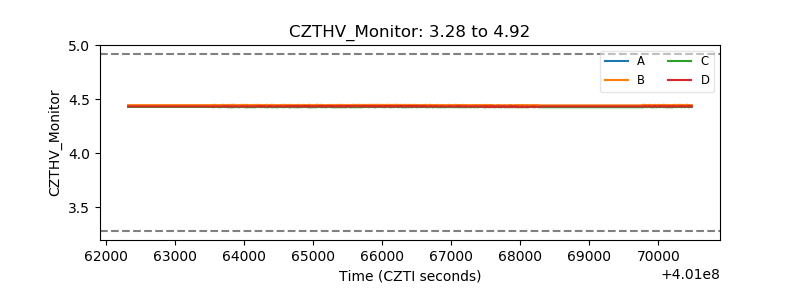 |
| D_VDD | 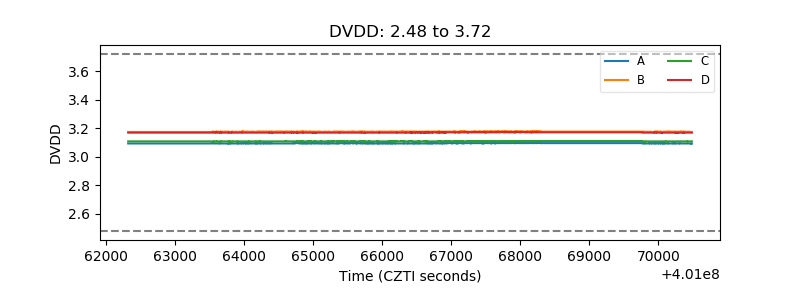 |
| Temperature 1 | 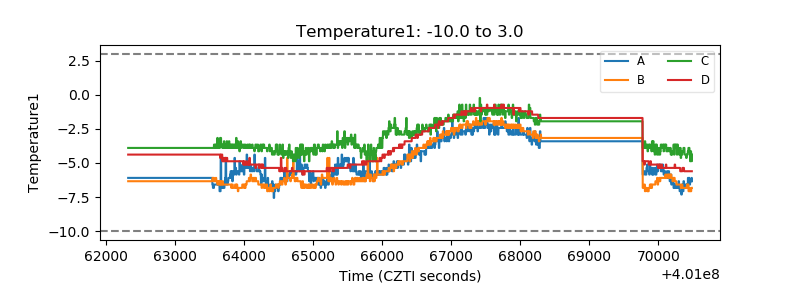 |
| Veto HV Monitor | 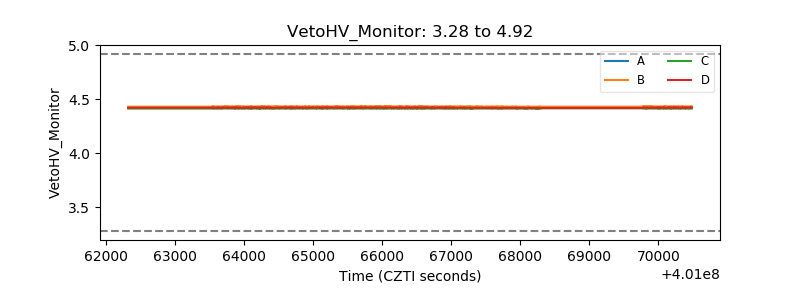 |
| Veto LLD | 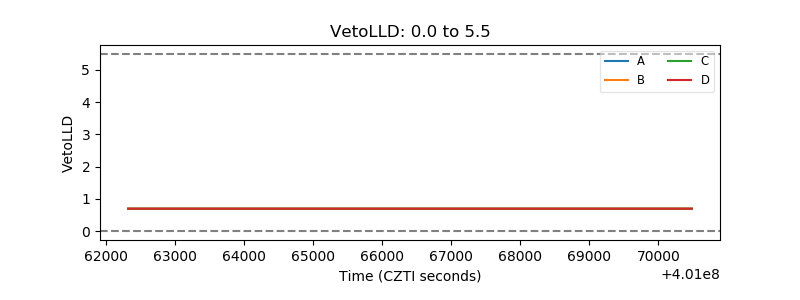 |
| Alpha Counter | 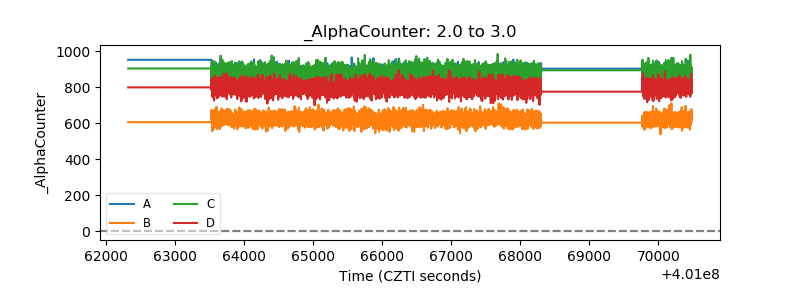 |
| _CPM_Rate | 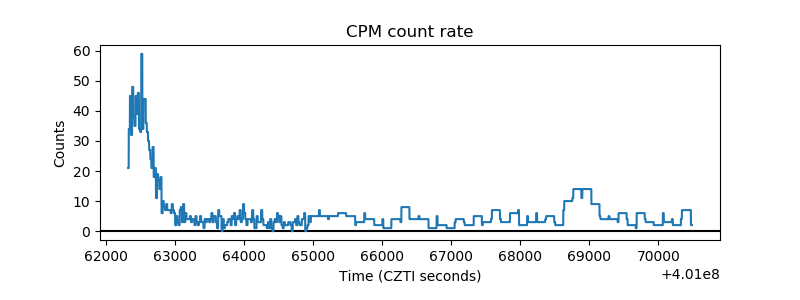 |
| CZT Counter | 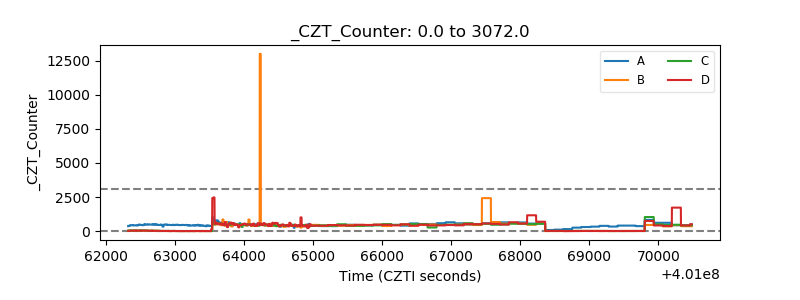 |
| +2.5 Volts monitor | 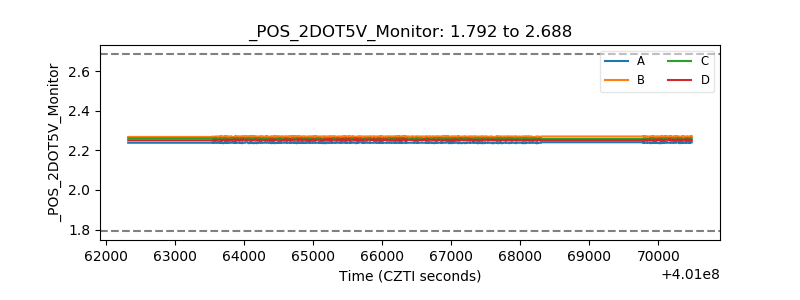 |
| +5 Volts monitor | 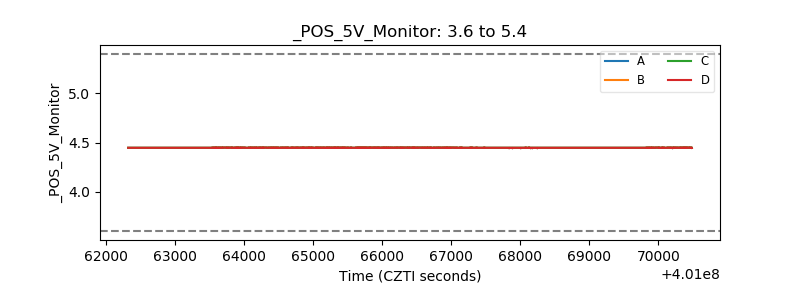 |
| _ROLL_ROT | 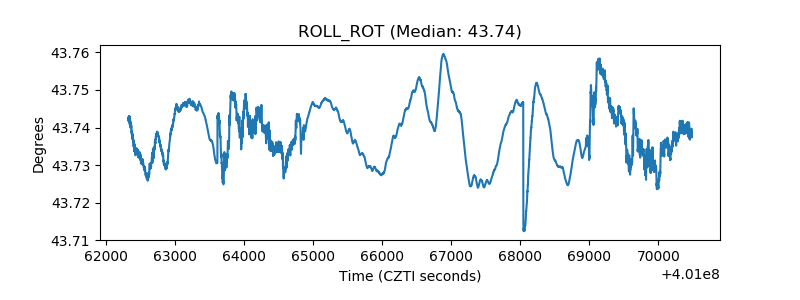 |
| _Roll_DEC | 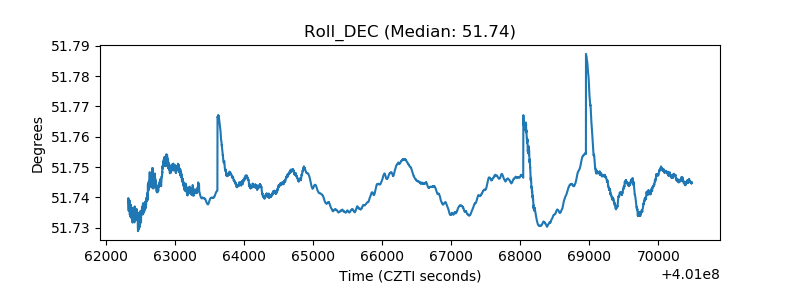 |
| _Roll_RA | 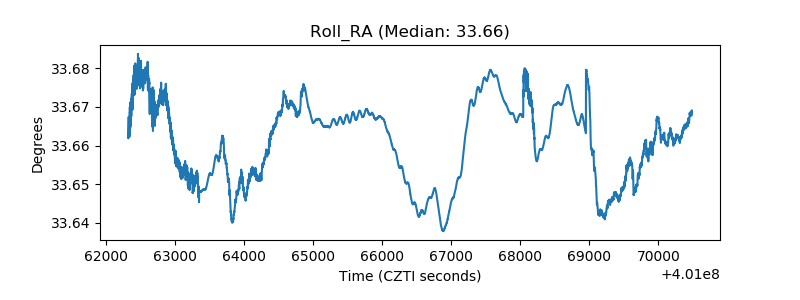 |
| Veto Counter | 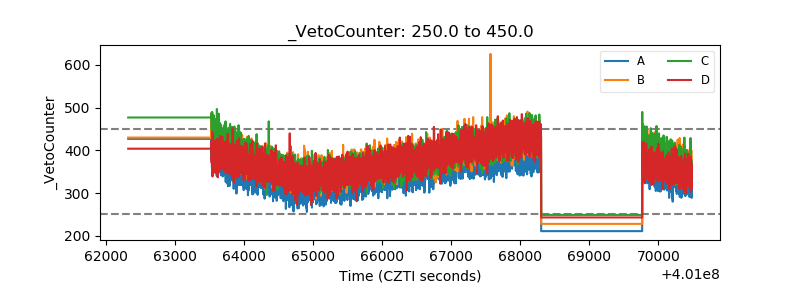 |