| Param | Original file | Final file |
|---|---|---|
| Filename | modeM0/AS1A11_075T01_9000005342_37685cztM0_level2.evt | modeM0/AS1A11_075T01_9000005342_37685cztM0_level2_quad_clean.evt |
| Size (bytes) | 476,380,800 | 81,702,720 |
| Size | 454.3 MB | 77.9 MB |
| Events in quadrant A | 3,828,293 | 503,227 |
| Events in quadrant B | 3,085,452 | 517,328 |
| Events in quadrant C | 3,106,092 | 520,936 |
| Events in quadrant D | 3,974,490 | 487,805 |
| Mode SS | |||
|---|---|---|---|
| Quadrant | BADHDUFLAG | Total packets | Discarded packets |
| A | 0 | 130 | 0 |
| B | 0 | 130 | 0 |
| C | 0 | 130 | 0 |
| D | 0 | 130 | 0 |
| Mode M0 | |||
|---|---|---|---|
| Quadrant | BADHDUFLAG | Total packets | Discarded packets |
| A | 0 | 15564 | 3 |
| B | 0 | 13529 | 2 |
| C | 0 | 13207 | 2 |
| D | 0 | 16508 | 2 |
| Mode M9 | |||
|---|---|---|---|
| Quadrant | BADHDUFLAG | Total packets | Discarded packets |
| A | 0 | 28 | 0 |
| B | 0 | 28 | 0 |
| C | 0 | 28 | 0 |
| D | 0 | 28 | 0 |
| Quadrant | Total seconds | Saturated seconds | Saturation percentage |
|---|---|---|---|
| A | 6379 | 162 | 2.539583% |
| B | 6379 | 42 | 0.658410% |
| C | 6379 | 12 | 0.188117% |
| D | 6379 | 241 | 3.778022% |
Noise dominated data is calculated using 1-second bins in cleaned event files. If a bin has >2000 counts, and if more than 50% of those come from <1% of pixels, then it is considered to be noise-dominated and hence unusable.
| Quadrant | # 1 sec bins | Bins with >0 counts | Bins with >2000 counts | High rate bins dominated by noise | Noise dominated (total time) | Noise dominated (detector-on time) | Marked lightcurve |
|---|---|---|---|---|---|---|---|
| A | 9155 | 6379 | 142 | 142 | 1.55% | 2.23% | 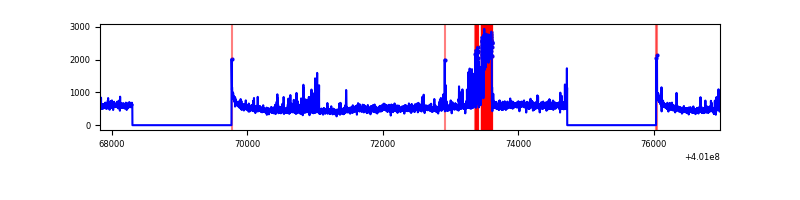 |
| B | 9156 | 6379 | 19 | 19 | 0.21% | 0.30% | 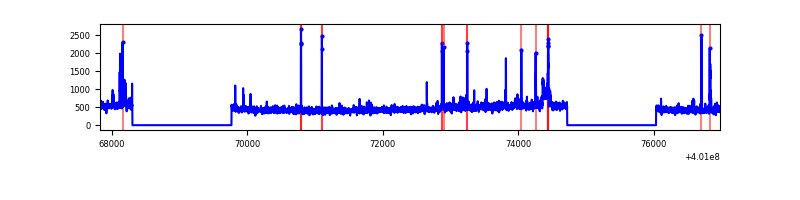 |
| C | 9156 | 6379 | 9 | 9 | 0.10% | 0.14% | 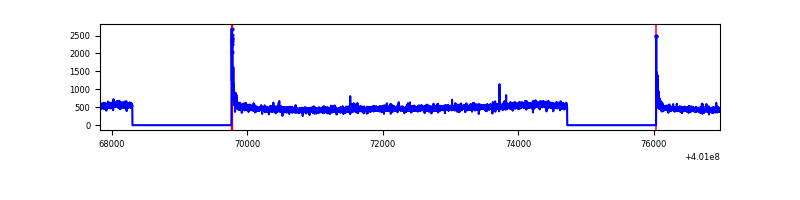 |
| D | 9156 | 6380 | 197 | 197 | 2.15% | 3.09% | 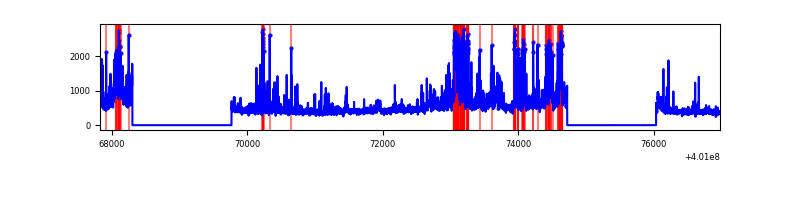 |
Top three noisy pixels from each quadrant. If the there are fewer than three noisy pixels in the level2.evt file, extra rows are filled as -1
| Pixel properties | Quadrant properties | ||||||
|---|---|---|---|---|---|---|---|
| Quadrant | DetID | PixID | Counts | Sigma | Mean | Median | Sigma |
| A | 15 | 222 | 402721 | 2812.4 | 705 | 692 | 142.9 |
| A | 10 | 83 | 347260 | 2424.42 | 705 | 692 | 142.9 |
| A | 13 | 248 | 328413 | 2292.57 | 705 | 692 | 142.9 |
| B | 5 | 200 | 63312 | 453.29 | 717 | 695 | 138.1 |
| B | 5 | 172 | 43962 | 313.21 | 717 | 695 | 138.1 |
| B | 15 | 85 | 39810 | 283.15 | 717 | 695 | 138.1 |
| C | 15 | 214 | 277171 | 1699.97 | 705 | 709 | 162.6 |
| C | 0 | 10 | 68954 | 419.64 | 705 | 709 | 162.6 |
| C | 15 | 159 | 6808 | 37.5 | 705 | 709 | 162.6 |
| D | 2 | 249 | 635240 | 3778.44 | 690 | 671 | 167.9 |
| D | 13 | 249 | 212701 | 1262.5 | 690 | 671 | 167.9 |
| D | 12 | 227 | 146352 | 867.43 | 690 | 671 | 167.9 |
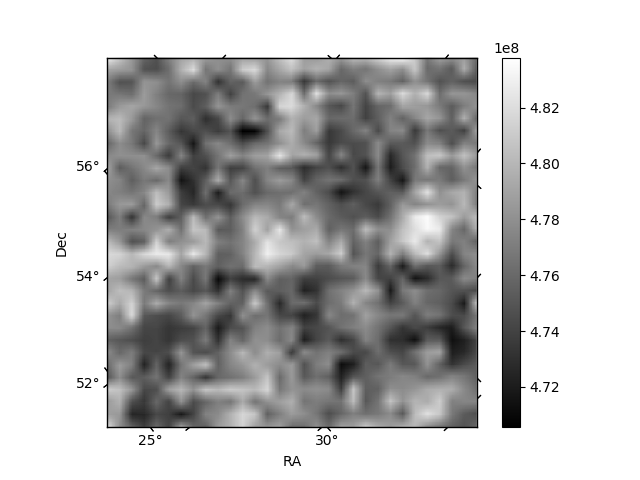
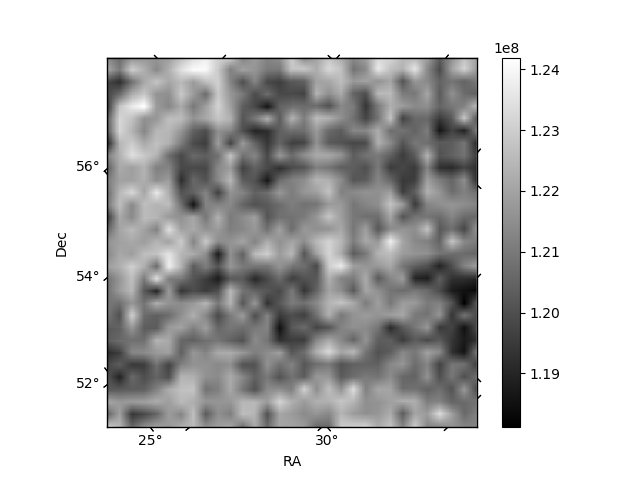
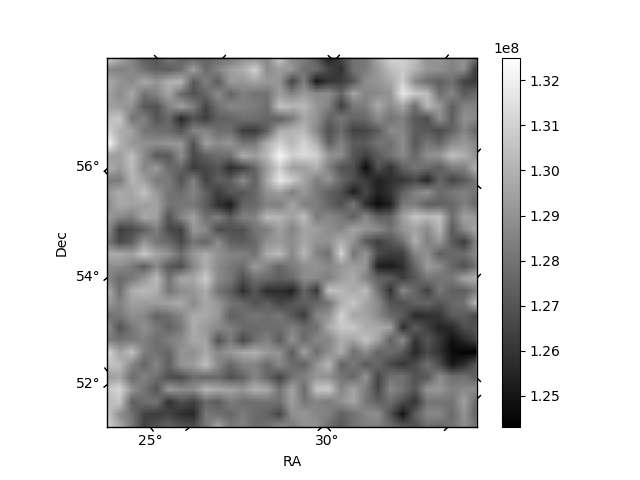
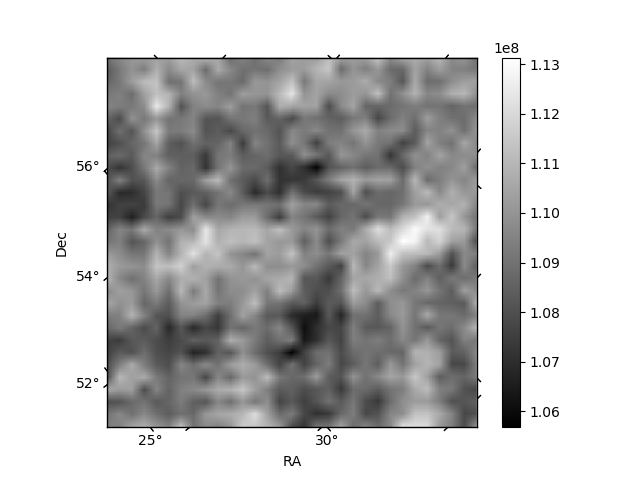
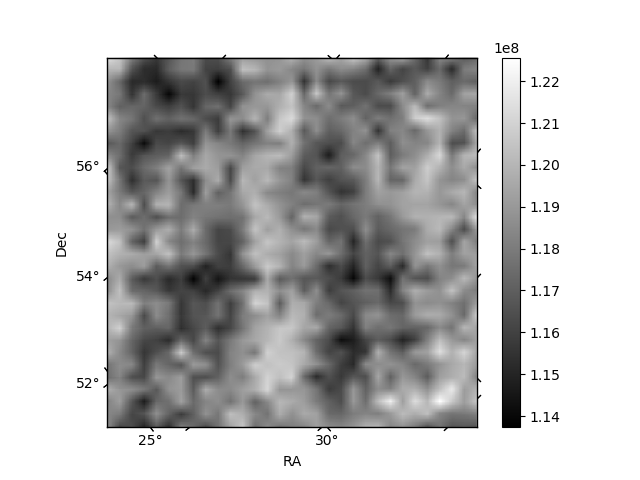
Histogram calculated using DETX and DETY for each event in the final _common_clean file
| Quadrant A | 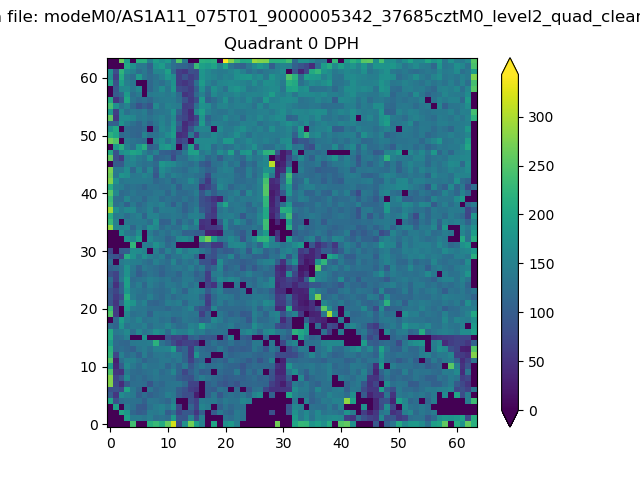 |
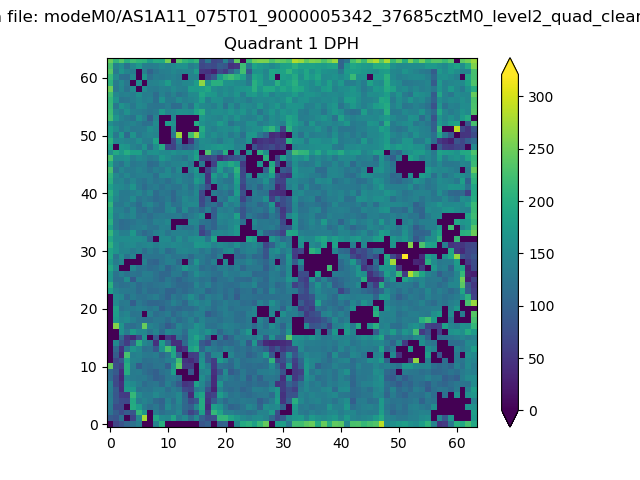 |
Quadrant B |
|---|---|---|---|
| Quadrant D | 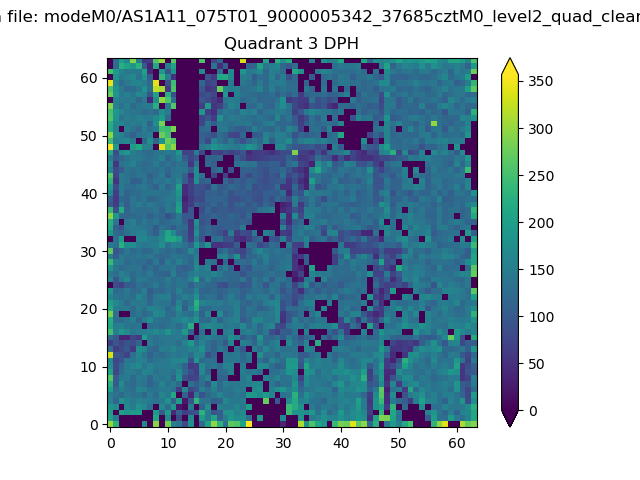 |
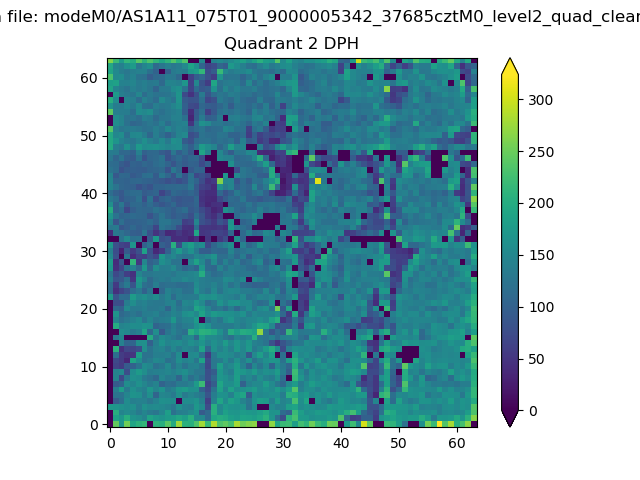 |
Quadrant C |
| Plot type | Count rate plots | Images |
|---|---|---|
| Comparison with Poisson distribution Blue bars denote a histogram of data divided into 1 sec bins. Red curve is a Poisson curve with rate = median count rate of data. |
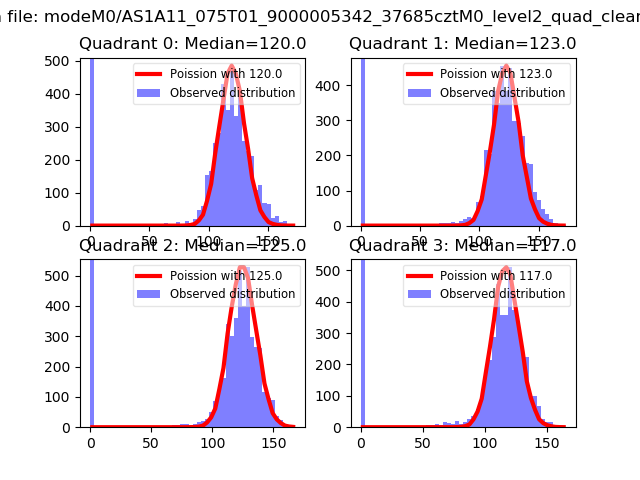 |
 |
| Quadrant-wise count rates Data is divided into 100 sec bins |
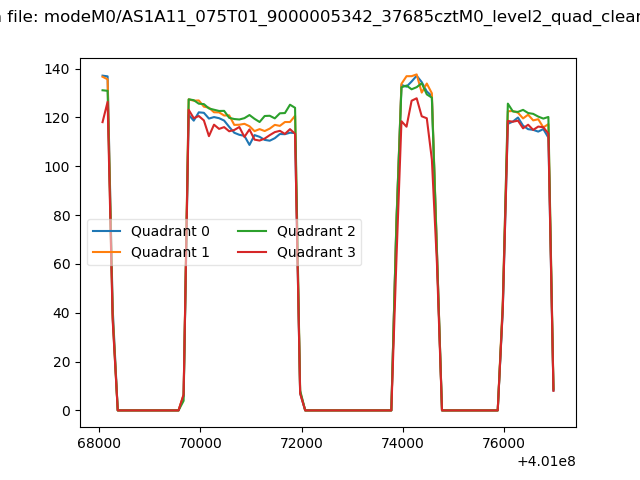 |
|
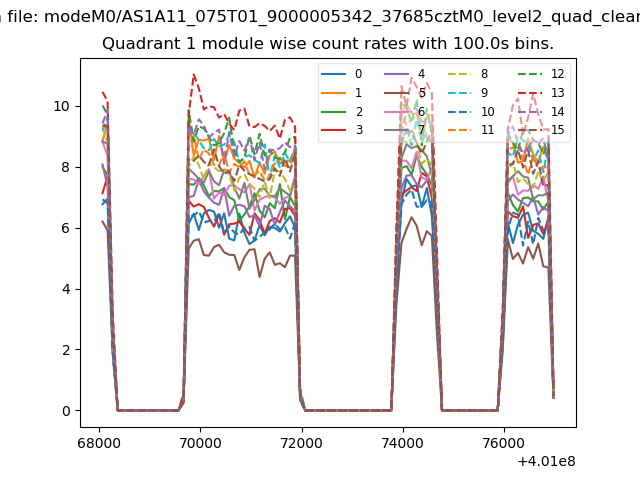
| Module-wise count rates for Quadrant A Data is divided into 100 sec bins |
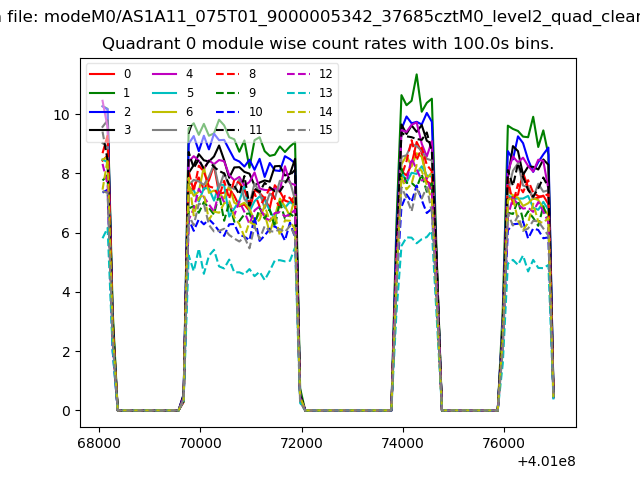 |
 |
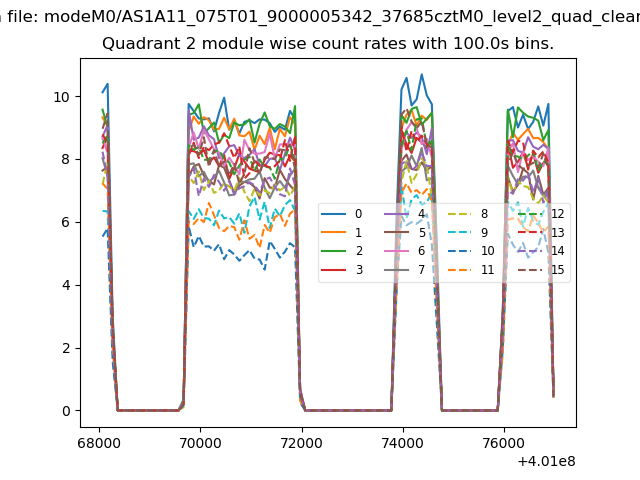
| Module-wise count rates for Quadrant B Data is divided into 100 sec bins |
 |
 |
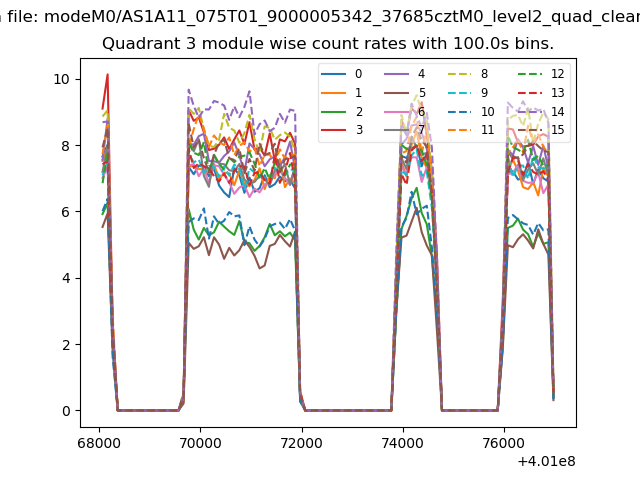
| Module-wise count rates for Quadrant C Data is divided into 100 sec bins |
 |
 |
| Module-wise count rates for Quadrant D Data is divided into 100 sec bins |
 |
 |
| Parameter | Plot |
|---|---|
| CZT HV Monitor |  |
| D_VDD | 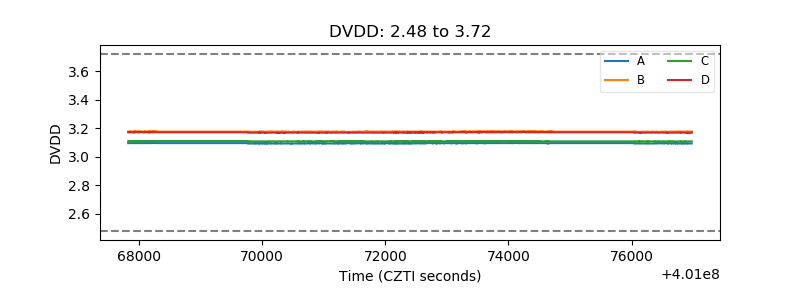 |
| Temperature 1 | 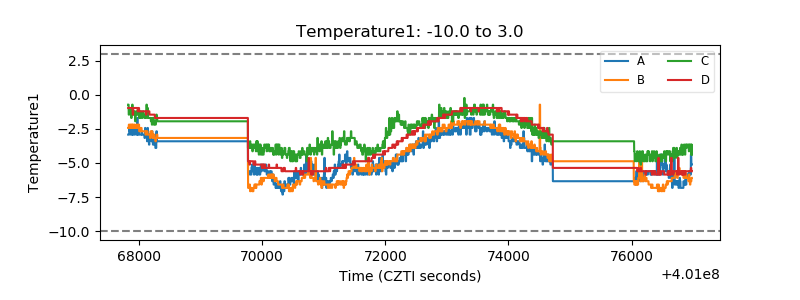 |
| Veto HV Monitor | 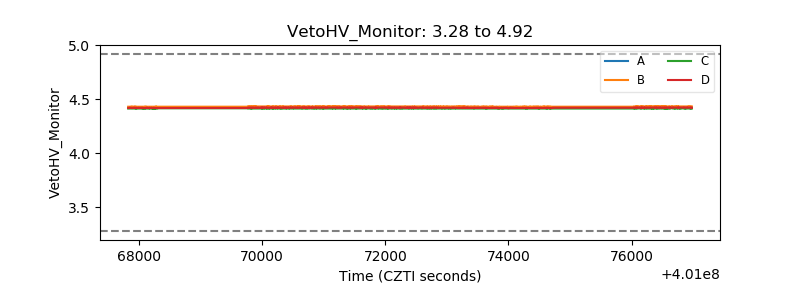 |
| Veto LLD | 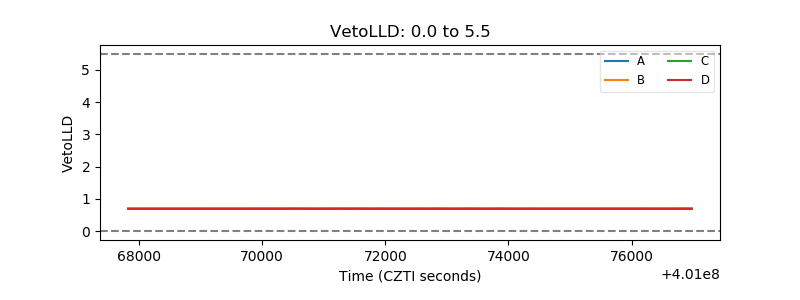 |
| Alpha Counter |  |
| _CPM_Rate | 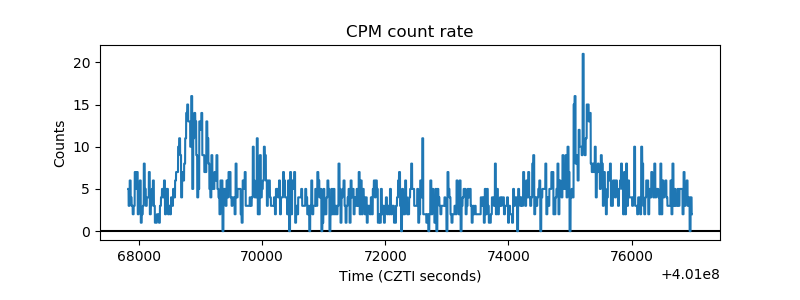 |
| CZT Counter | 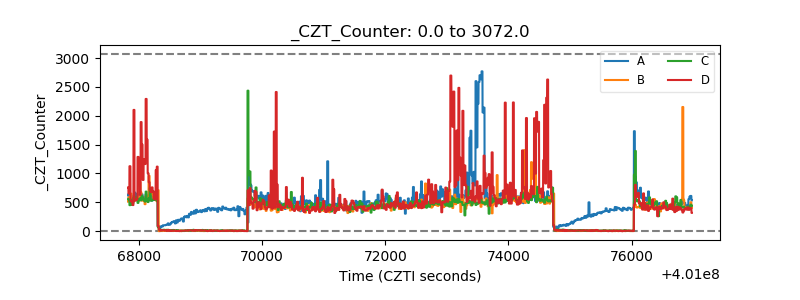 |
| +2.5 Volts monitor | 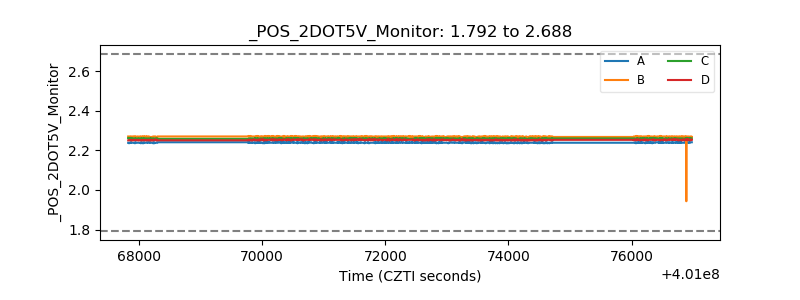 |
| +5 Volts monitor | 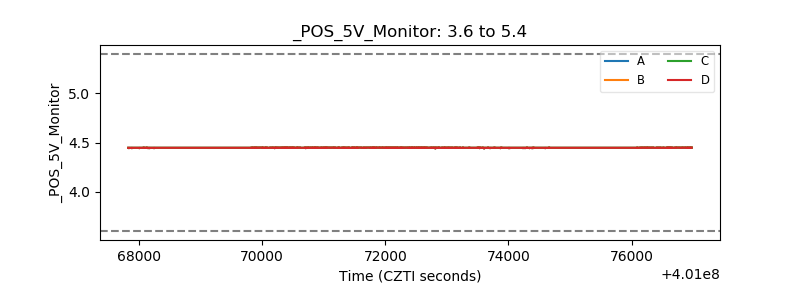 |
| _ROLL_ROT | 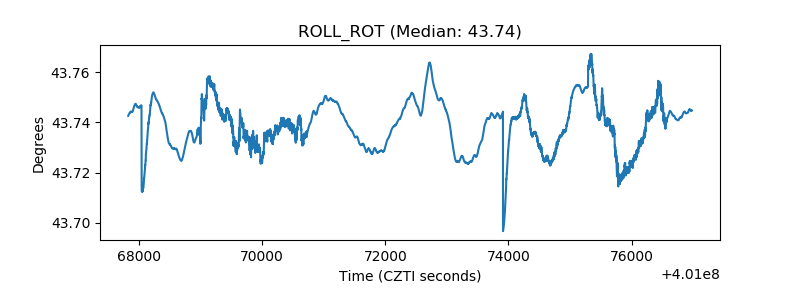 |
| _Roll_DEC | 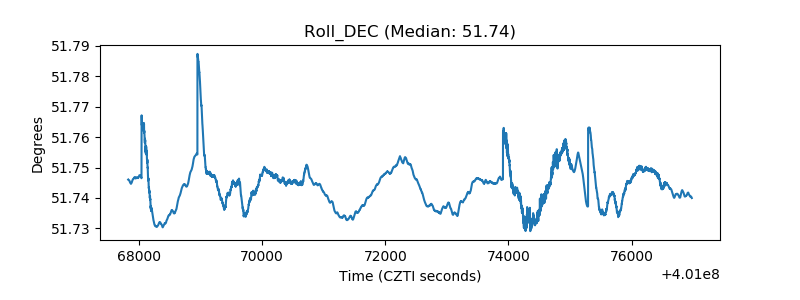 |
| _Roll_RA | 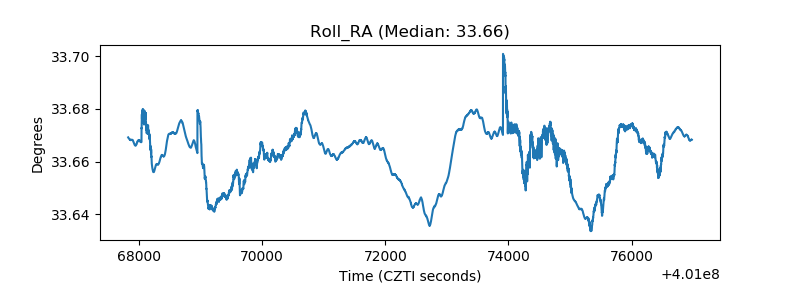 |
| Veto Counter | 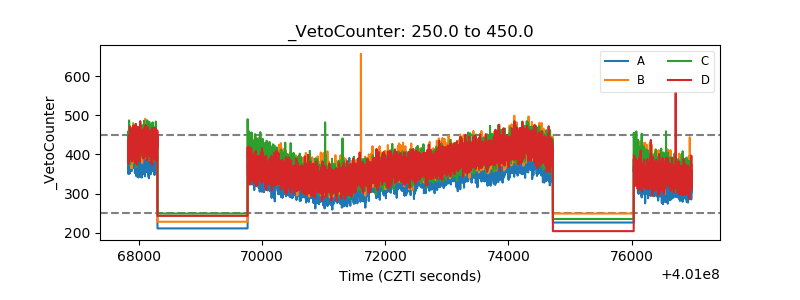 |