| Param | Original file | Final file |
|---|---|---|
| Filename | modeM0/AS1A11_075T01_9000005342_37686cztM0_level2.evt | modeM0/AS1A11_075T01_9000005342_37686cztM0_level2_quad_clean.evt |
| Size (bytes) | 501,223,680 | 84,280,320 |
| Size | 478.0 MB | 80.4 MB |
| Events in quadrant A | 3,839,811 | 523,837 |
| Events in quadrant B | 3,358,459 | 532,709 |
| Events in quadrant C | 3,154,000 | 545,870 |
| Events in quadrant D | 4,396,653 | 506,735 |
| Mode SS | |||
|---|---|---|---|
| Quadrant | BADHDUFLAG | Total packets | Discarded packets |
| A | 0 | 134 | 0 |
| B | 0 | 134 | 0 |
| C | 0 | 134 | 0 |
| D | 0 | 134 | 0 |
| Mode M0 | |||
|---|---|---|---|
| Quadrant | BADHDUFLAG | Total packets | Discarded packets |
| A | 0 | 15660 | 3 |
| B | 0 | 14245 | 2 |
| C | 0 | 13349 | 2 |
| D | 0 | 17811 | 2 |
| Mode M9 | |||
|---|---|---|---|
| Quadrant | BADHDUFLAG | Total packets | Discarded packets |
| A | 0 | 25 | 0 |
| B | 0 | 25 | 0 |
| C | 0 | 25 | 0 |
| D | 0 | 25 | 0 |
| Quadrant | Total seconds | Saturated seconds | Saturation percentage |
|---|---|---|---|
| A | 6337 | 24 | 0.378728% |
| B | 6337 | 150 | 2.367051% |
| C | 6337 | 16 | 0.252485% |
| D | 6337 | 313 | 4.939246% |
Noise dominated data is calculated using 1-second bins in cleaned event files. If a bin has >2000 counts, and if more than 50% of those come from <1% of pixels, then it is considered to be noise-dominated and hence unusable.
| Quadrant | # 1 sec bins | Bins with >0 counts | Bins with >2000 counts | High rate bins dominated by noise | Noise dominated (total time) | Noise dominated (detector-on time) | Marked lightcurve |
|---|---|---|---|---|---|---|---|
| A | 8933 | 6339 | 10 | 10 | 0.11% | 0.16% | 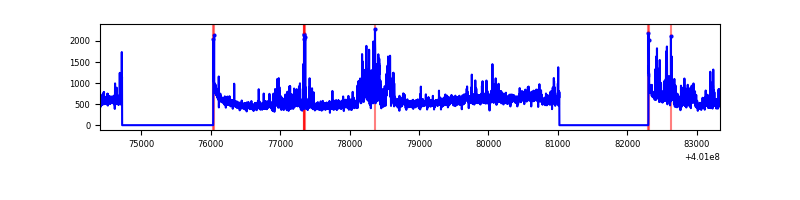 |
| B | 8933 | 6337 | 113 | 113 | 1.26% | 1.78% | 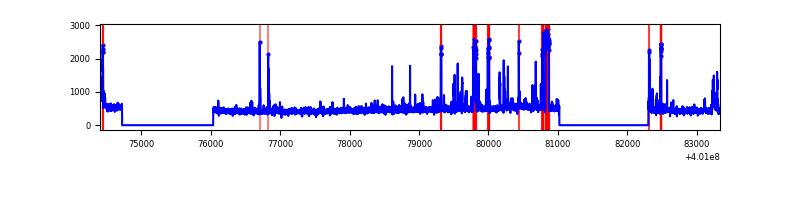 |
| C | 8932 | 6336 | 15 | 15 | 0.17% | 0.24% | 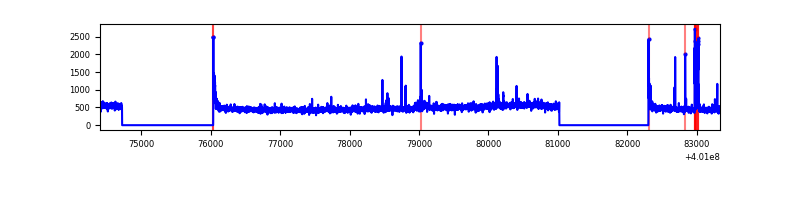 |
| D | 8932 | 6337 | 289 | 289 | 3.24% | 4.56% | 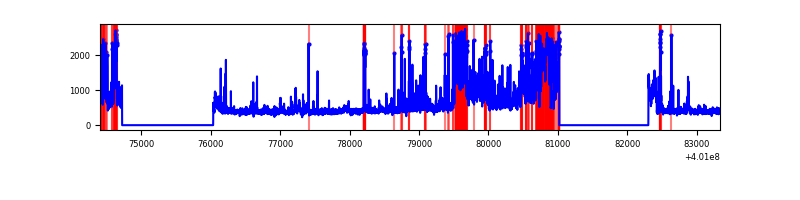 |
Top three noisy pixels from each quadrant. If the there are fewer than three noisy pixels in the level2.evt file, extra rows are filled as -1
| Pixel properties | Quadrant properties | ||||||
|---|---|---|---|---|---|---|---|
| Quadrant | DetID | PixID | Counts | Sigma | Mean | Median | Sigma |
| A | 15 | 222 | 685677 | 4718.5 | 710 | 695 | 145.2 |
| A | 10 | 83 | 347282 | 2387.47 | 710 | 695 | 145.2 |
| A | 7 | 3 | 21816 | 145.49 | 710 | 695 | 145.2 |
| B | 5 | 172 | 117434 | 863.02 | 704 | 685 | 135.3 |
| B | 15 | 54 | 107603 | 790.34 | 704 | 685 | 135.3 |
| B | 5 | 200 | 100581 | 738.44 | 704 | 685 | 135.3 |
| C | 15 | 214 | 274320 | 1688.29 | 698 | 702 | 162.1 |
| C | 14 | 254 | 92873 | 568.72 | 698 | 702 | 162.1 |
| C | 0 | 10 | 46595 | 283.17 | 698 | 702 | 162.1 |
| D | 12 | 227 | 892109 | 5322.12 | 685 | 667 | 167.5 |
| D | 5 | 32 | 199136 | 1184.91 | 685 | 667 | 167.5 |
| D | 13 | 249 | 179119 | 1065.4 | 685 | 667 | 167.5 |
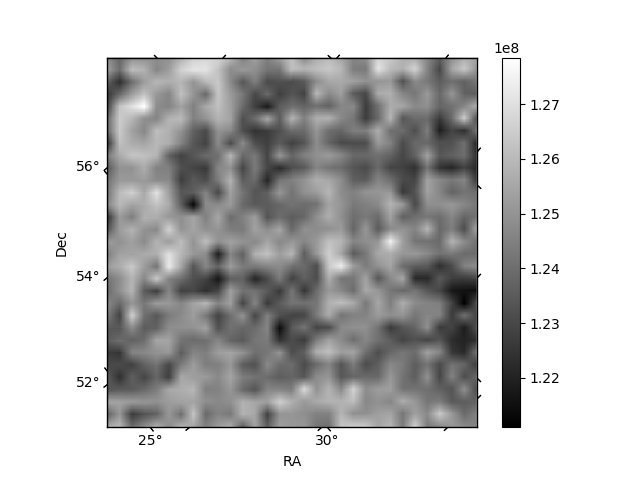
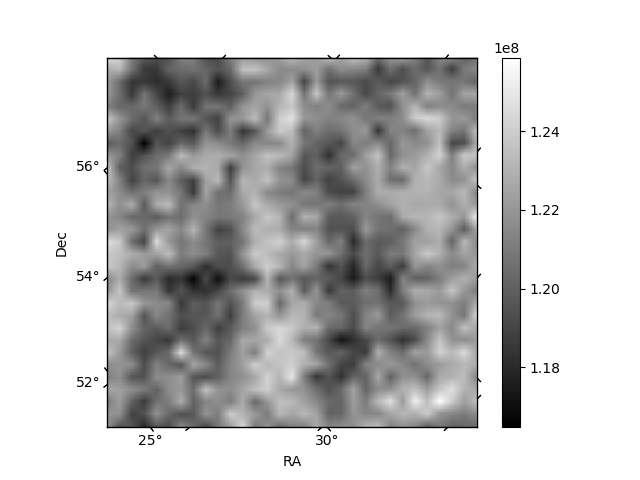
Histogram calculated using DETX and DETY for each event in the final _common_clean file
| Quadrant A | 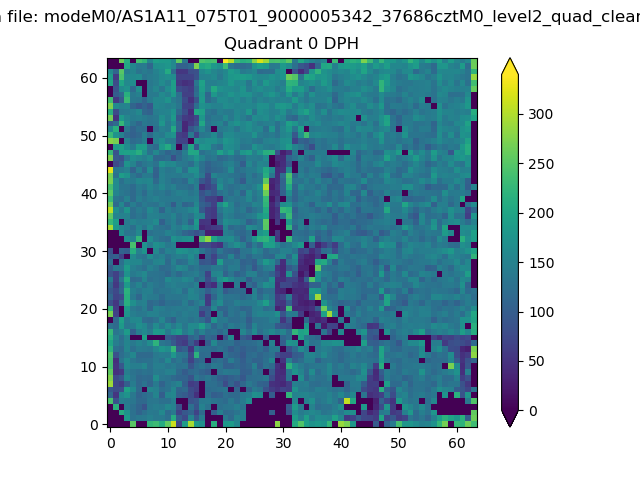 |
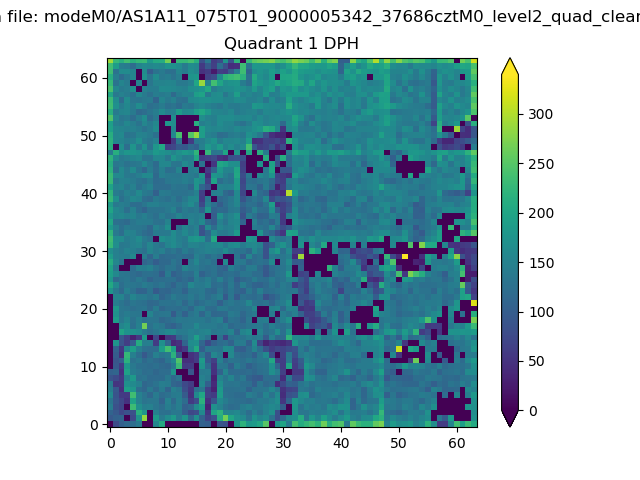 |
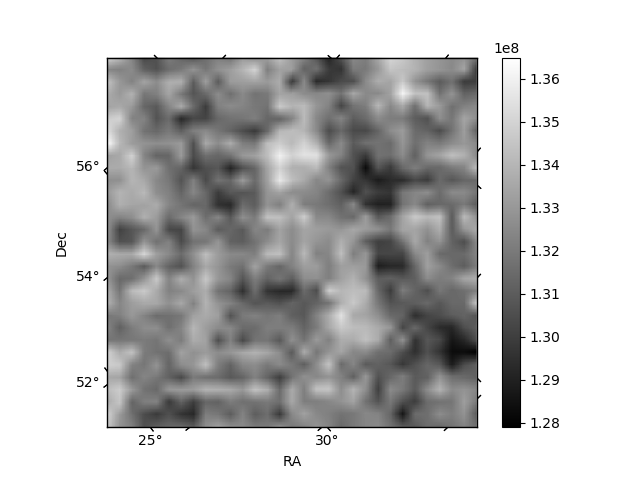
Quadrant B |
|---|---|---|---|
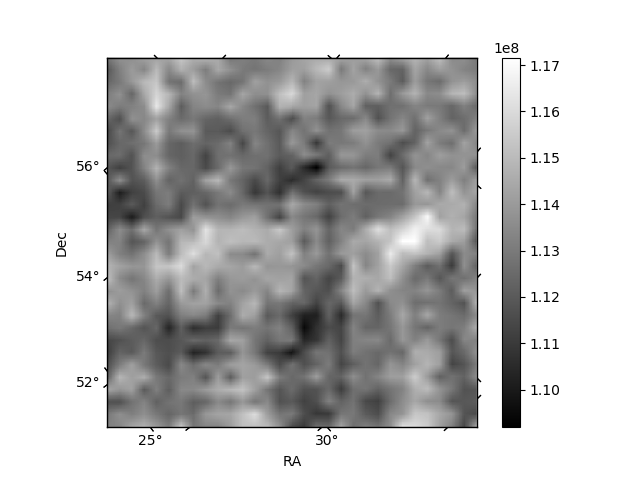
| Quadrant D |  |
 |
Quadrant C |
| Plot type | Count rate plots | Images |
|---|---|---|
| Comparison with Poisson distribution Blue bars denote a histogram of data divided into 1 sec bins. Red curve is a Poisson curve with rate = median count rate of data. |
 |
 |
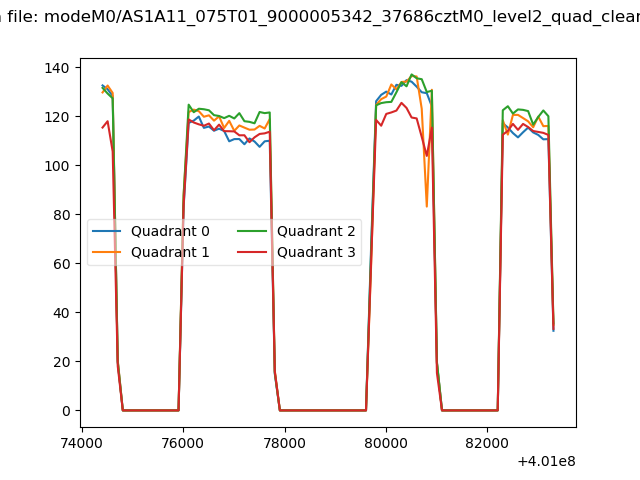
| Quadrant-wise count rates Data is divided into 100 sec bins |
 |
|
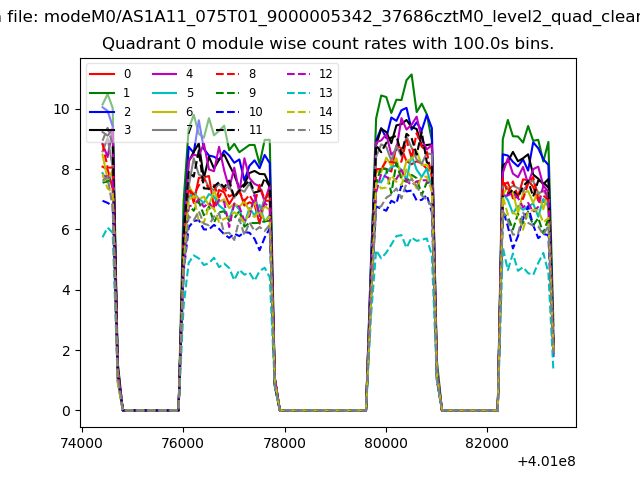
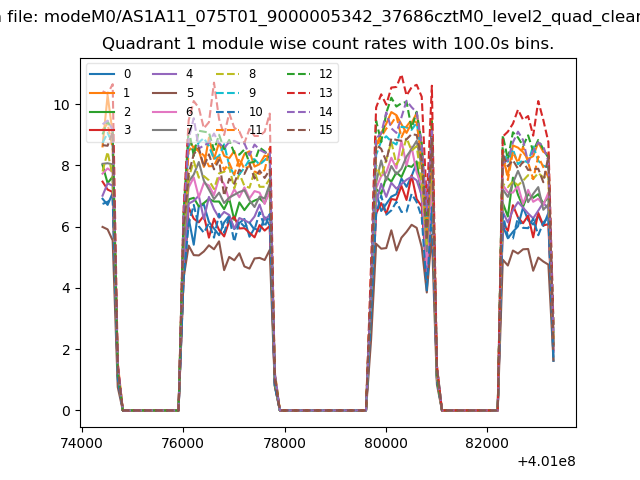
| Module-wise count rates for Quadrant A Data is divided into 100 sec bins |
 |
 |
| Module-wise count rates for Quadrant B Data is divided into 100 sec bins |
 |
 |
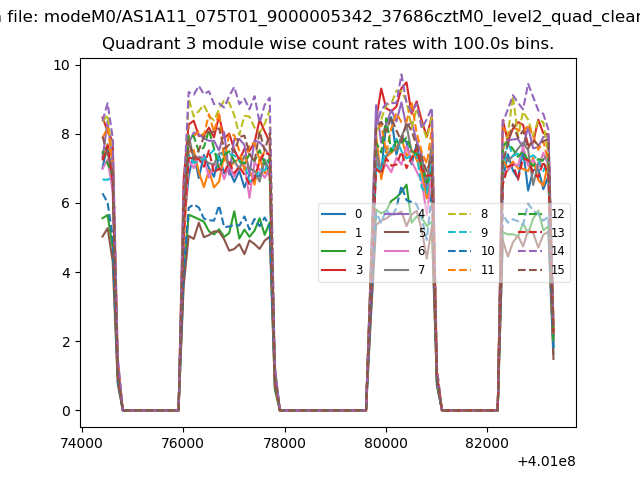
| Module-wise count rates for Quadrant C Data is divided into 100 sec bins |
 |
 |
| Module-wise count rates for Quadrant D Data is divided into 100 sec bins |
 |
 |
| Parameter | Plot |
|---|---|
| CZT HV Monitor |  |
| D_VDD | 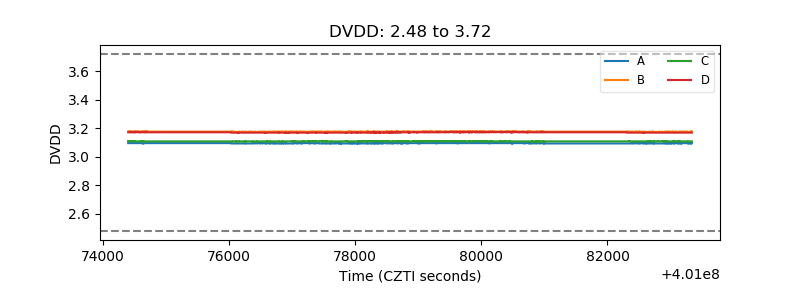 |
| Temperature 1 | 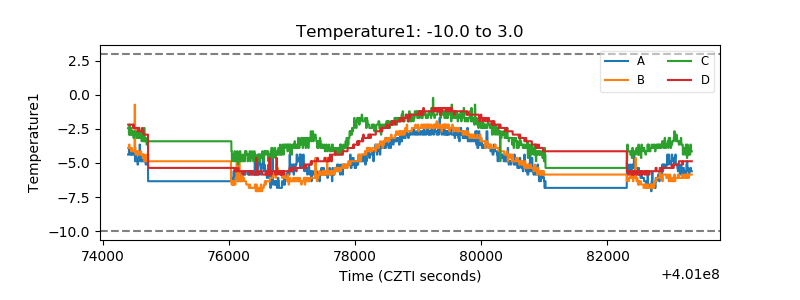 |
| Veto HV Monitor | 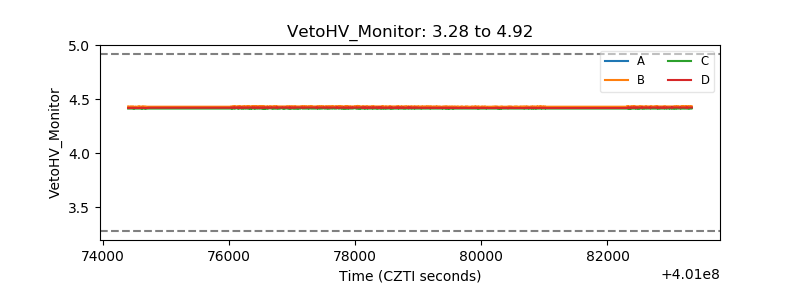 |
| Veto LLD | 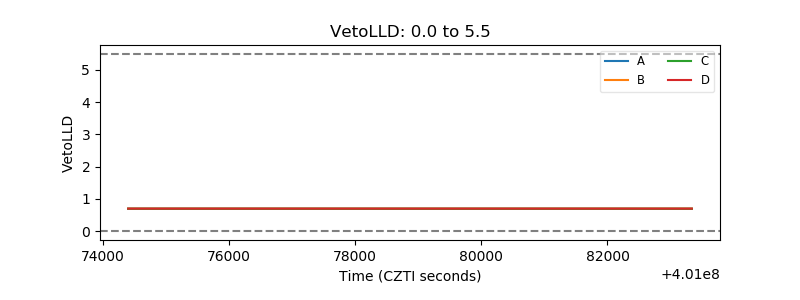 |
| Alpha Counter | 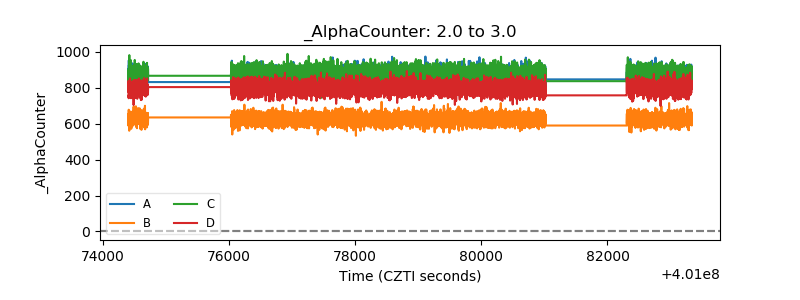 |
| _CPM_Rate | 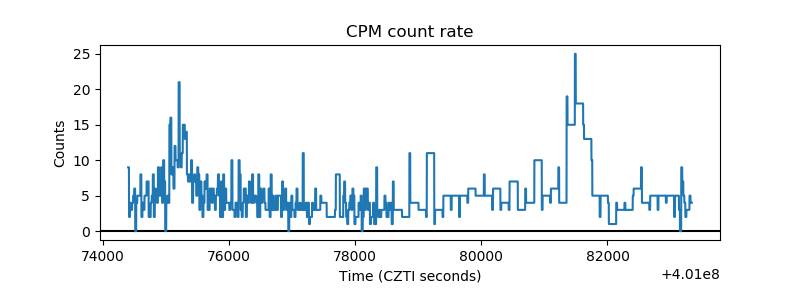 |
| CZT Counter |  |
| +2.5 Volts monitor | 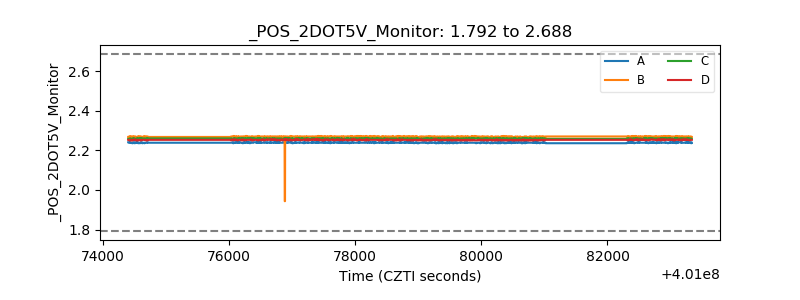 |
| +5 Volts monitor |  |
| _ROLL_ROT | 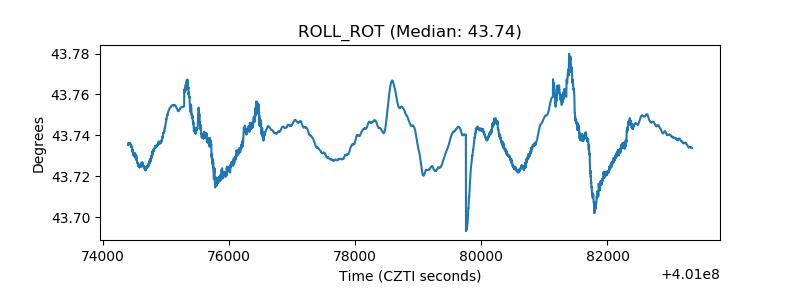 |
| _Roll_DEC | 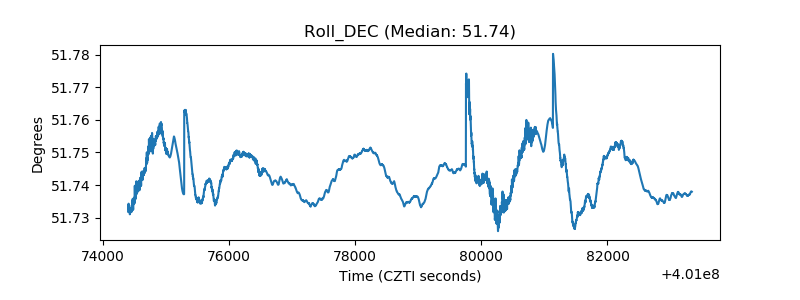 |
| _Roll_RA |  |
| Veto Counter | 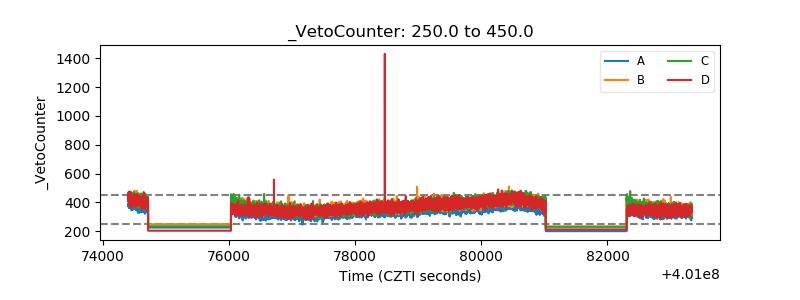 |