| Param | Original file | Final file |
|---|---|---|
| Filename | modeM0/AS1A11_075T01_9000005342_37688cztM0_level2.evt | modeM0/AS1A11_075T01_9000005342_37688cztM0_level2_quad_clean.evt |
| Size (bytes) | 815,207,040 | 128,036,160 |
| Size | 777.4 MB | 122.1 MB |
| Events in quadrant A | 6,445,880 | 777,511 |
| Events in quadrant B | 6,182,159 | 797,842 |
| Events in quadrant C | 5,326,519 | 802,443 |
| Events in quadrant D | 6,012,413 | 761,200 |
| Mode SS | |||
|---|---|---|---|
| Quadrant | BADHDUFLAG | Total packets | Discarded packets |
| A | 0 | 218 | 0 |
| B | 0 | 218 | 0 |
| C | 0 | 218 | 0 |
| D | 0 | 218 | 0 |
| Mode M0 | |||
|---|---|---|---|
| Quadrant | BADHDUFLAG | Total packets | Discarded packets |
| A | 0 | 25923 | 4 |
| B | 0 | 25398 | 3 |
| C | 0 | 22266 | 3 |
| D | 0 | 25179 | 3 |
| Mode M9 | |||
|---|---|---|---|
| Quadrant | BADHDUFLAG | Total packets | Discarded packets |
| A | 0 | 38 | 0 |
| B | 0 | 38 | 0 |
| C | 0 | 38 | 0 |
| D | 0 | 39 | 0 |
| Quadrant | Total seconds | Saturated seconds | Saturation percentage |
|---|---|---|---|
| A | 10665 | 30 | 0.281294% |
| B | 10665 | 409 | 3.834974% |
| C | 10665 | 50 | 0.468823% |
| D | 10665 | 225 | 2.109705% |
Noise dominated data is calculated using 1-second bins in cleaned event files. If a bin has >2000 counts, and if more than 50% of those come from <1% of pixels, then it is considered to be noise-dominated and hence unusable.
| Quadrant | # 1 sec bins | Bins with >0 counts | Bins with >2000 counts | High rate bins dominated by noise | Noise dominated (total time) | Noise dominated (detector-on time) | Marked lightcurve |
|---|---|---|---|---|---|---|---|
| A | 13470 | 10667 | 16 | 16 | 0.12% | 0.15% | 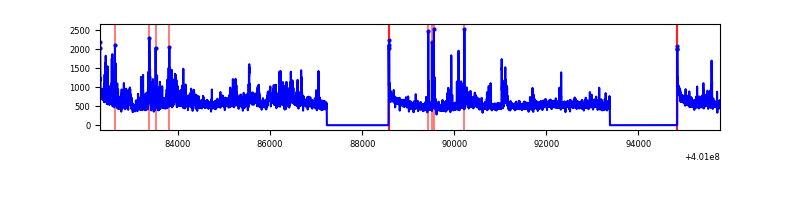 |
| B | 13469 | 10664 | 325 | 325 | 2.41% | 3.05% | 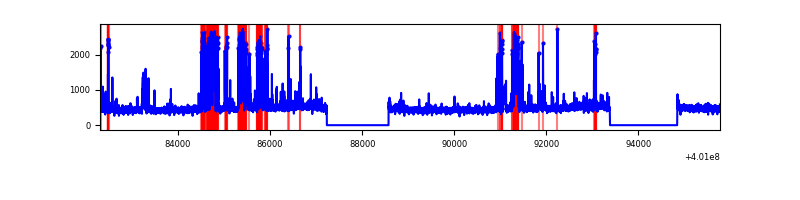 |
| C | 13469 | 10664 | 49 | 49 | 0.36% | 0.46% | 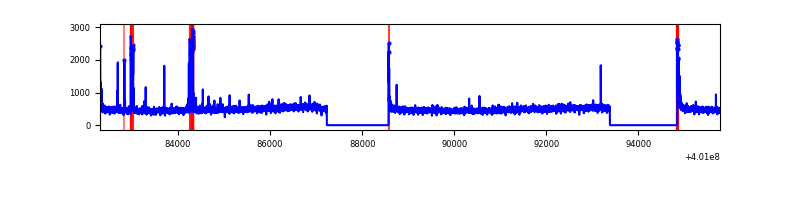 |
| D | 13469 | 10664 | 203 | 203 | 1.51% | 1.90% | 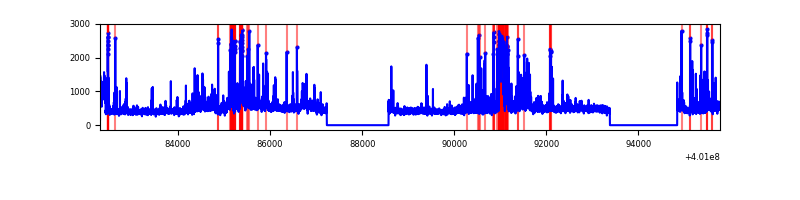 |
Top three noisy pixels from each quadrant. If the there are fewer than three noisy pixels in the level2.evt file, extra rows are filled as -1
| Pixel properties | Quadrant properties | ||||||
|---|---|---|---|---|---|---|---|
| Quadrant | DetID | PixID | Counts | Sigma | Mean | Median | Sigma |
| A | 15 | 222 | 1085327 | 4468.06 | 1208 | 1181 | 242.6 |
| A | 10 | 83 | 555108 | 2282.88 | 1208 | 1181 | 242.6 |
| A | 13 | 248 | 47525 | 190.99 | 1208 | 1181 | 242.6 |
| B | 5 | 255 | 851520 | 3749.7 | 1189 | 1158 | 226.8 |
| B | 5 | 172 | 330972 | 1454.33 | 1189 | 1158 | 226.8 |
| B | 0 | 230 | 92448 | 402.55 | 1189 | 1158 | 226.8 |
| C | 15 | 214 | 453565 | 1643.22 | 1183 | 1188 | 275.3 |
| C | 0 | 10 | 97705 | 350.59 | 1183 | 1188 | 275.3 |
| C | 15 | 159 | 83113 | 297.58 | 1183 | 1188 | 275.3 |
| D | 12 | 227 | 549032 | 1929.71 | 1175 | 1142 | 283.9 |
| D | 13 | 249 | 292489 | 1026.15 | 1175 | 1142 | 283.9 |
| D | 2 | 153 | 277223 | 972.38 | 1175 | 1142 | 283.9 |
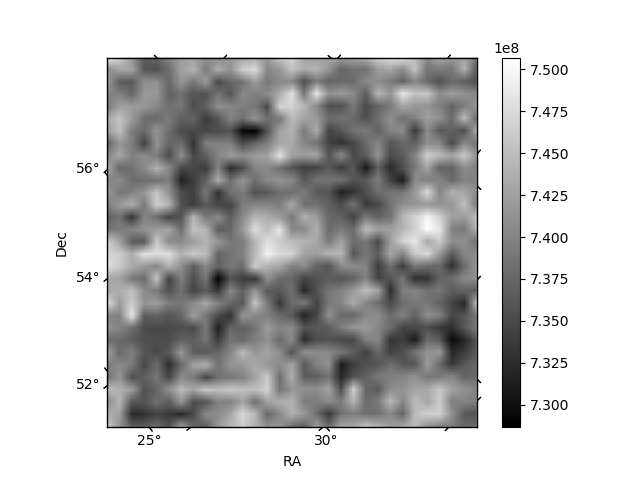
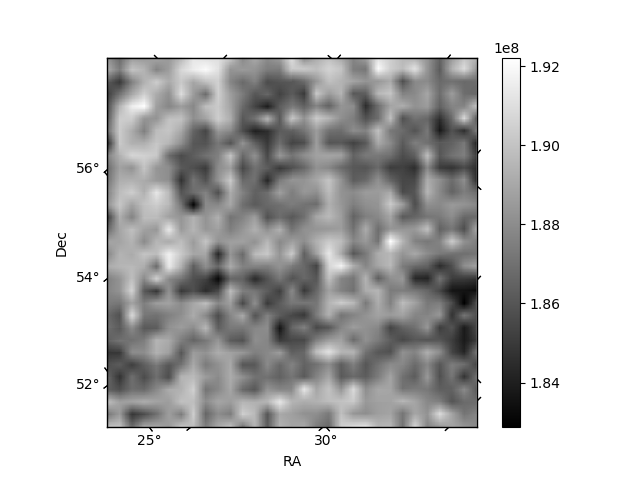
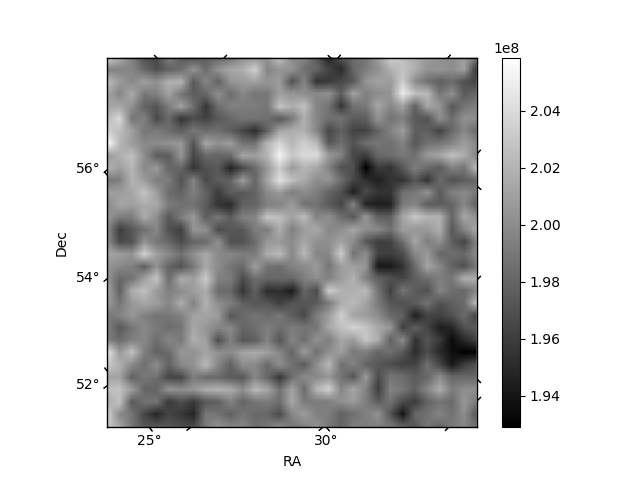
Histogram calculated using DETX and DETY for each event in the final _common_clean file
| Quadrant A | 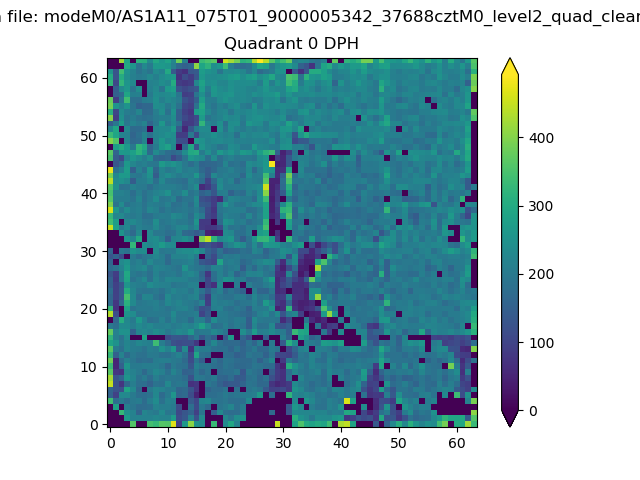 |
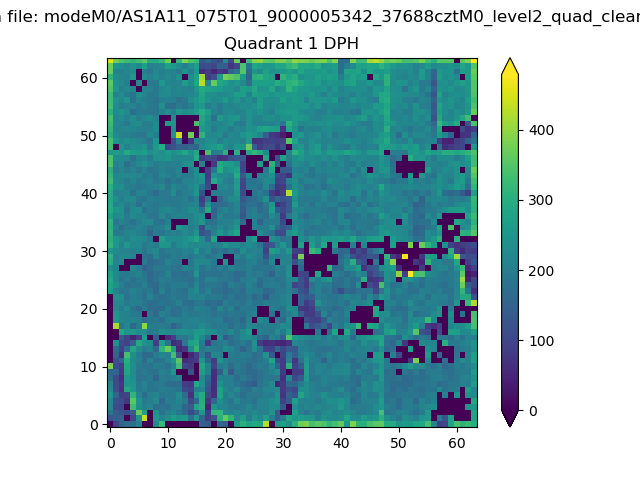 |
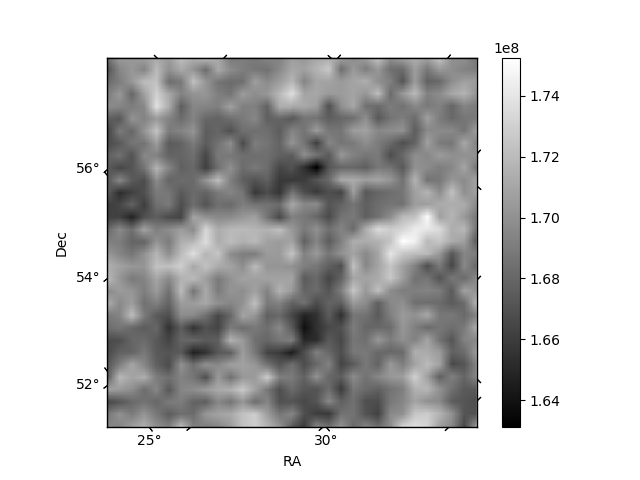
Quadrant B |
|---|---|---|---|
| Quadrant D |  |
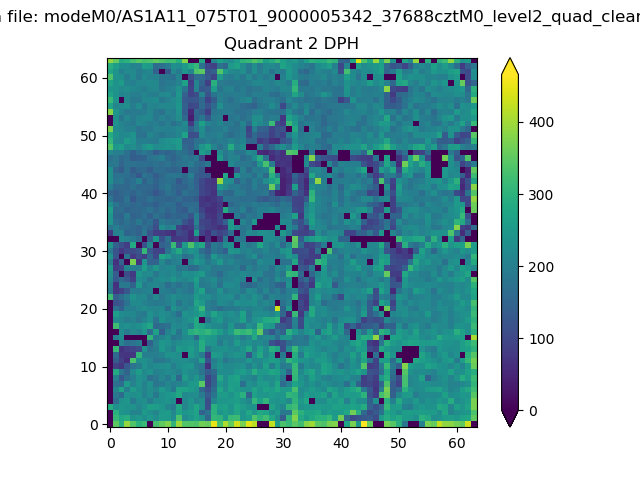 |
Quadrant C |
| Plot type | Count rate plots | Images |
|---|---|---|
| Comparison with Poisson distribution Blue bars denote a histogram of data divided into 1 sec bins. Red curve is a Poisson curve with rate = median count rate of data. |
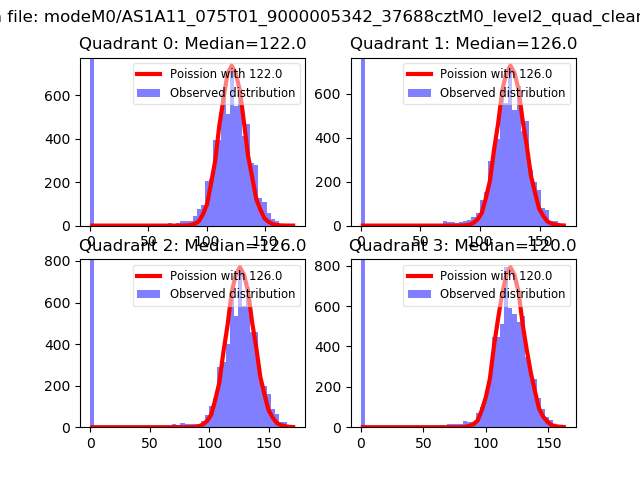 |
 |
| Quadrant-wise count rates Data is divided into 100 sec bins |
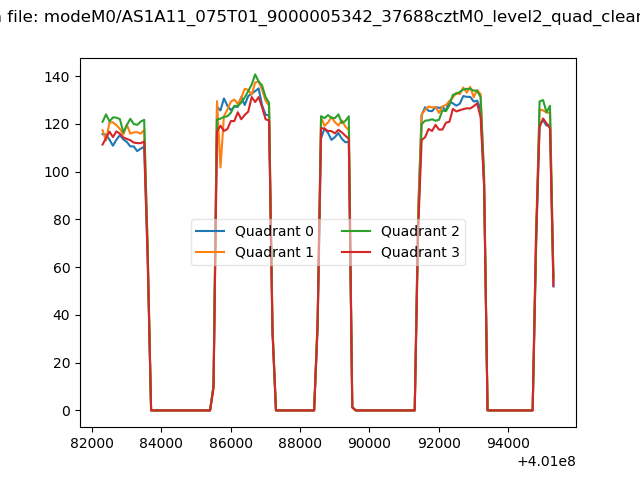 |
|
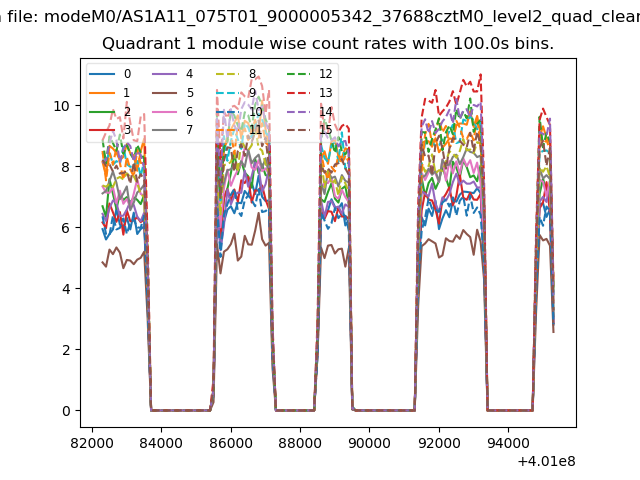
| Module-wise count rates for Quadrant A Data is divided into 100 sec bins |
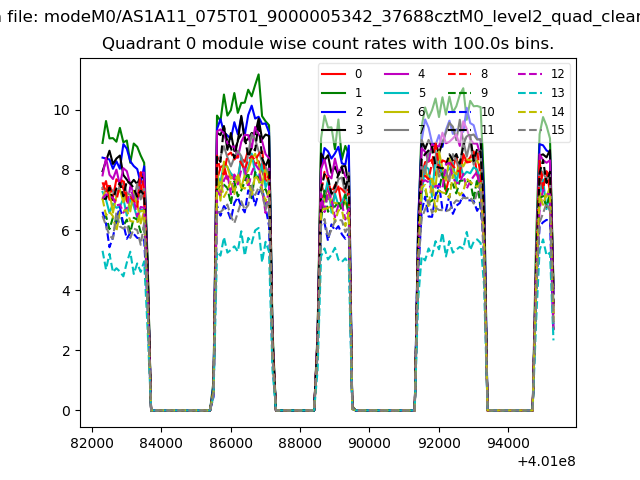 |
 |
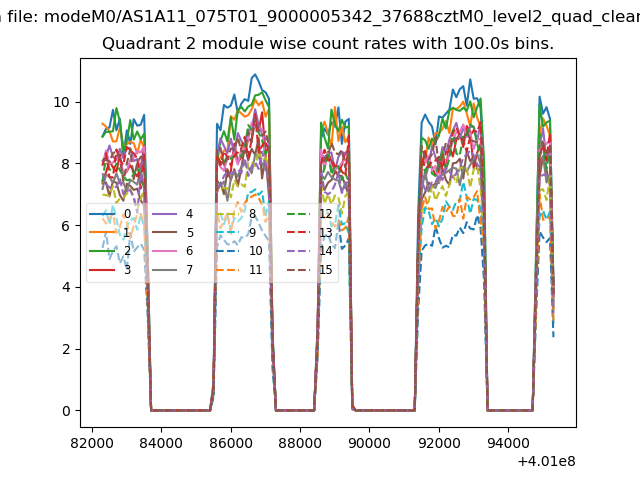
| Module-wise count rates for Quadrant B Data is divided into 100 sec bins |
 |
 |
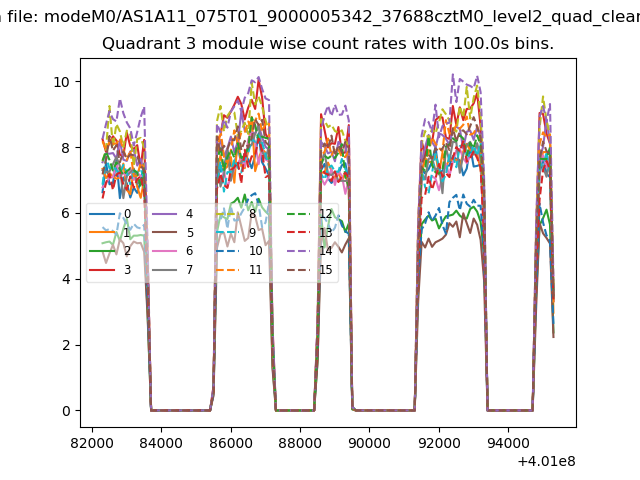
| Module-wise count rates for Quadrant C Data is divided into 100 sec bins |
 |
 |
| Module-wise count rates for Quadrant D Data is divided into 100 sec bins |
 |
 |
| Parameter | Plot |
|---|---|
| CZT HV Monitor | 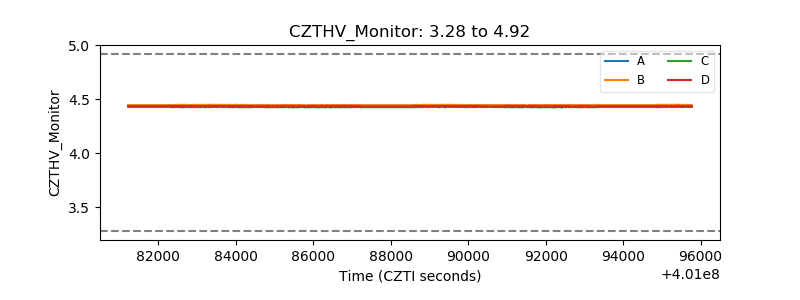 |
| D_VDD | 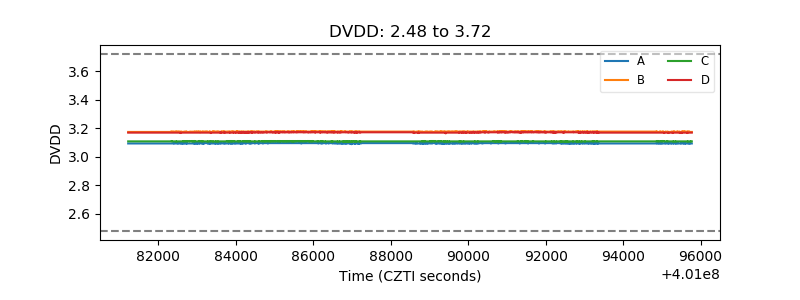 |
| Temperature 1 | 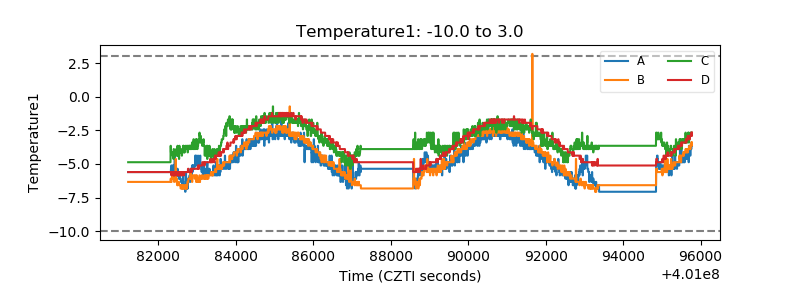 |
| Veto HV Monitor |  |
| Veto LLD | 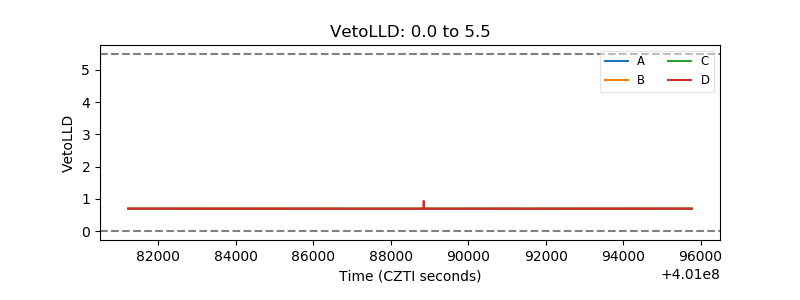 |
| Alpha Counter | 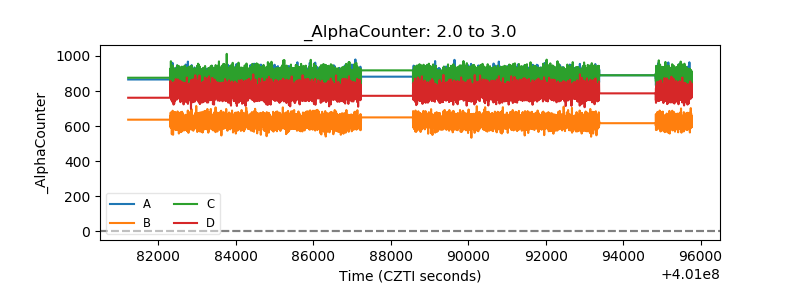 |
| _CPM_Rate | 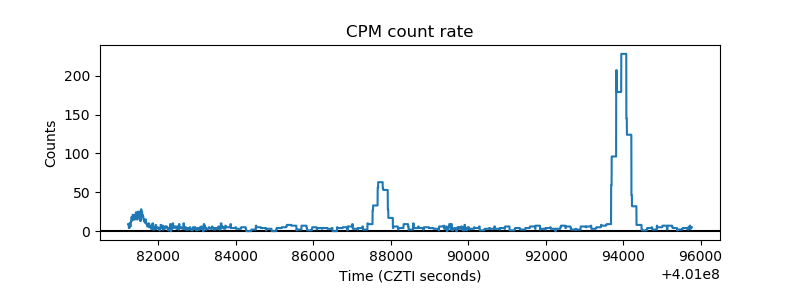 |
| CZT Counter | 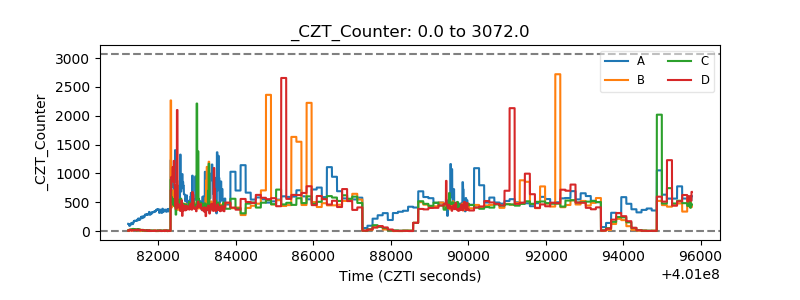 |
| +2.5 Volts monitor | 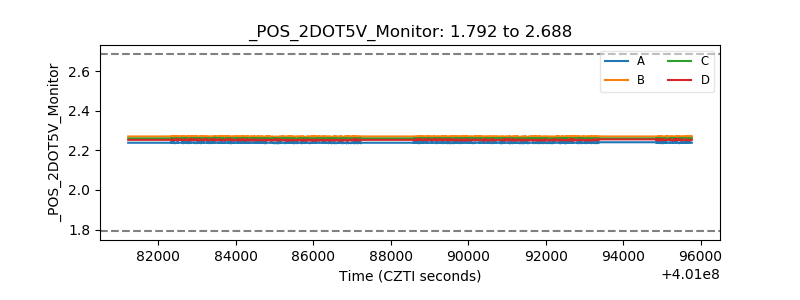 |
| +5 Volts monitor | 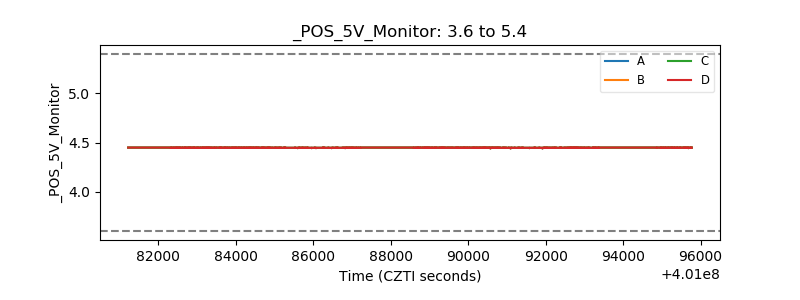 |
| _ROLL_ROT | 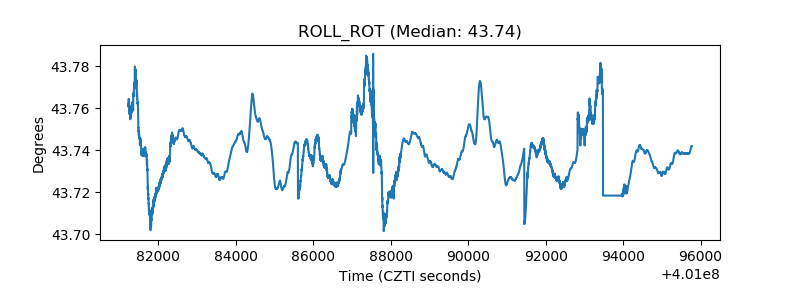 |
| _Roll_DEC | 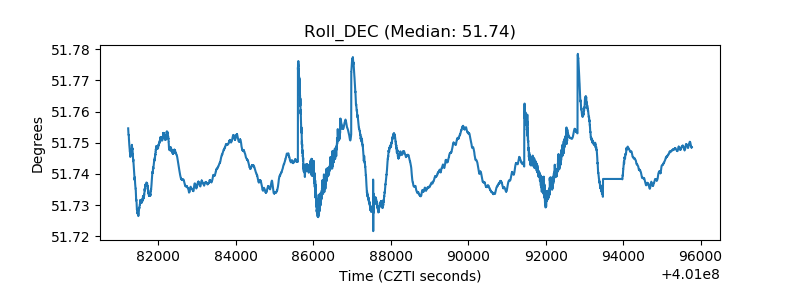 |
| _Roll_RA | 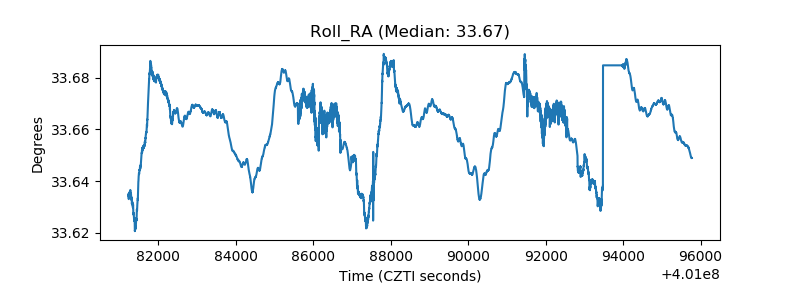 |
| Veto Counter | 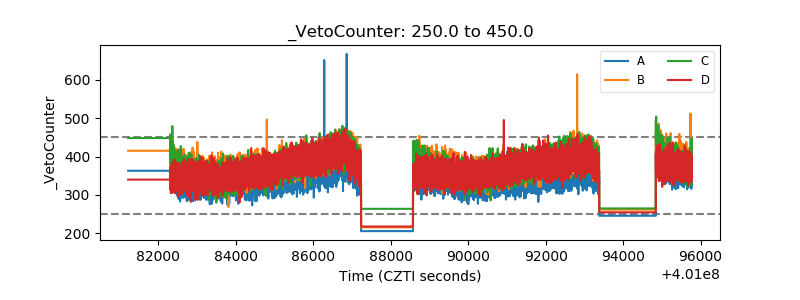 |