| Param | Original file | Final file |
|---|---|---|
| Filename | modeM0/AS1A11_075T01_9000005342_37690cztM0_level2.evt | modeM0/AS1A11_075T01_9000005342_37690cztM0_level2_quad_clean.evt |
| Size (bytes) | 752,140,800 | 53,136,000 |
| Size | 717.3 MB | 50.7 MB |
| Events in quadrant A | 8,813,259 | 272,525 |
| Events in quadrant B | 3,264,755 | 337,870 |
| Events in quadrant C | 2,863,964 | 334,051 |
| Events in quadrant D | 7,459,495 | 272,362 |
| Mode SS | |||
|---|---|---|---|
| Quadrant | BADHDUFLAG | Total packets | Discarded packets |
| A | 0 | 114 | 0 |
| B | 0 | 114 | 0 |
| C | 0 | 114 | 0 |
| D | 0 | 114 | 0 |
| Mode M0 | |||
|---|---|---|---|
| Quadrant | BADHDUFLAG | Total packets | Discarded packets |
| A | 0 | 30035 | 3 |
| B | 0 | 13131 | 2 |
| C | 0 | 11718 | 2 |
| D | 0 | 25927 | 2 |
| Mode M9 | |||
|---|---|---|---|
| Quadrant | BADHDUFLAG | Total packets | Discarded packets |
| A | 0 | 27 | 0 |
| B | 0 | 27 | 0 |
| C | 0 | 27 | 0 |
| D | 0 | 28 | 0 |
| Quadrant | Total seconds | Saturated seconds | Saturation percentage |
|---|---|---|---|
| A | 5587 | 2316 | 41.453374% |
| B | 5587 | 180 | 3.221765% |
| C | 5587 | 29 | 0.519062% |
| D | 5587 | 1491 | 26.686952% |
Noise dominated data is calculated using 1-second bins in cleaned event files. If a bin has >2000 counts, and if more than 50% of those come from <1% of pixels, then it is considered to be noise-dominated and hence unusable.
| Quadrant | # 1 sec bins | Bins with >0 counts | Bins with >2000 counts | High rate bins dominated by noise | Noise dominated (total time) | Noise dominated (detector-on time) | Marked lightcurve |
|---|---|---|---|---|---|---|---|
| A | 7291 | 5588 | 2200 | 2200 | 30.17% | 39.37% | 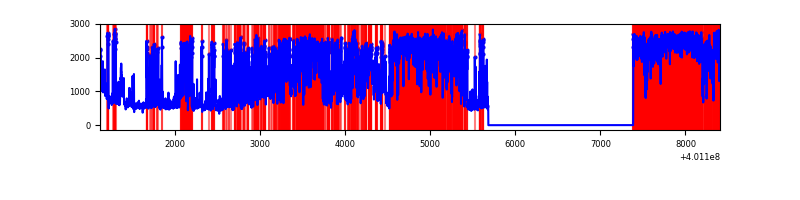 |
| B | 7290 | 5586 | 146 | 146 | 2.00% | 2.61% | 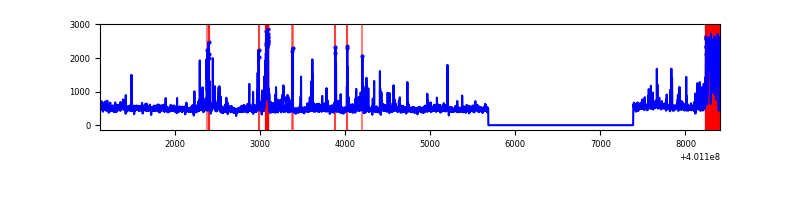 |
| C | 7290 | 5586 | 25 | 25 | 0.34% | 0.45% | 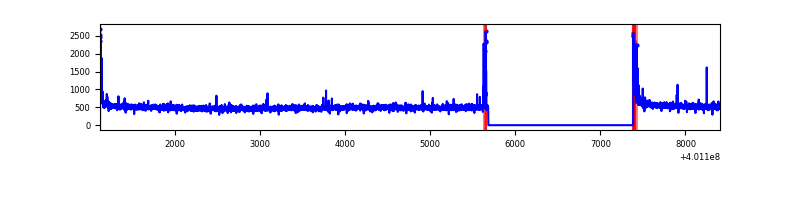 |
| D | 7290 | 5586 | 1692 | 1692 | 23.21% | 30.29% | 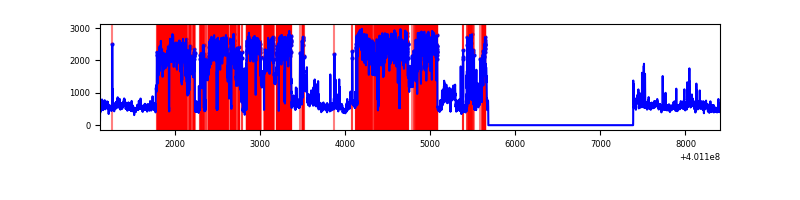 |
Top three noisy pixels from each quadrant. If the there are fewer than three noisy pixels in the level2.evt file, extra rows are filled as -1
| Pixel properties | Quadrant properties | ||||||
|---|---|---|---|---|---|---|---|
| Quadrant | DetID | PixID | Counts | Sigma | Mean | Median | Sigma |
| A | 15 | 222 | 6412277 | 59651.73 | 534 | 524 | 107.5 |
| A | 10 | 83 | 263513 | 2446.72 | 534 | 524 | 107.5 |
| A | 13 | 248 | 49975 | 460.07 | 534 | 524 | 107.5 |
| B | 5 | 255 | 288534 | 2322.33 | 648 | 631 | 124.0 |
| B | 5 | 172 | 243595 | 1959.83 | 648 | 631 | 124.0 |
| B | 0 | 230 | 59410 | 474.13 | 648 | 631 | 124.0 |
| C | 15 | 214 | 240310 | 1606.22 | 642 | 648 | 149.2 |
| C | 0 | 10 | 79763 | 530.23 | 642 | 648 | 149.2 |
| C | 14 | 254 | 39334 | 259.27 | 642 | 648 | 149.2 |
| D | 12 | 227 | 4872442 | 33864.29 | 594 | 578 | 143.9 |
| D | 13 | 249 | 89791 | 620.12 | 594 | 578 | 143.9 |
| D | 2 | 249 | 79217 | 546.62 | 594 | 578 | 143.9 |
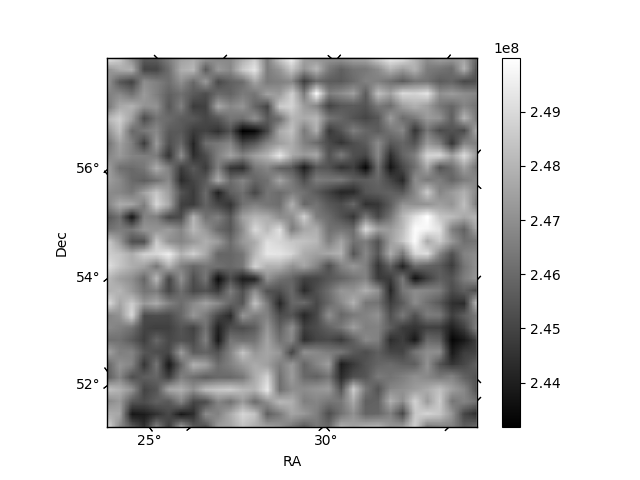
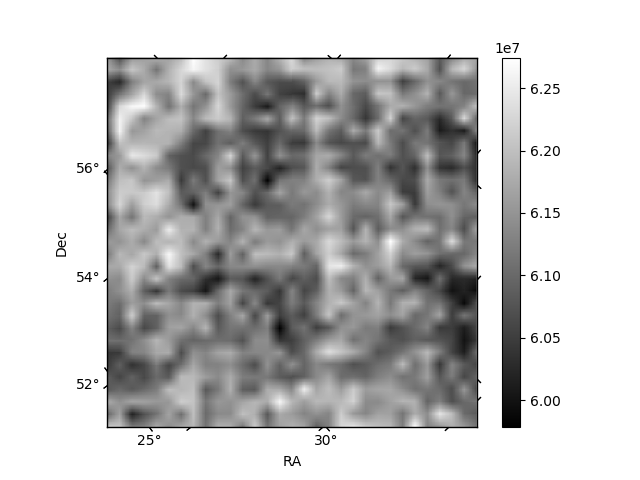
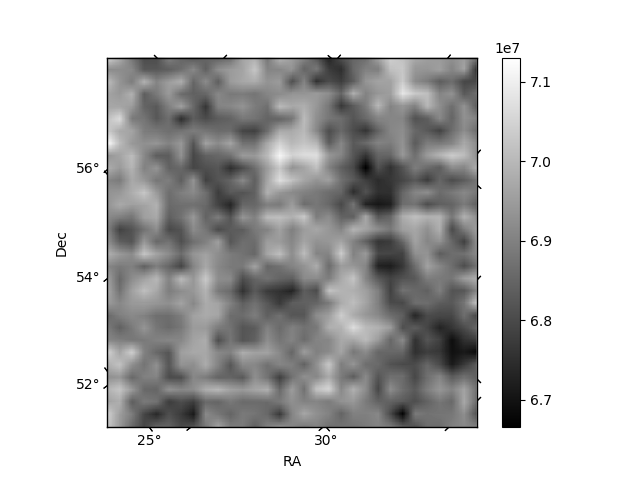
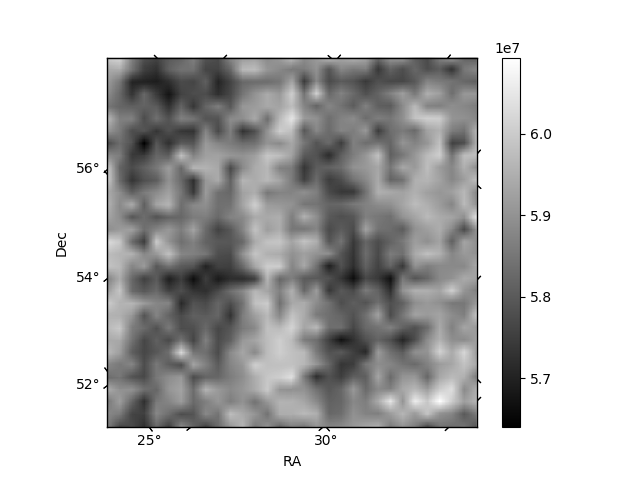
Histogram calculated using DETX and DETY for each event in the final _common_clean file
| Quadrant A | 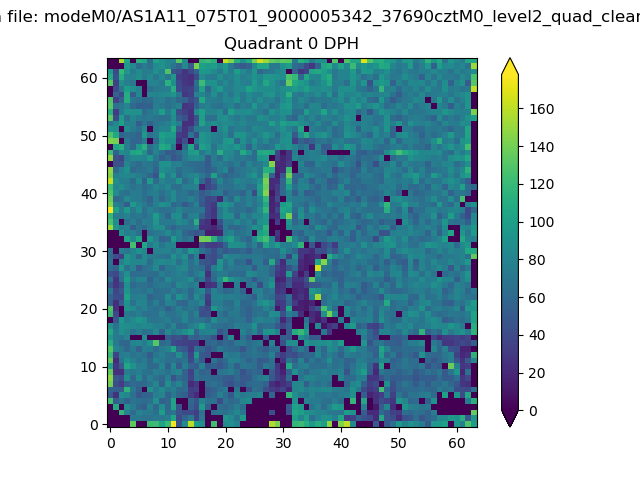 |
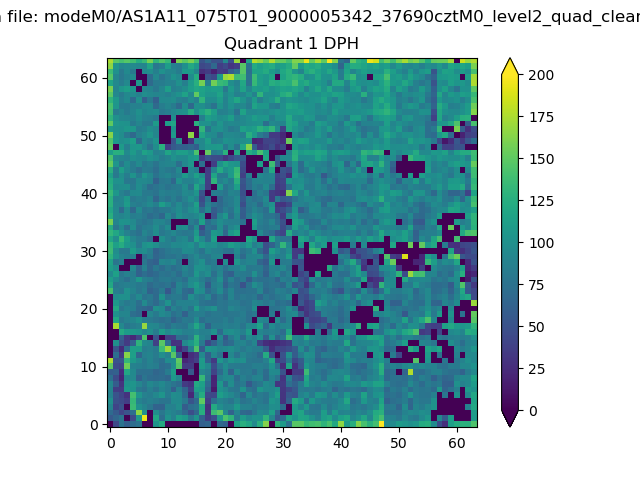 |
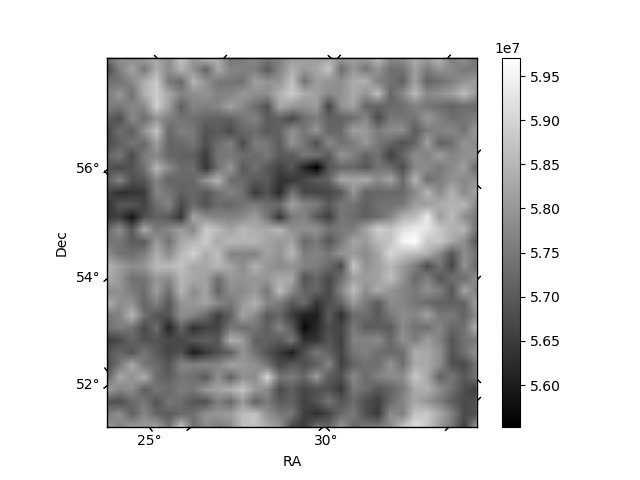
Quadrant B |
|---|---|---|---|
| Quadrant D | 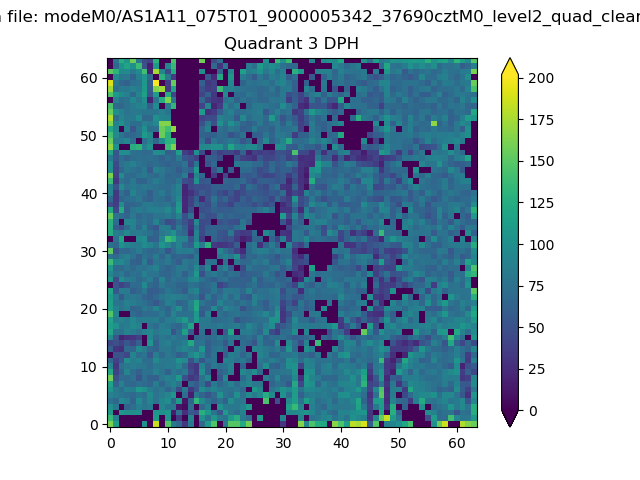 |
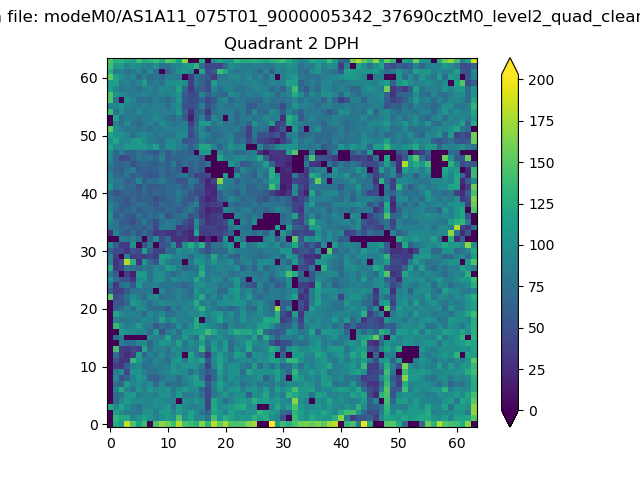 |
Quadrant C |
| Plot type | Count rate plots | Images |
|---|---|---|
| Comparison with Poisson distribution Blue bars denote a histogram of data divided into 1 sec bins. Red curve is a Poisson curve with rate = median count rate of data. |
 |
 |
| Quadrant-wise count rates Data is divided into 100 sec bins |
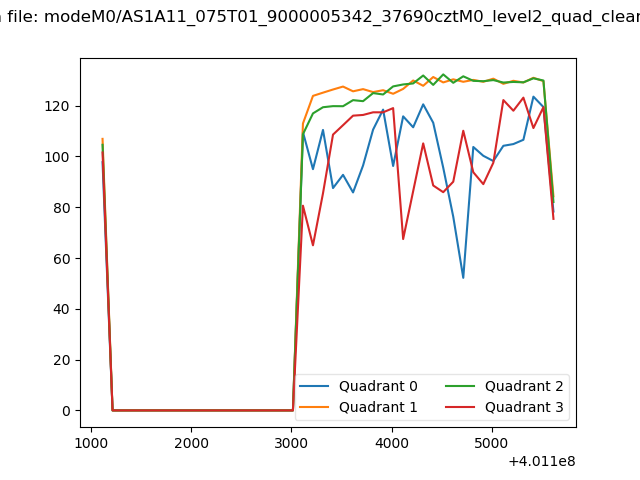 |
|
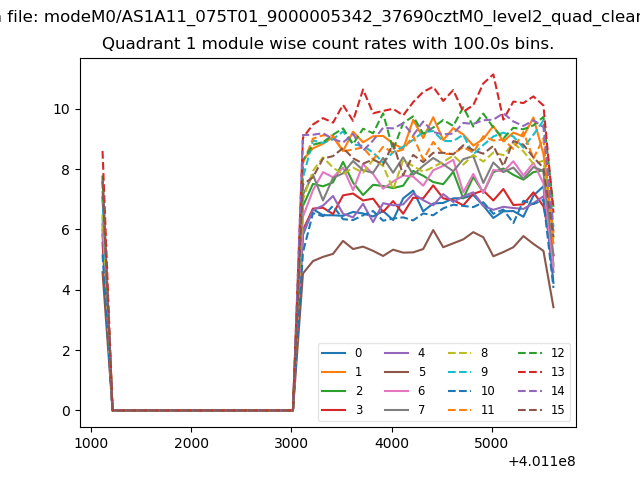
| Module-wise count rates for Quadrant A Data is divided into 100 sec bins |
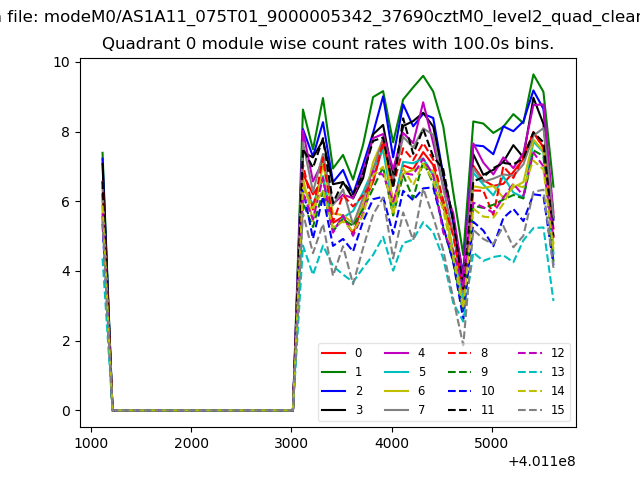 |
 |
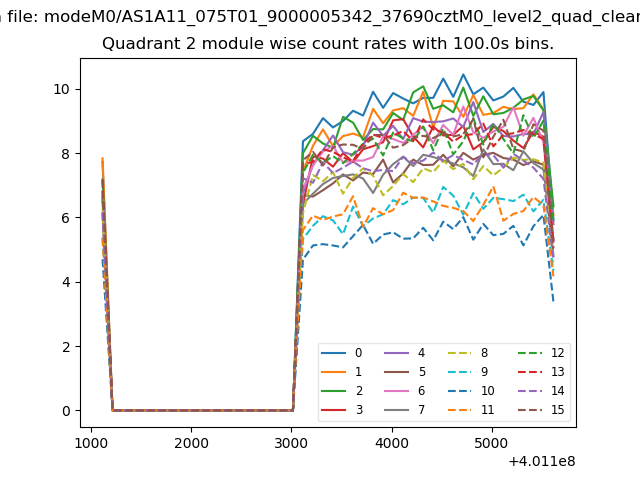
| Module-wise count rates for Quadrant B Data is divided into 100 sec bins |
 |
 |
| Module-wise count rates for Quadrant C Data is divided into 100 sec bins |
 |
 |
| Module-wise count rates for Quadrant D Data is divided into 100 sec bins |
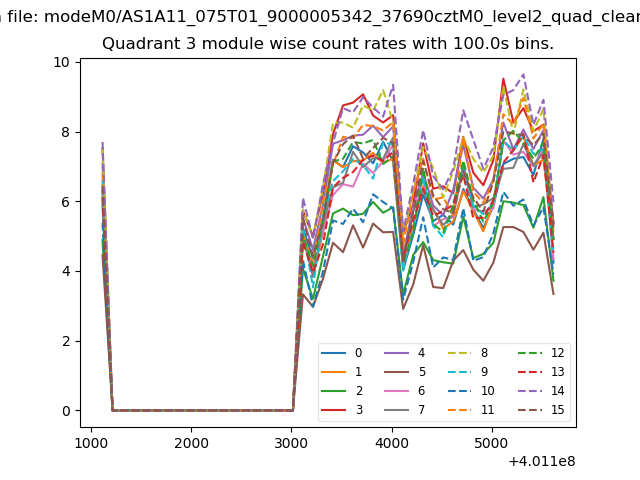 |
 |
| Parameter | Plot |
|---|---|
| CZT HV Monitor | 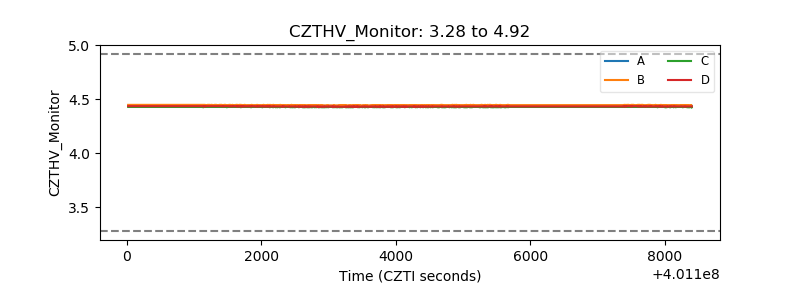 |
| D_VDD | 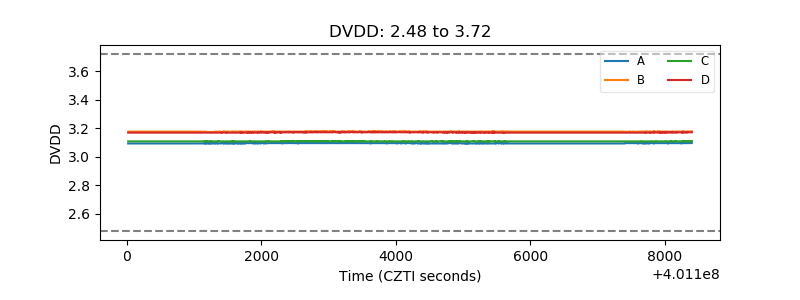 |
| Temperature 1 | 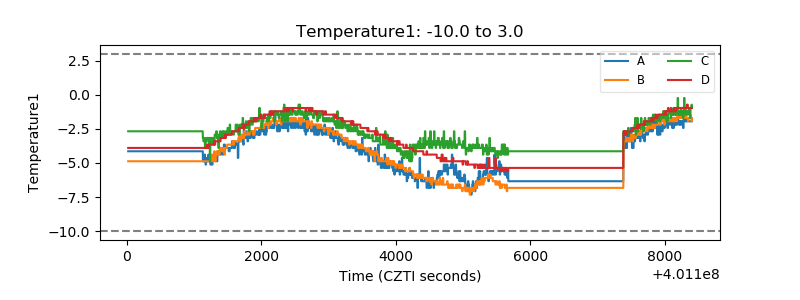 |
| Veto HV Monitor | 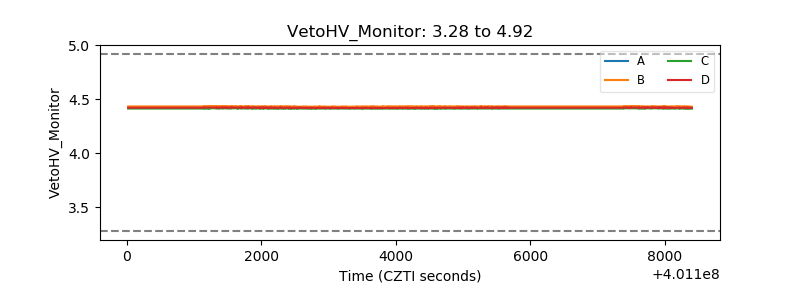 |
| Veto LLD | 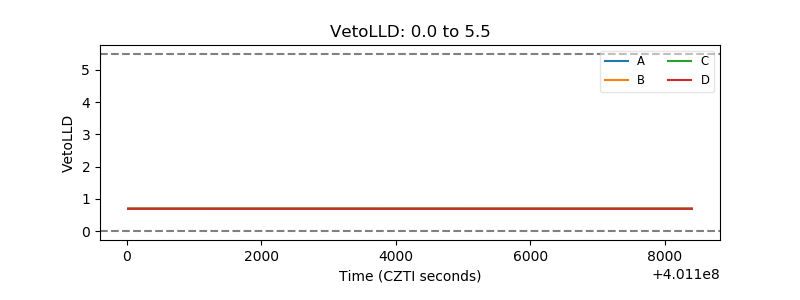 |
| Alpha Counter | 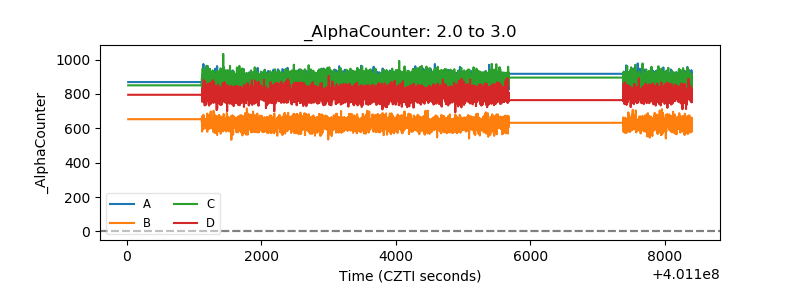 |
| _CPM_Rate | 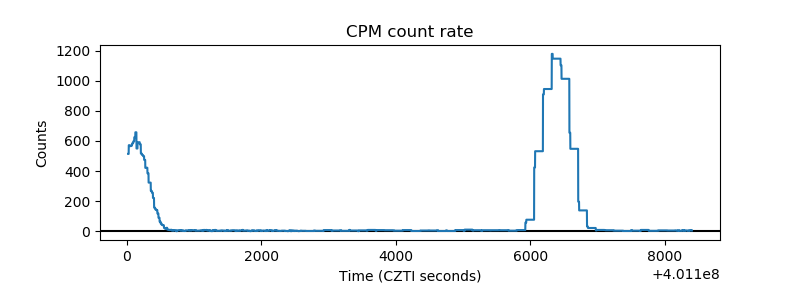 |
| CZT Counter | 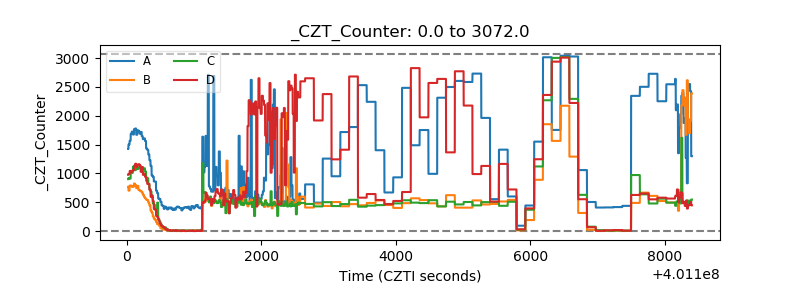 |
| +2.5 Volts monitor | 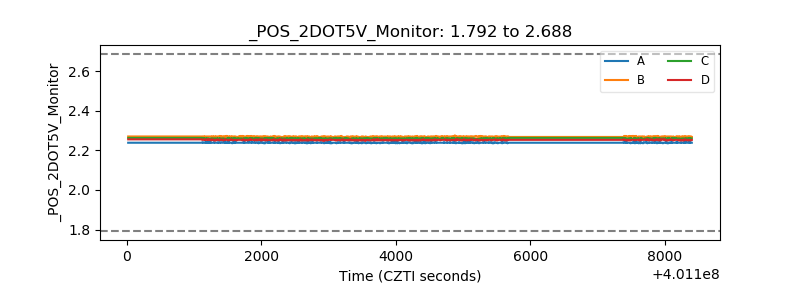 |
| +5 Volts monitor |  |
| _ROLL_ROT | 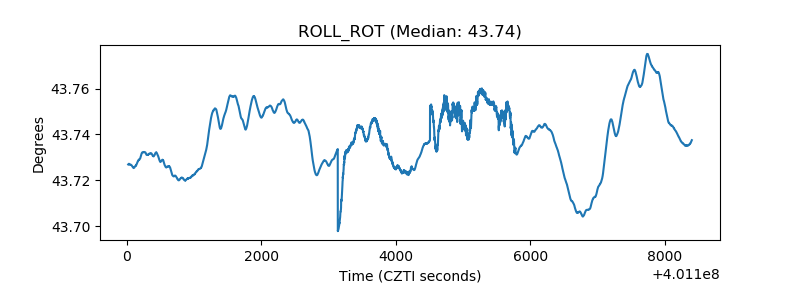 |
| _Roll_DEC | 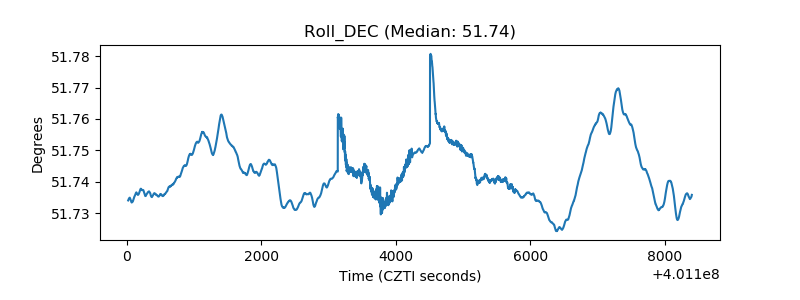 |
| _Roll_RA | 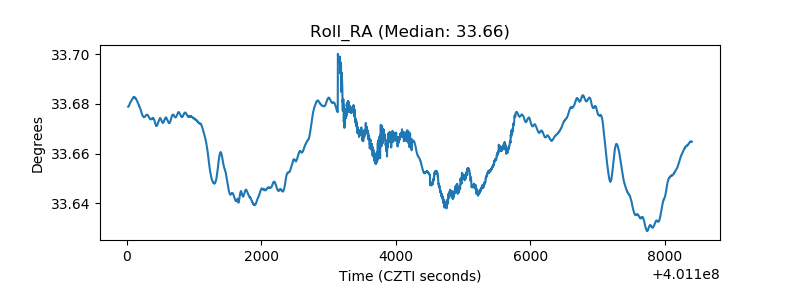 |
| Veto Counter | 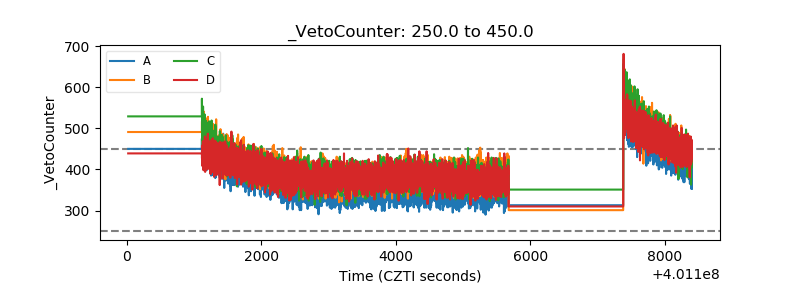 |