| Param | Original file | Final file |
|---|---|---|
| Filename | modeM0/AS1A11_075T01_9000005342_37692cztM0_level2.evt | modeM0/AS1A11_075T01_9000005342_37692cztM0_level2_quad_clean.evt |
| Size (bytes) | 653,005,440 | 58,688,640 |
| Size | 622.8 MB | 56.0 MB |
| Events in quadrant A | 9,719,486 | 301,620 |
| Events in quadrant B | 3,412,029 | 375,939 |
| Events in quadrant C | 2,858,819 | 372,362 |
| Events in quadrant D | 3,423,983 | 351,989 |
| Mode SS | |||
|---|---|---|---|
| Quadrant | BADHDUFLAG | Total packets | Discarded packets |
| A | 0 | 108 | 0 |
| B | 0 | 108 | 0 |
| C | 0 | 108 | 0 |
| D | 0 | 108 | 0 |
| Mode M0 | |||
|---|---|---|---|
| Quadrant | BADHDUFLAG | Total packets | Discarded packets |
| A | 0 | 32518 | 3 |
| B | 0 | 13449 | 2 |
| C | 0 | 11539 | 2 |
| D | 0 | 13769 | 2 |
| Mode M9 | |||
|---|---|---|---|
| Quadrant | BADHDUFLAG | Total packets | Discarded packets |
| A | 0 | 24 | 0 |
| B | 0 | 24 | 0 |
| C | 0 | 24 | 0 |
| D | 0 | 25 | 0 |
| Quadrant | Total seconds | Saturated seconds | Saturation percentage |
|---|---|---|---|
| A | 5350 | 3075 | 57.476636% |
| B | 5350 | 280 | 5.233645% |
| C | 5350 | 25 | 0.467290% |
| D | 5350 | 65 | 1.214953% |
Noise dominated data is calculated using 1-second bins in cleaned event files. If a bin has >2000 counts, and if more than 50% of those come from <1% of pixels, then it is considered to be noise-dominated and hence unusable.
| Quadrant | # 1 sec bins | Bins with >0 counts | Bins with >2000 counts | High rate bins dominated by noise | Noise dominated (total time) | Noise dominated (detector-on time) | Marked lightcurve |
|---|---|---|---|---|---|---|---|
| A | 7202 | 5351 | 2879 | 2879 | 39.98% | 53.80% | 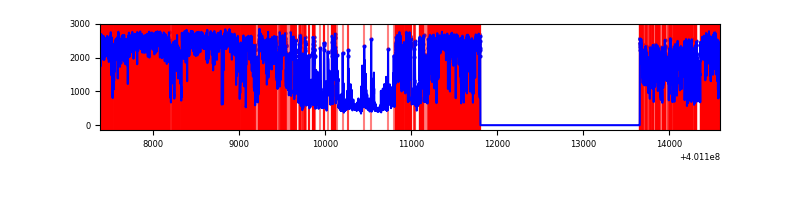 |
| B | 7201 | 5349 | 231 | 231 | 3.21% | 4.32% | 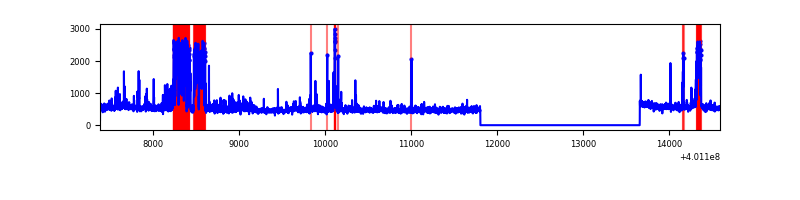 |
| C | 7201 | 5349 | 21 | 21 | 0.29% | 0.39% | 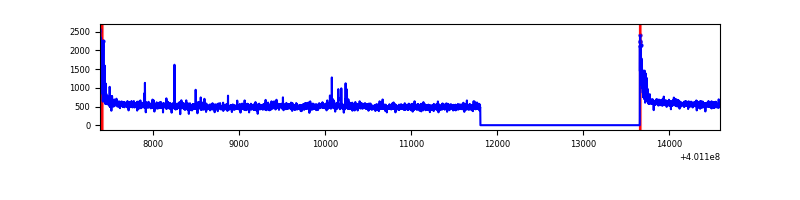 |
| D | 7201 | 5349 | 53 | 53 | 0.74% | 0.99% | 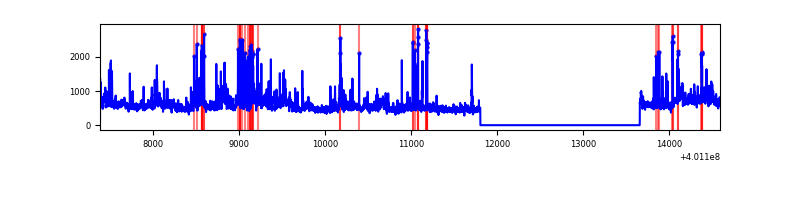 |
Top three noisy pixels from each quadrant. If the there are fewer than three noisy pixels in the level2.evt file, extra rows are filled as -1
| Pixel properties | Quadrant properties | ||||||
|---|---|---|---|---|---|---|---|
| Quadrant | DetID | PixID | Counts | Sigma | Mean | Median | Sigma |
| A | 15 | 222 | 7636651 | 80543.92 | 470 | 462 | 94.8 |
| A | 10 | 83 | 235554 | 2479.67 | 470 | 462 | 94.8 |
| A | 13 | 248 | 15784 | 161.61 | 470 | 462 | 94.8 |
| B | 5 | 255 | 495711 | 4085.29 | 641 | 625 | 121.2 |
| B | 5 | 172 | 202575 | 1666.43 | 641 | 625 | 121.2 |
| B | 0 | 230 | 51829 | 422.52 | 641 | 625 | 121.2 |
| C | 15 | 214 | 228189 | 1539.7 | 639 | 645 | 147.8 |
| C | 0 | 10 | 99389 | 668.16 | 639 | 645 | 147.8 |
| C | 14 | 254 | 31876 | 211.33 | 639 | 645 | 147.8 |
| D | 12 | 227 | 470635 | 3057.99 | 639 | 621 | 153.7 |
| D | 13 | 249 | 139160 | 901.36 | 639 | 621 | 153.7 |
| D | 5 | 222 | 137239 | 888.86 | 639 | 621 | 153.7 |
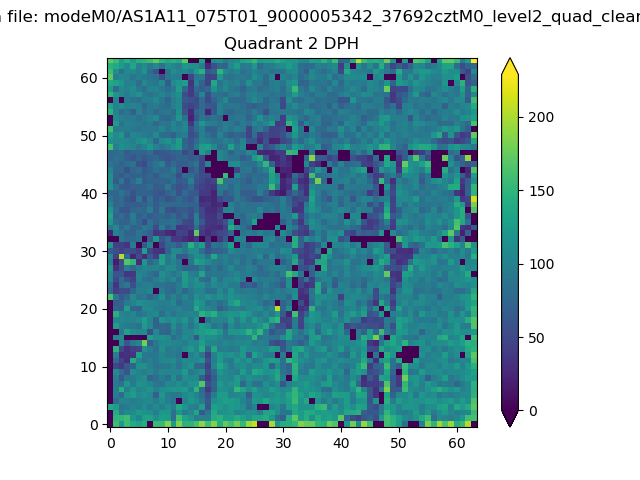
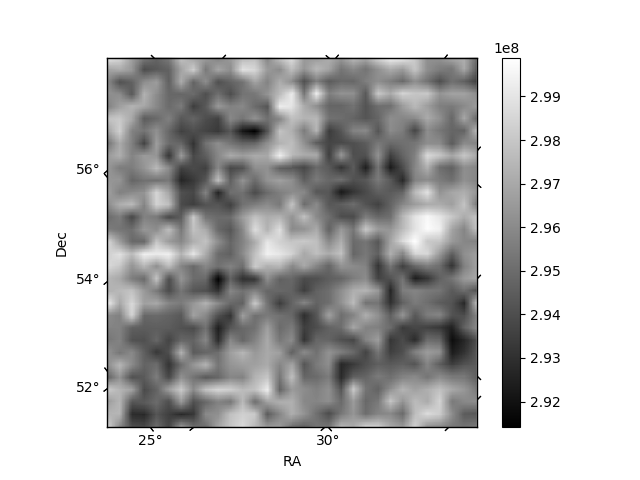
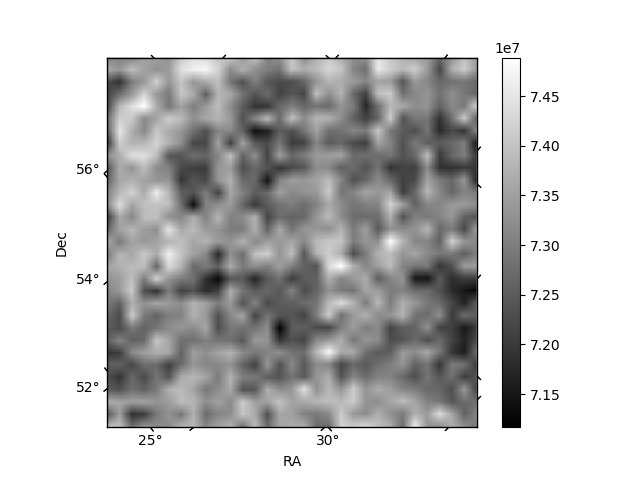
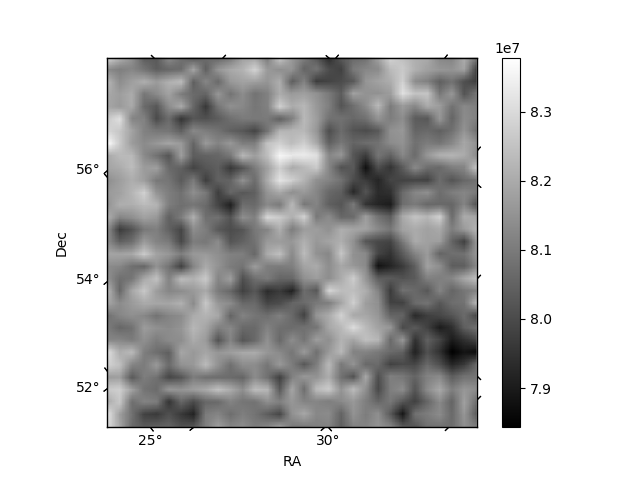
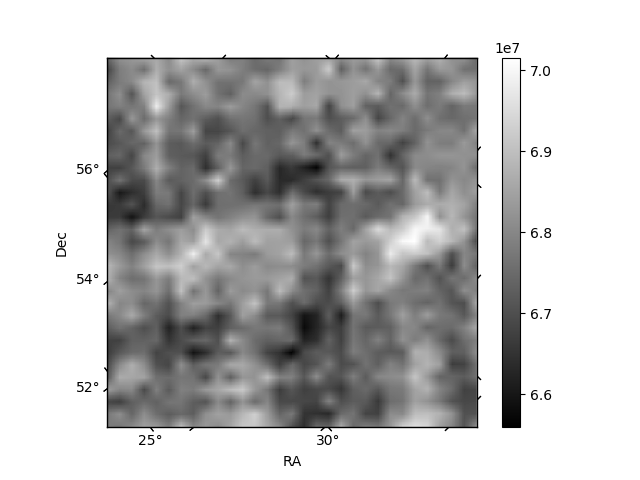
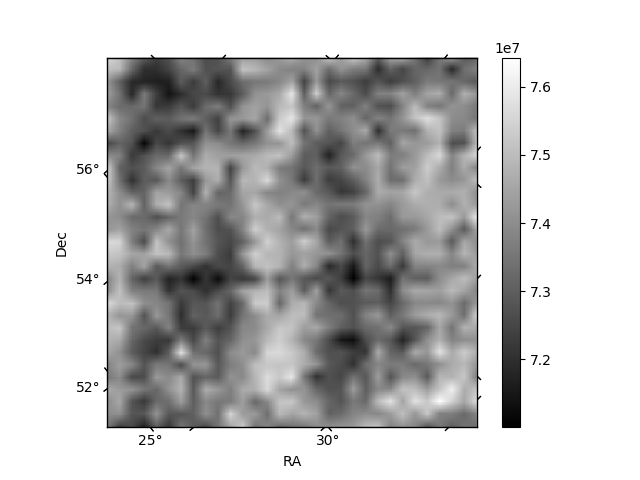
Histogram calculated using DETX and DETY for each event in the final _common_clean file
| Quadrant A | 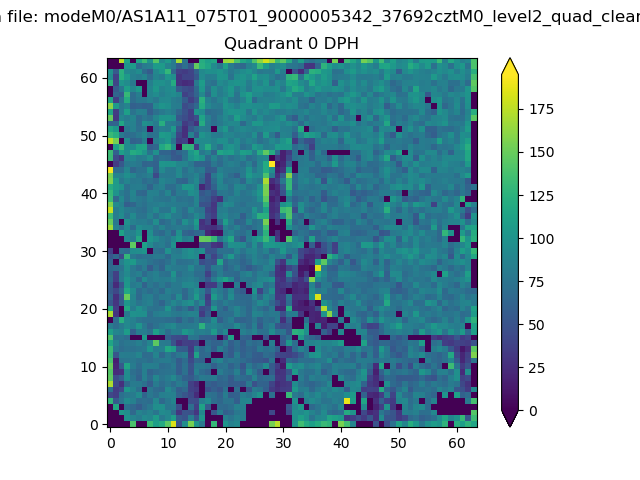 |
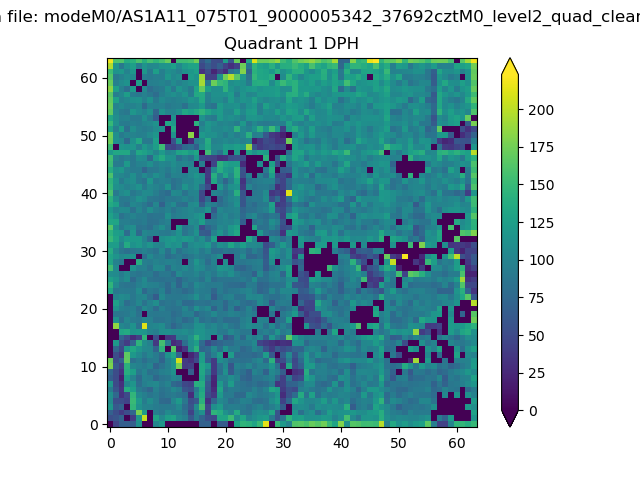 |
Quadrant B |
|---|---|---|---|
| Quadrant D | 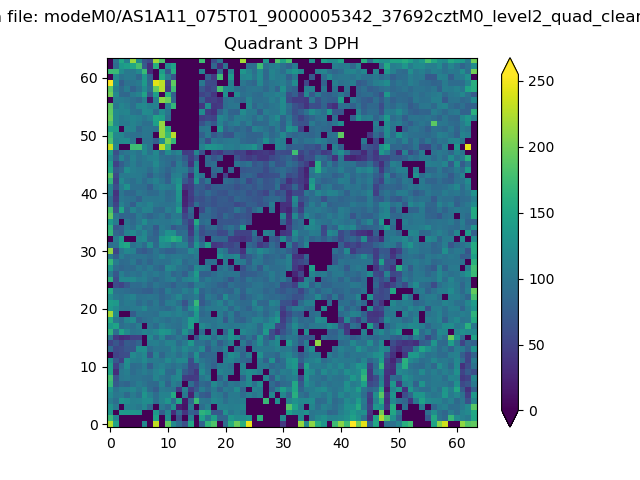 |
 |
Quadrant C |
| Plot type | Count rate plots | Images |
|---|---|---|
| Comparison with Poisson distribution Blue bars denote a histogram of data divided into 1 sec bins. Red curve is a Poisson curve with rate = median count rate of data. |
 |
 |
| Quadrant-wise count rates Data is divided into 100 sec bins |
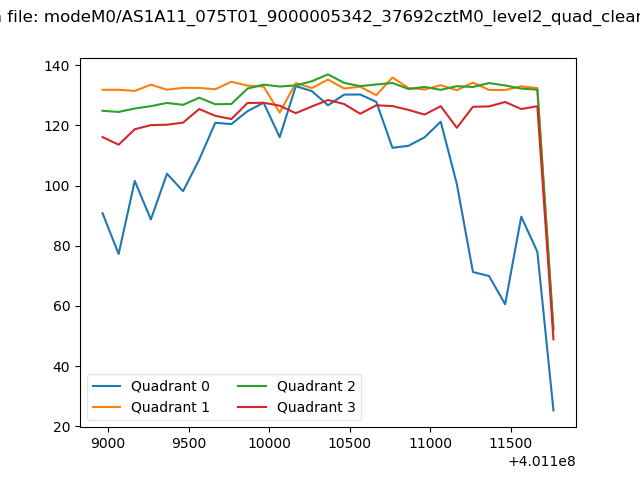 |
|
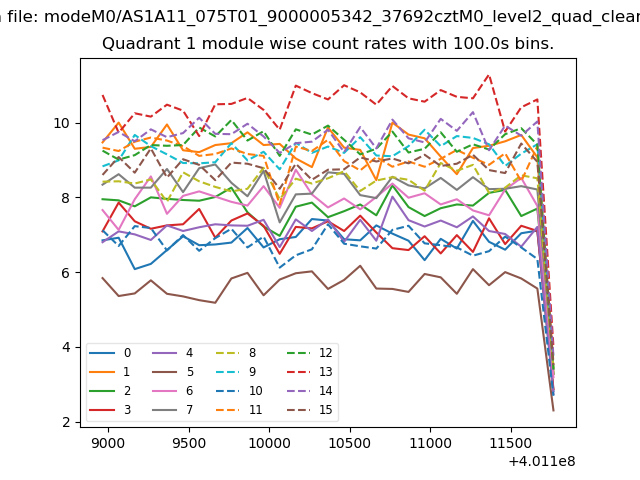
| Module-wise count rates for Quadrant A Data is divided into 100 sec bins |
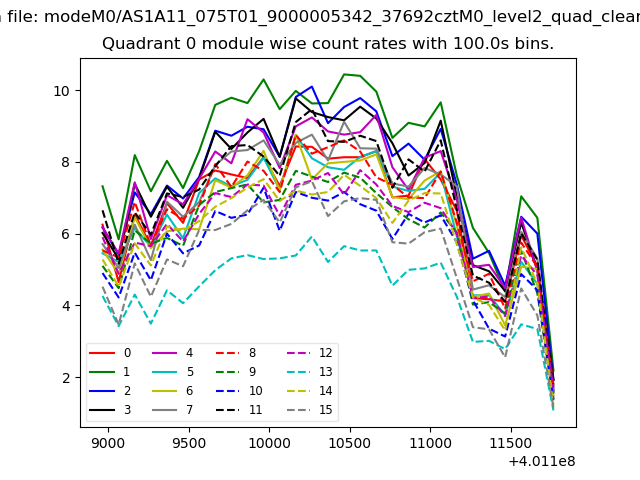 |
 |
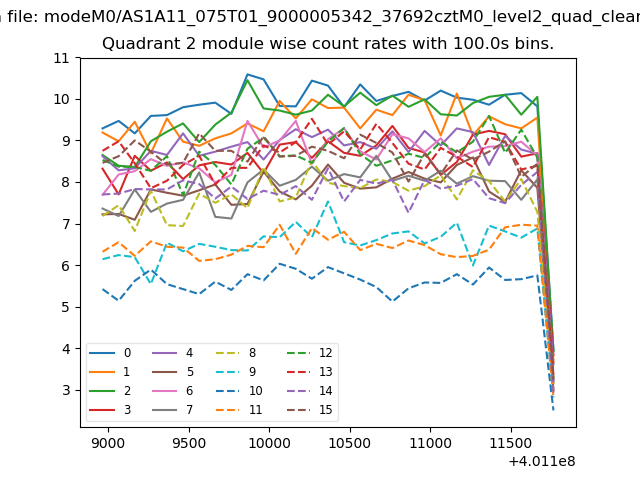
| Module-wise count rates for Quadrant B Data is divided into 100 sec bins |
 |
 |
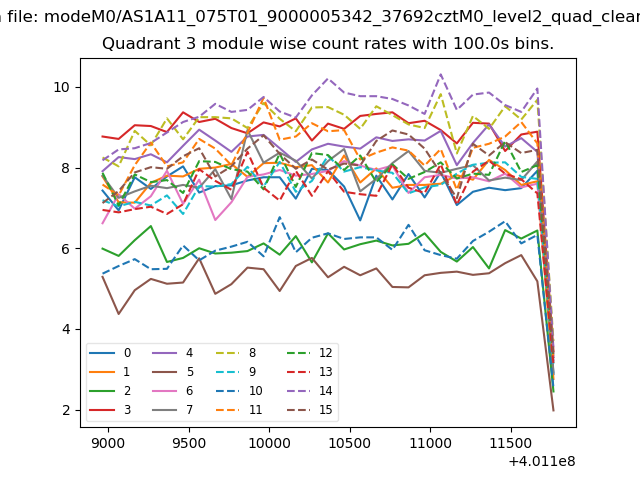
| Module-wise count rates for Quadrant C Data is divided into 100 sec bins |
 |
 |
| Module-wise count rates for Quadrant D Data is divided into 100 sec bins |
 |
 |
| Parameter | Plot |
|---|---|
| CZT HV Monitor |  |
| D_VDD | 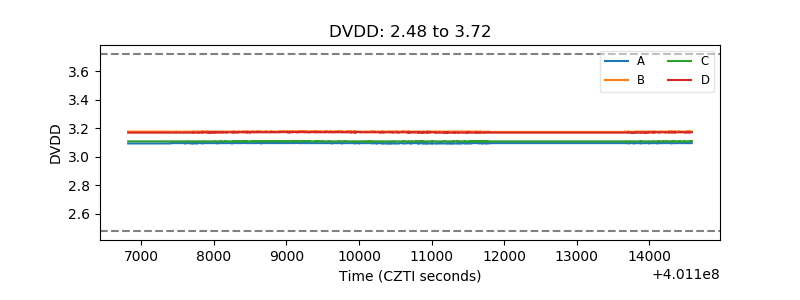 |
| Temperature 1 | 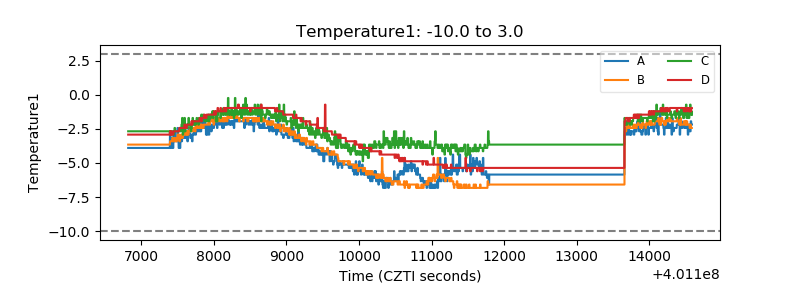 |
| Veto HV Monitor | 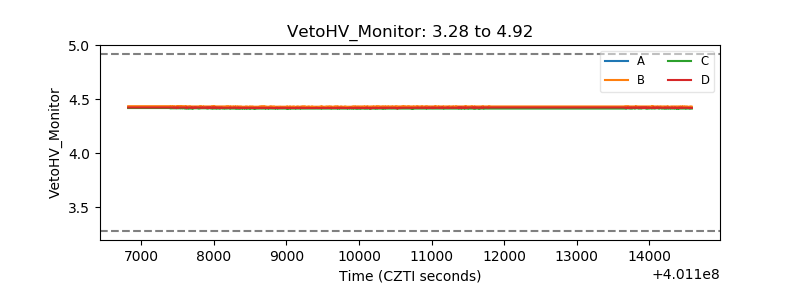 |
| Veto LLD | 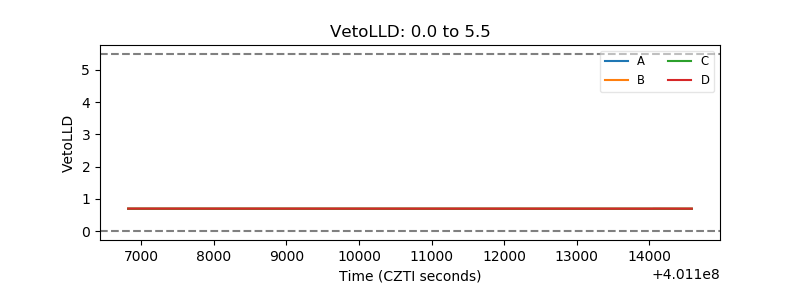 |
| Alpha Counter | 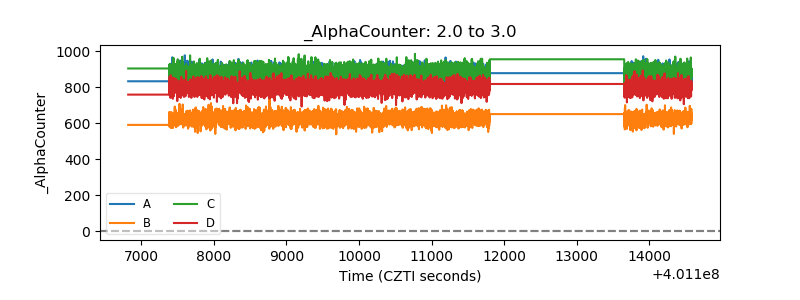 |
| _CPM_Rate | 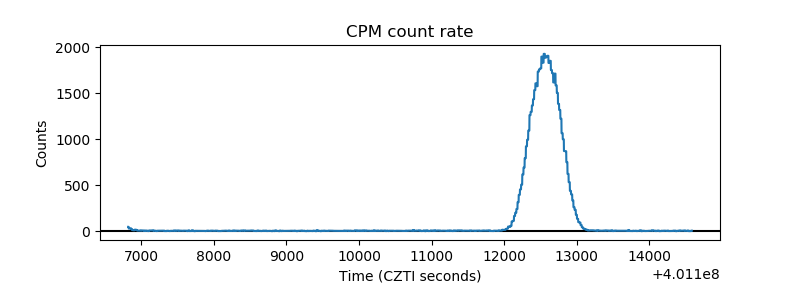 |
| CZT Counter | 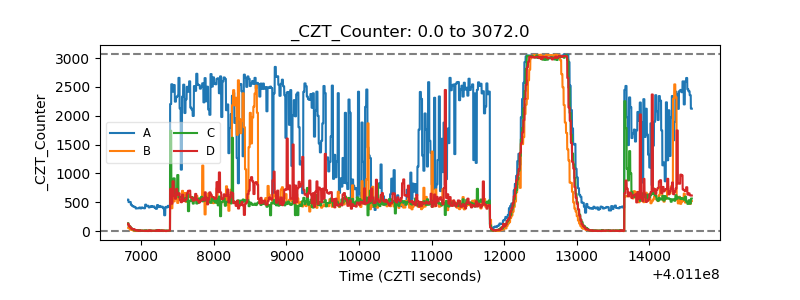 |
| +2.5 Volts monitor | 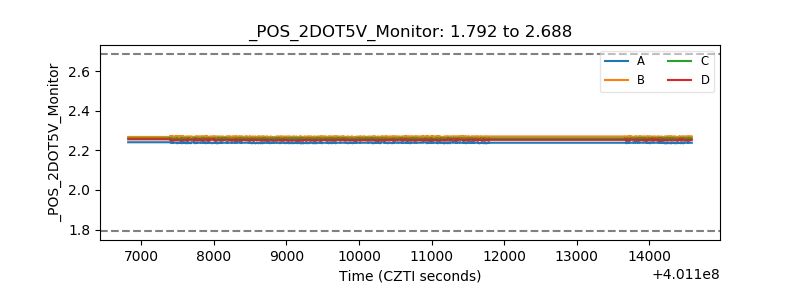 |
| +5 Volts monitor | 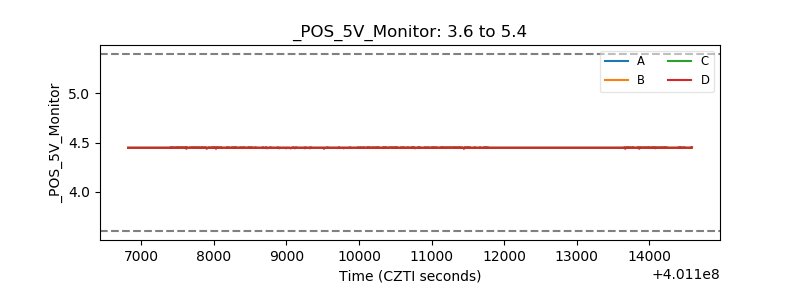 |
| _ROLL_ROT | 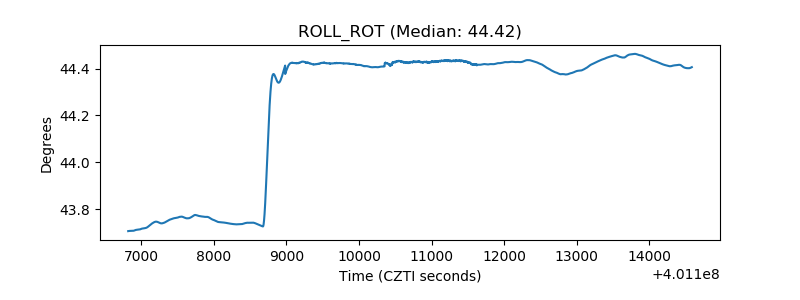 |
| _Roll_DEC | 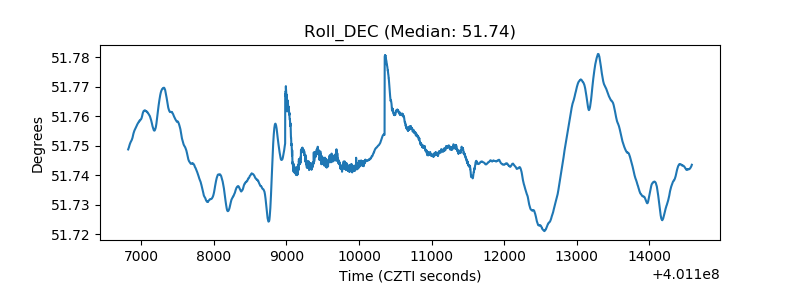 |
| _Roll_RA | 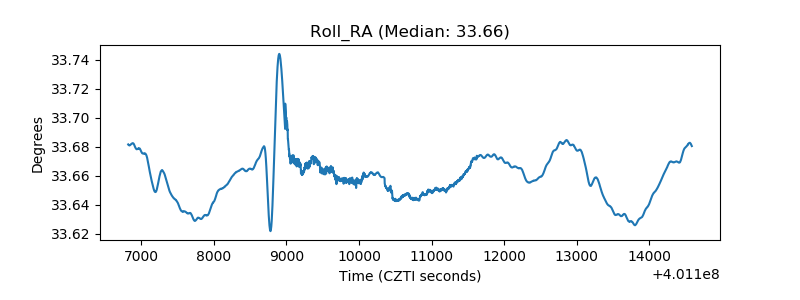 |
| Veto Counter | 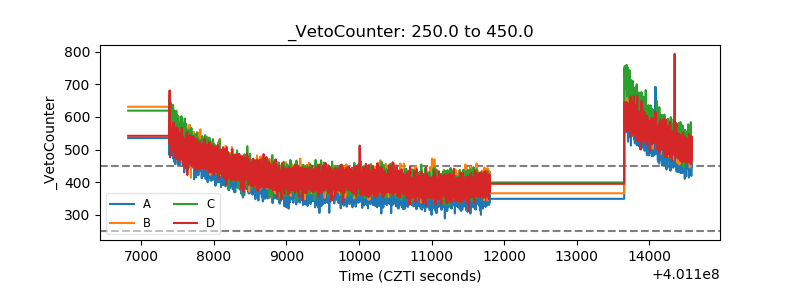 |