| Param | Original file | Final file |
|---|---|---|
| Filename | modeM0/AS1A11_075T01_9000005342_37693cztM0_level2.evt | modeM0/AS1A11_075T01_9000005342_37693cztM0_level2_quad_clean.evt |
| Size (bytes) | 579,000,960 | 72,720,000 |
| Size | 552.2 MB | 69.4 MB |
| Events in quadrant A | 6,220,059 | 451,359 |
| Events in quadrant B | 2,937,828 | 478,155 |
| Events in quadrant C | 2,915,195 | 472,638 |
| Events in quadrant D | 5,108,086 | 432,958 |
| Mode SS | |||
|---|---|---|---|
| Quadrant | BADHDUFLAG | Total packets | Discarded packets |
| A | 0 | 106 | 0 |
| B | 0 | 106 | 0 |
| C | 0 | 106 | 0 |
| D | 0 | 106 | 0 |
| Mode M0 | |||
|---|---|---|---|
| Quadrant | BADHDUFLAG | Total packets | Discarded packets |
| A | 0 | 22004 | 3 |
| B | 0 | 12033 | 2 |
| C | 0 | 11707 | 2 |
| D | 0 | 19040 | 2 |
| Mode M9 | |||
|---|---|---|---|
| Quadrant | BADHDUFLAG | Total packets | Discarded packets |
| A | 0 | 28 | 0 |
| B | 0 | 28 | 0 |
| C | 0 | 28 | 0 |
| D | 0 | 29 | 0 |
| Quadrant | Total seconds | Saturated seconds | Saturation percentage |
|---|---|---|---|
| A | 5240 | 1192 | 22.748092% |
| B | 5240 | 69 | 1.316794% |
| C | 5240 | 29 | 0.553435% |
| D | 5240 | 174 | 3.320611% |
Noise dominated data is calculated using 1-second bins in cleaned event files. If a bin has >2000 counts, and if more than 50% of those come from <1% of pixels, then it is considered to be noise-dominated and hence unusable.
| Quadrant | # 1 sec bins | Bins with >0 counts | Bins with >2000 counts | High rate bins dominated by noise | Noise dominated (total time) | Noise dominated (detector-on time) | Marked lightcurve |
|---|---|---|---|---|---|---|---|
| A | 7213 | 5241 | 982 | 982 | 13.61% | 18.74% | 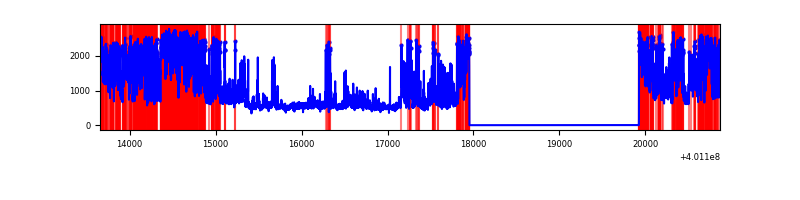 |
| B | 7212 | 5239 | 45 | 45 | 0.62% | 0.86% | 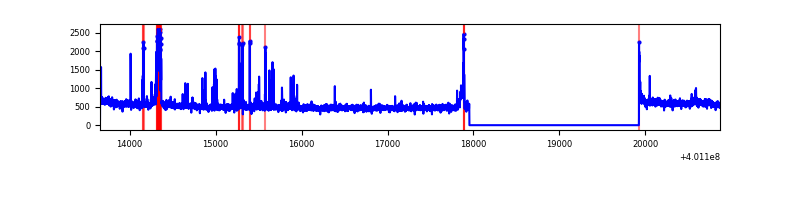 |
| C | 7212 | 5239 | 19 | 19 | 0.26% | 0.36% | 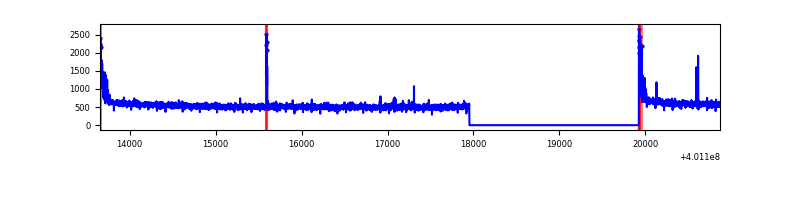 |
| D | 7212 | 5239 | 190 | 190 | 2.63% | 3.63% | 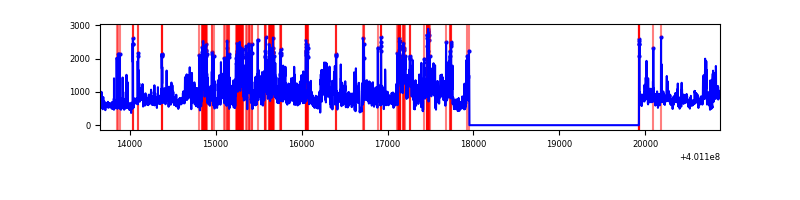 |
Top three noisy pixels from each quadrant. If the there are fewer than three noisy pixels in the level2.evt file, extra rows are filled as -1
| Pixel properties | Quadrant properties | ||||||
|---|---|---|---|---|---|---|---|
| Quadrant | DetID | PixID | Counts | Sigma | Mean | Median | Sigma |
| A | 15 | 222 | 3519779 | 28601.94 | 615 | 604 | 123.0 |
| A | 10 | 83 | 289133 | 2345.01 | 615 | 604 | 123.0 |
| A | 9 | 143 | 16292 | 127.5 | 615 | 604 | 123.0 |
| B | 5 | 172 | 182501 | 1461.95 | 662 | 646 | 124.4 |
| B | 15 | 85 | 53167 | 422.22 | 662 | 646 | 124.4 |
| B | 0 | 230 | 40696 | 321.97 | 662 | 646 | 124.4 |
| C | 15 | 214 | 223020 | 1492.02 | 654 | 662 | 149.0 |
| C | 0 | 10 | 97245 | 648.07 | 654 | 662 | 149.0 |
| C | 14 | 254 | 25729 | 168.2 | 654 | 662 | 149.0 |
| D | 12 | 227 | 1948784 | 12400.39 | 650 | 636 | 157.1 |
| D | 5 | 222 | 316591 | 2011.12 | 650 | 636 | 157.1 |
| D | 13 | 249 | 175018 | 1109.98 | 650 | 636 | 157.1 |
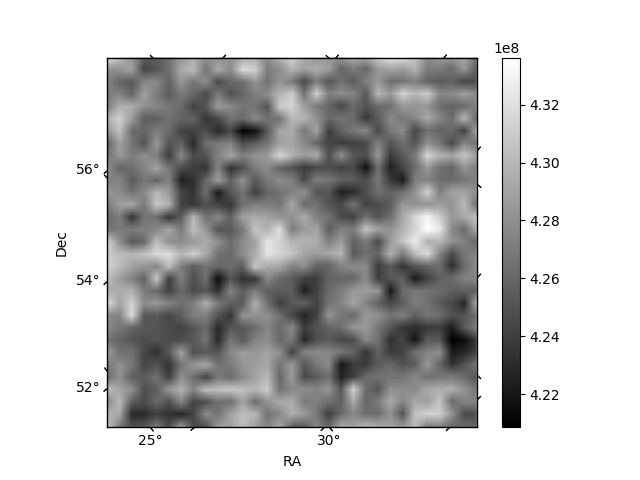
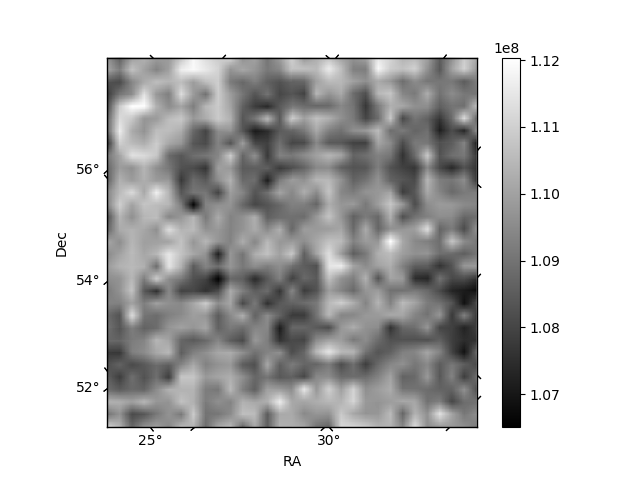
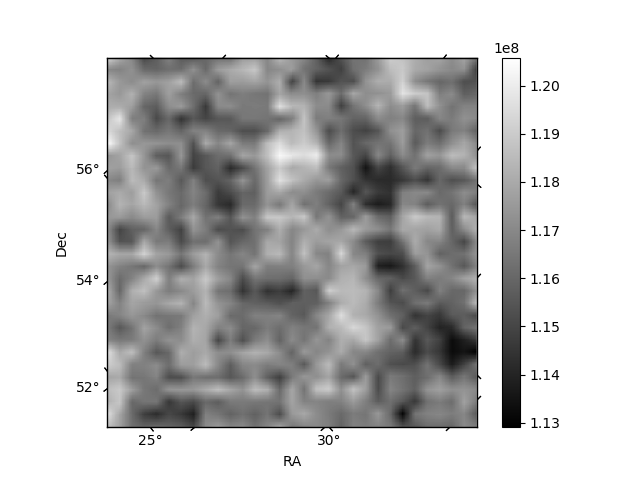
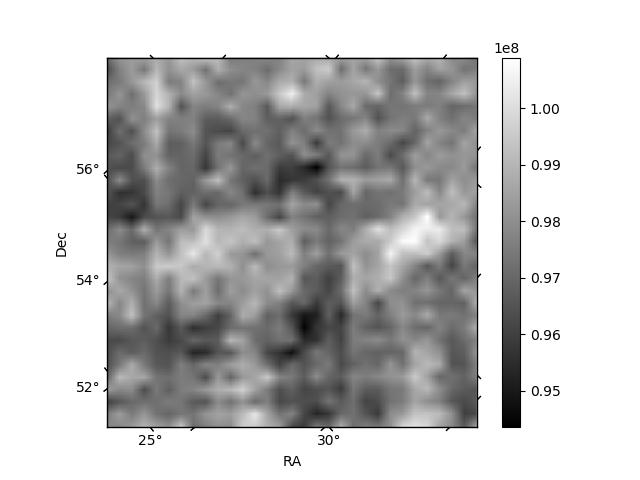
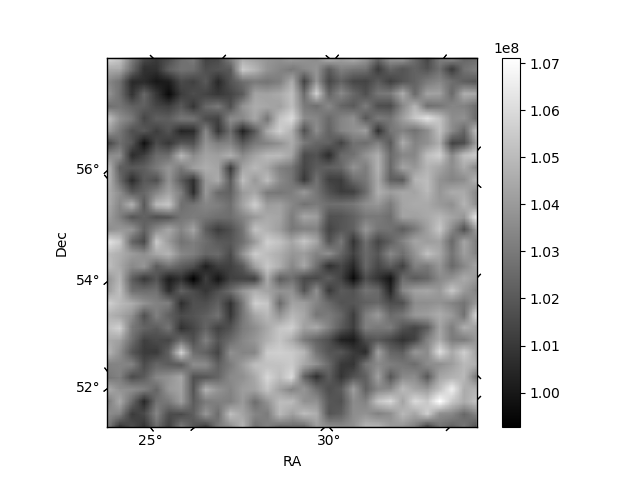
Histogram calculated using DETX and DETY for each event in the final _common_clean file
| Quadrant A | 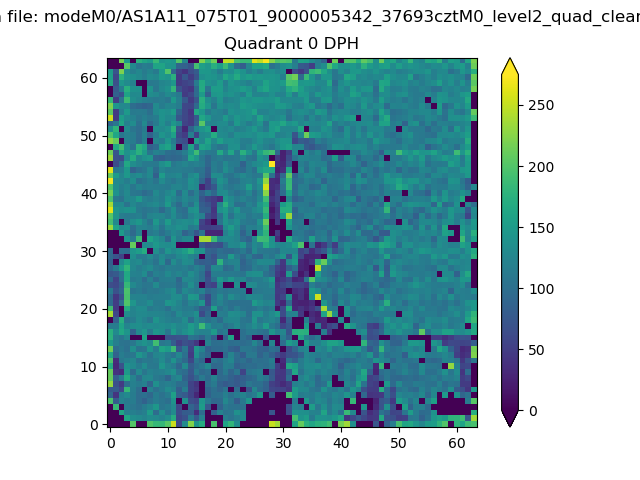 |
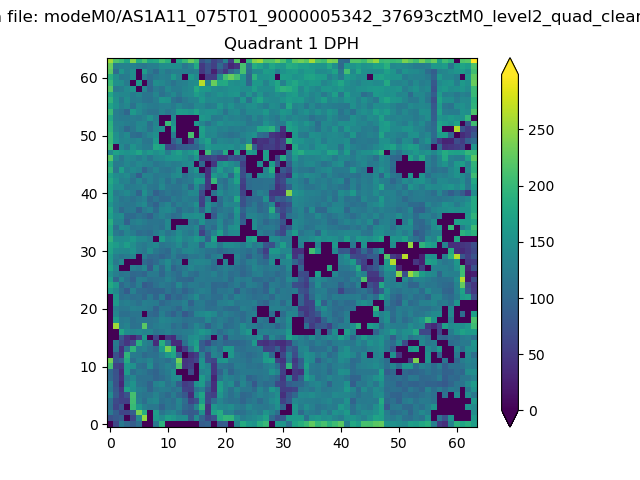 |
Quadrant B |
|---|---|---|---|
| Quadrant D | 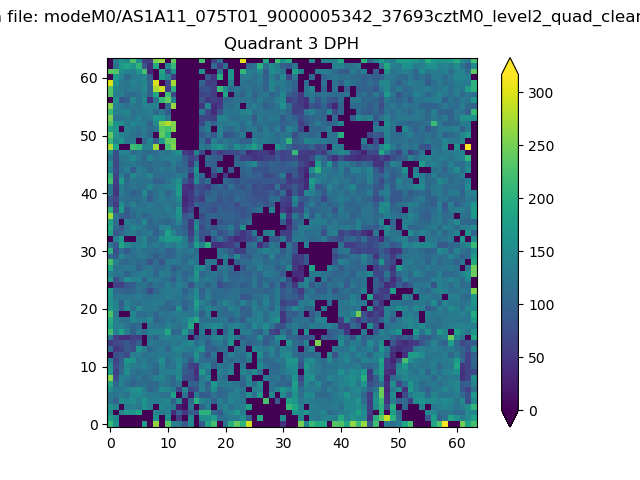 |
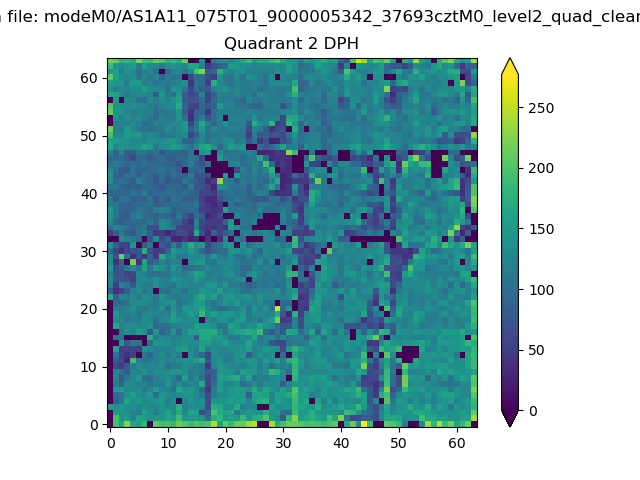 |
Quadrant C |
| Plot type | Count rate plots | Images |
|---|---|---|
| Comparison with Poisson distribution Blue bars denote a histogram of data divided into 1 sec bins. Red curve is a Poisson curve with rate = median count rate of data. |
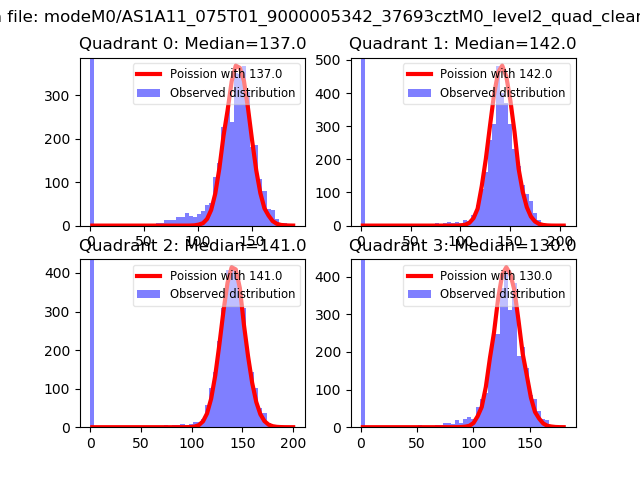 |
 |
| Quadrant-wise count rates Data is divided into 100 sec bins |
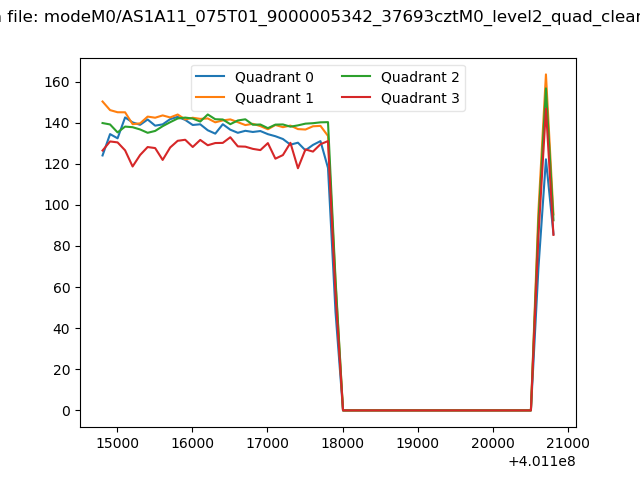 |
|
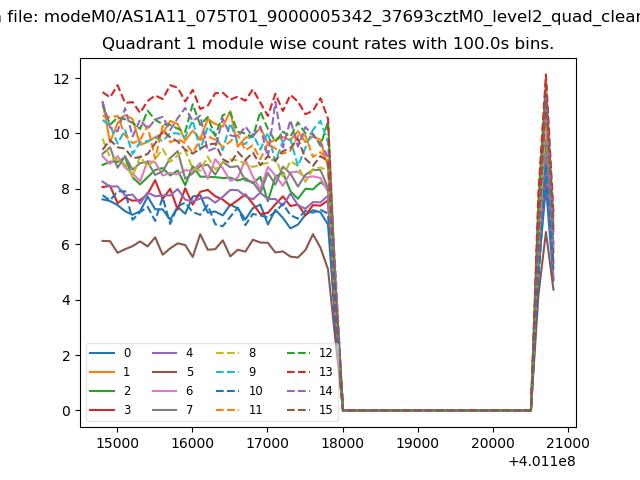
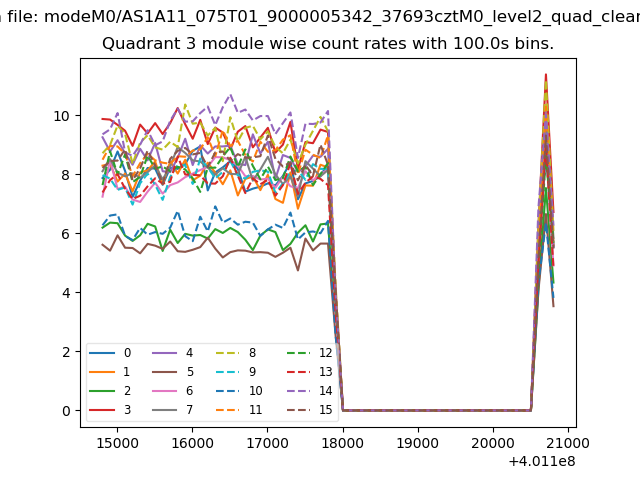
| Module-wise count rates for Quadrant A Data is divided into 100 sec bins |
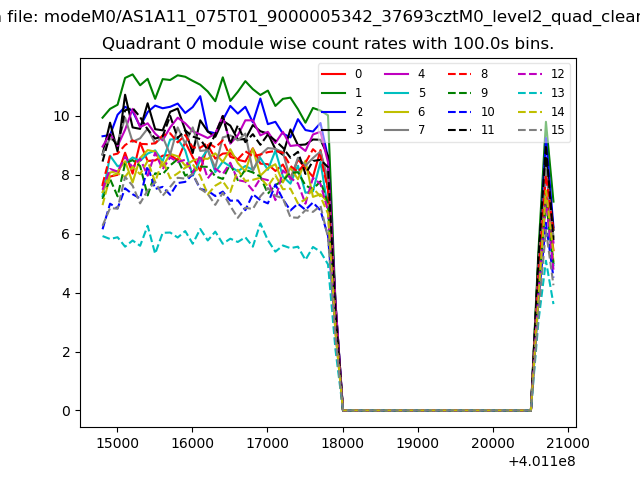 |
 |
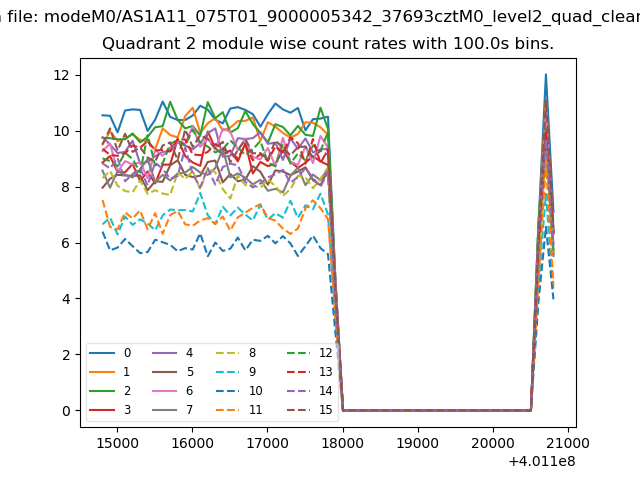
| Module-wise count rates for Quadrant B Data is divided into 100 sec bins |
 |
 |
| Module-wise count rates for Quadrant C Data is divided into 100 sec bins |
 |
 |
| Module-wise count rates for Quadrant D Data is divided into 100 sec bins |
 |
 |
| Parameter | Plot |
|---|---|
| CZT HV Monitor | 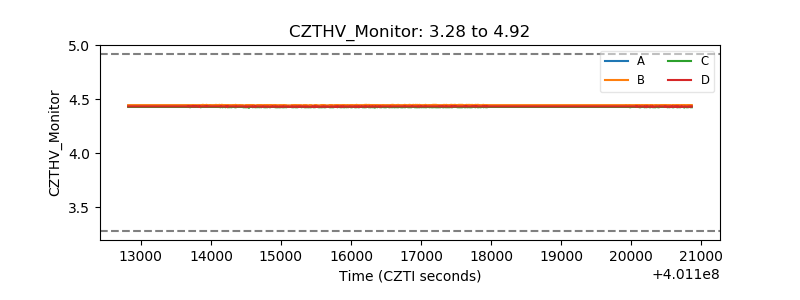 |
| D_VDD | 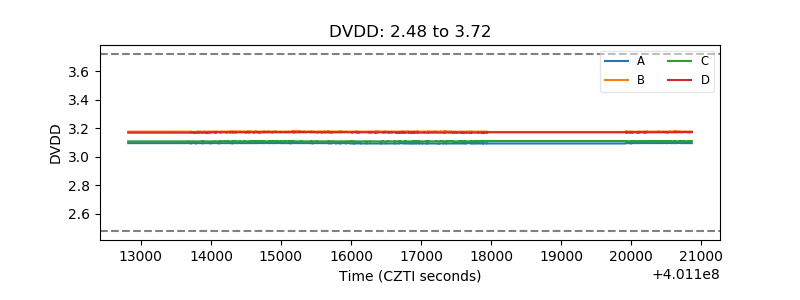 |
| Temperature 1 | 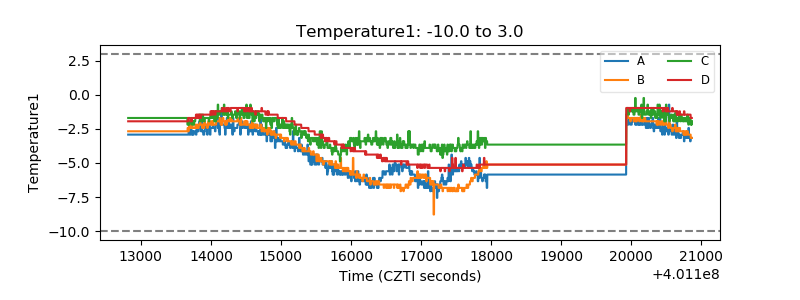 |
| Veto HV Monitor | 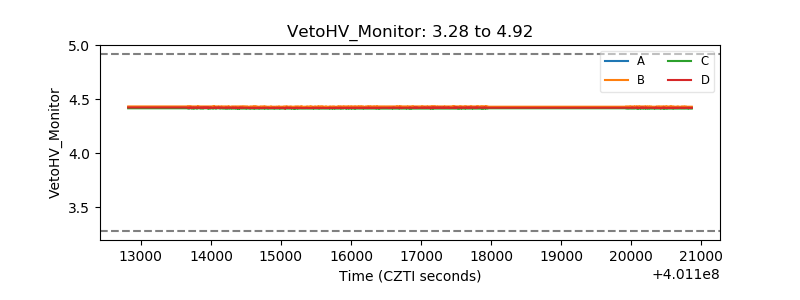 |
| Veto LLD | 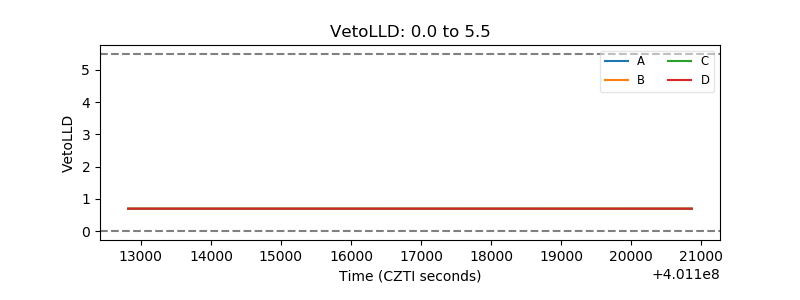 |
| Alpha Counter | 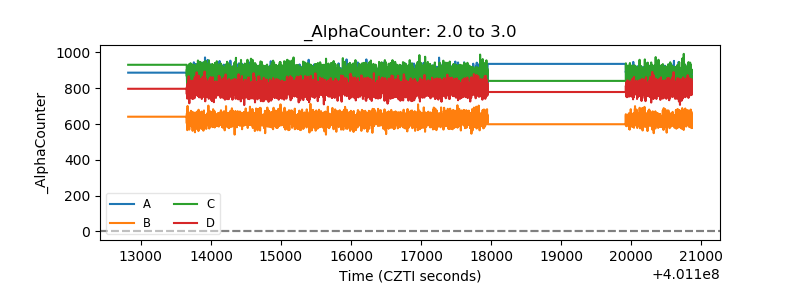 |
| _CPM_Rate | 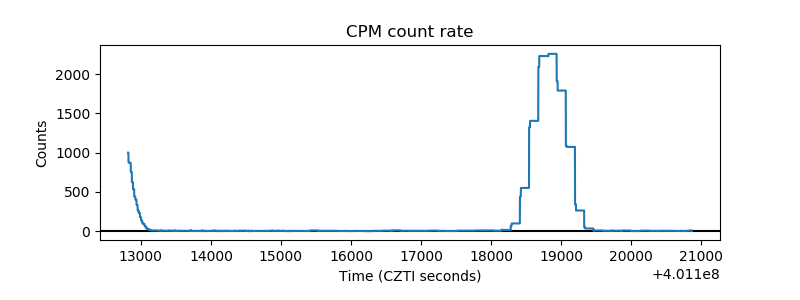 |
| CZT Counter | 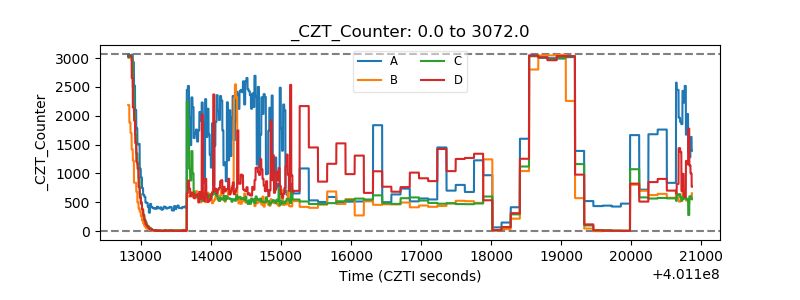 |
| +2.5 Volts monitor | 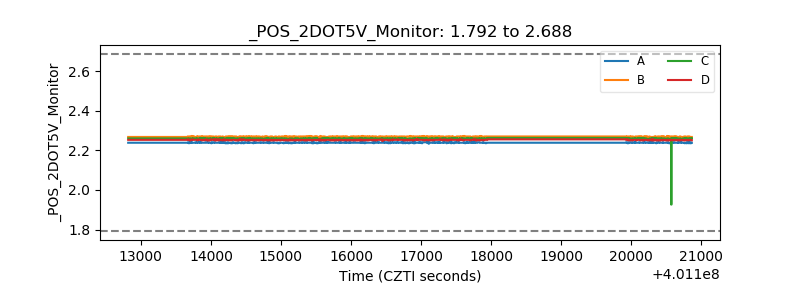 |
| +5 Volts monitor | 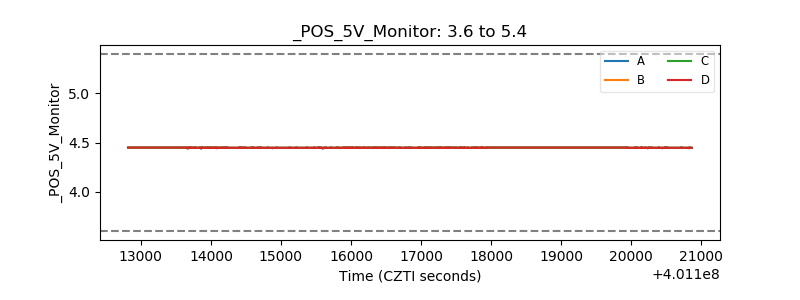 |
| _ROLL_ROT | 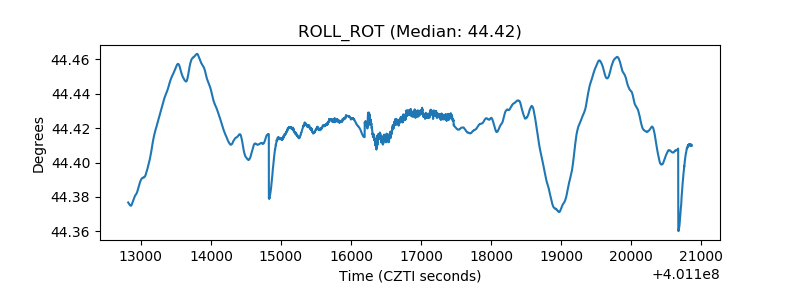 |
| _Roll_DEC | 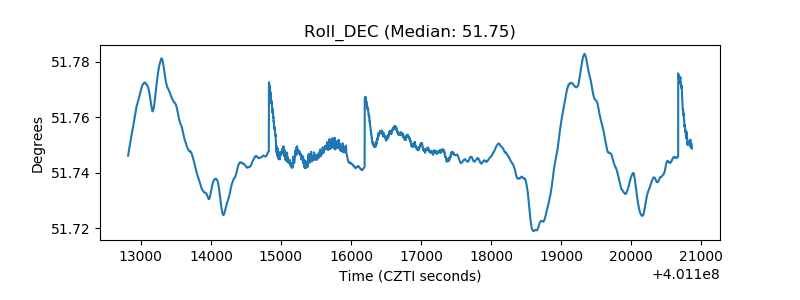 |
| _Roll_RA | 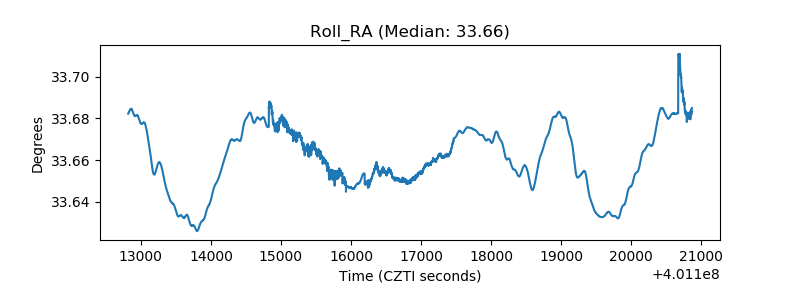 |
| Veto Counter | 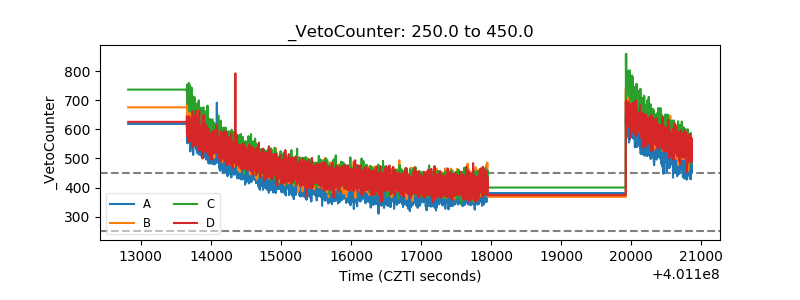 |