| Param | Original file | Final file |
|---|---|---|
| Filename | modeM0/AS1A11_075T01_9000005342_37694cztM0_level2.evt | modeM0/AS1A11_075T01_9000005342_37694cztM0_level2_quad_clean.evt |
| Size (bytes) | 596,880,000 | 82,080,000 |
| Size | 569.2 MB | 78.3 MB |
| Events in quadrant A | 8,000,986 | 452,249 |
| Events in quadrant B | 2,699,502 | 578,272 |
| Events in quadrant C | 2,786,139 | 576,106 |
| Events in quadrant D | 4,258,488 | 534,048 |
| Mode SS | |||
|---|---|---|---|
| Quadrant | BADHDUFLAG | Total packets | Discarded packets |
| A | 0 | 100 | 0 |
| B | 0 | 100 | 0 |
| C | 0 | 100 | 0 |
| D | 0 | 100 | 0 |
| Mode M0 | |||
|---|---|---|---|
| Quadrant | BADHDUFLAG | Total packets | Discarded packets |
| A | 0 | 27240 | 3 |
| B | 0 | 11133 | 2 |
| C | 0 | 11215 | 2 |
| D | 0 | 16143 | 2 |
| Mode M9 | |||
|---|---|---|---|
| Quadrant | BADHDUFLAG | Total packets | Discarded packets |
| A | 0 | 27 | 0 |
| B | 0 | 27 | 0 |
| C | 0 | 27 | 0 |
| D | 0 | 28 | 0 |
| Quadrant | Total seconds | Saturated seconds | Saturation percentage |
|---|---|---|---|
| A | 4907 | 1851 | 37.721622% |
| B | 4907 | 33 | 0.672509% |
| C | 4907 | 45 | 0.917057% |
| D | 4907 | 69 | 1.406154% |
Noise dominated data is calculated using 1-second bins in cleaned event files. If a bin has >2000 counts, and if more than 50% of those come from <1% of pixels, then it is considered to be noise-dominated and hence unusable.
| Quadrant | # 1 sec bins | Bins with >0 counts | Bins with >2000 counts | High rate bins dominated by noise | Noise dominated (total time) | Noise dominated (detector-on time) | Marked lightcurve |
|---|---|---|---|---|---|---|---|
| A | 6969 | 4908 | 1715 | 1715 | 24.61% | 34.94% | 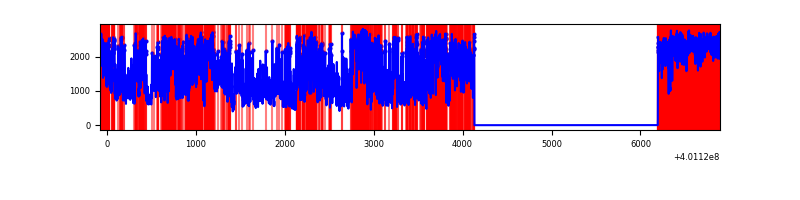 |
| B | 6968 | 4906 | 17 | 17 | 0.24% | 0.35% | 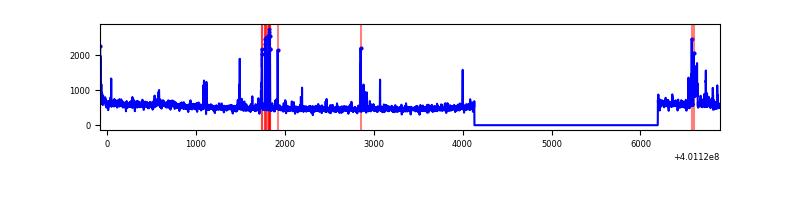 |
| C | 6968 | 4906 | 31 | 31 | 0.44% | 0.63% | 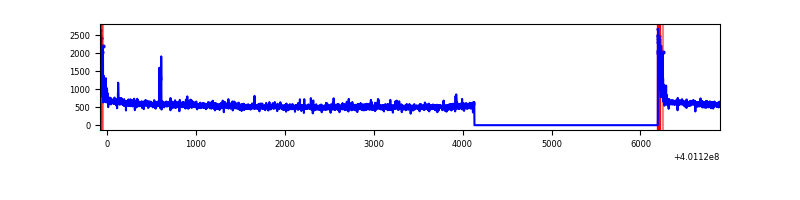 |
| D | 6968 | 4906 | 56 | 56 | 0.80% | 1.14% | 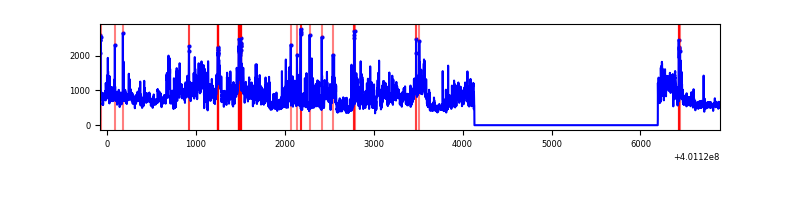 |
Top three noisy pixels from each quadrant. If the there are fewer than three noisy pixels in the level2.evt file, extra rows are filled as -1
| Pixel properties | Quadrant properties | ||||||
|---|---|---|---|---|---|---|---|
| Quadrant | DetID | PixID | Counts | Sigma | Mean | Median | Sigma |
| A | 15 | 222 | 5707309 | 55584.17 | 517 | 509 | 102.7 |
| A | 10 | 83 | 245506 | 2386.27 | 517 | 509 | 102.7 |
| A | 9 | 143 | 32967 | 316.14 | 517 | 509 | 102.7 |
| B | 5 | 172 | 98548 | 839.48 | 627 | 612 | 116.7 |
| B | 0 | 230 | 45317 | 383.2 | 627 | 612 | 116.7 |
| B | 5 | 184 | 34432 | 289.89 | 627 | 612 | 116.7 |
| C | 15 | 214 | 208938 | 1462.44 | 622 | 628 | 142.4 |
| C | 0 | 10 | 117559 | 820.91 | 622 | 628 | 142.4 |
| C | 14 | 254 | 19734 | 134.13 | 622 | 628 | 142.4 |
| D | 12 | 227 | 1639813 | 11149.54 | 616 | 601 | 147.0 |
| D | 13 | 249 | 96520 | 652.42 | 616 | 601 | 147.0 |
| D | 5 | 32 | 44181 | 296.42 | 616 | 601 | 147.0 |
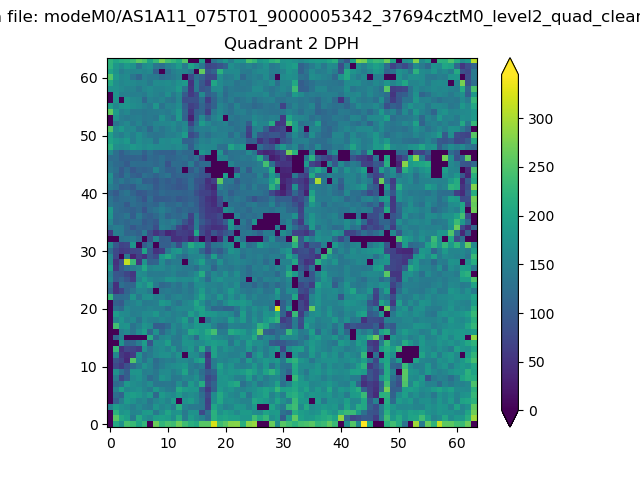
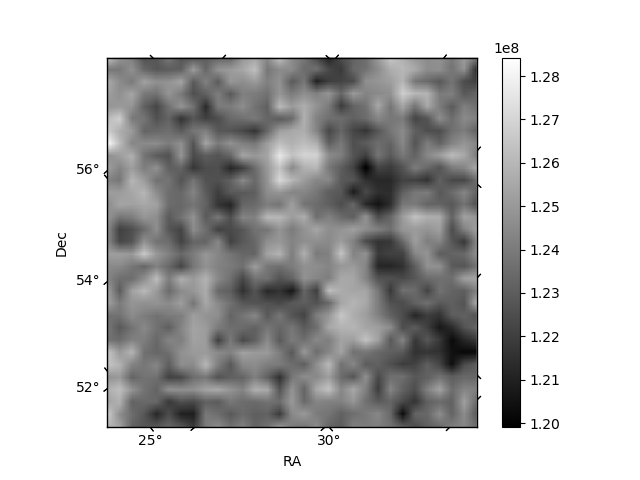
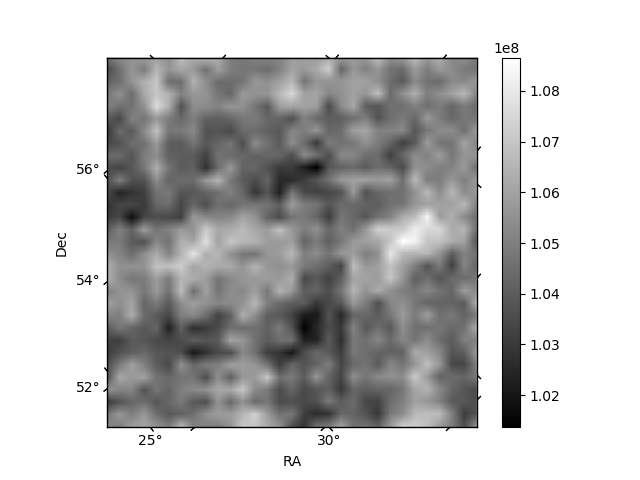
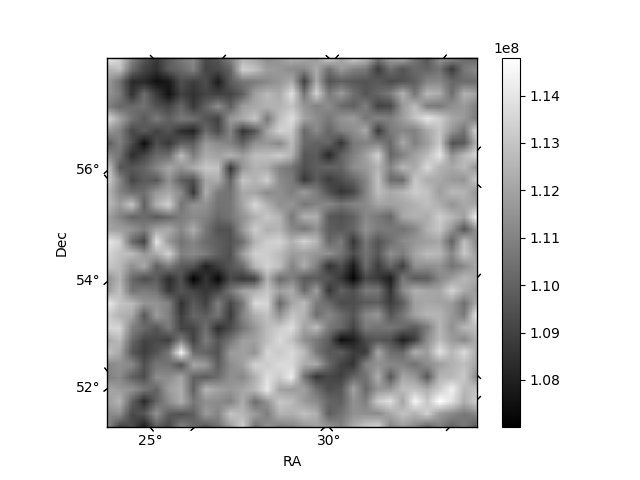
Histogram calculated using DETX and DETY for each event in the final _common_clean file
| Quadrant A | 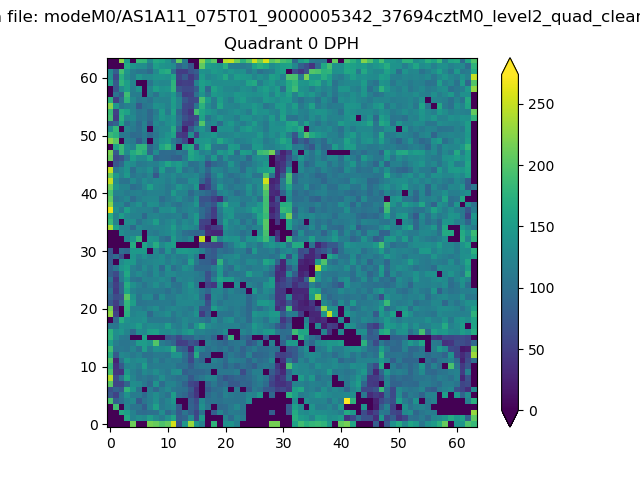 |
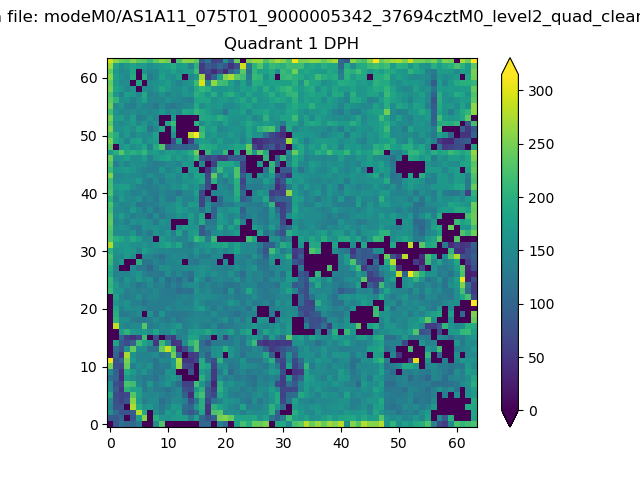 |
Quadrant B |
|---|---|---|---|
| Quadrant D | 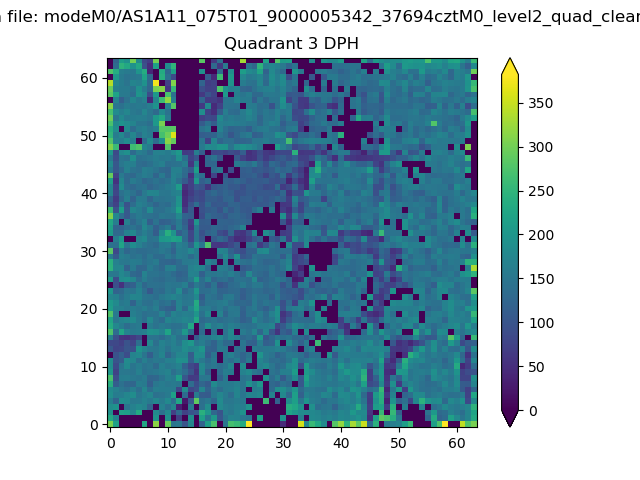 |
 |
Quadrant C |
| Plot type | Count rate plots | Images |
|---|---|---|
| Comparison with Poisson distribution Blue bars denote a histogram of data divided into 1 sec bins. Red curve is a Poisson curve with rate = median count rate of data. |
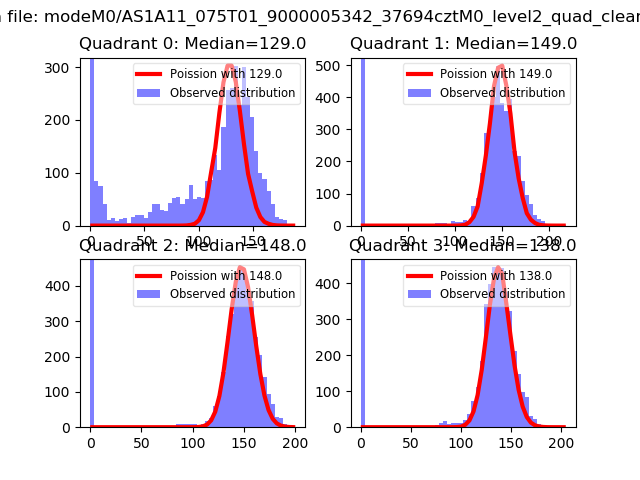 |
 |
| Quadrant-wise count rates Data is divided into 100 sec bins |
 |
|
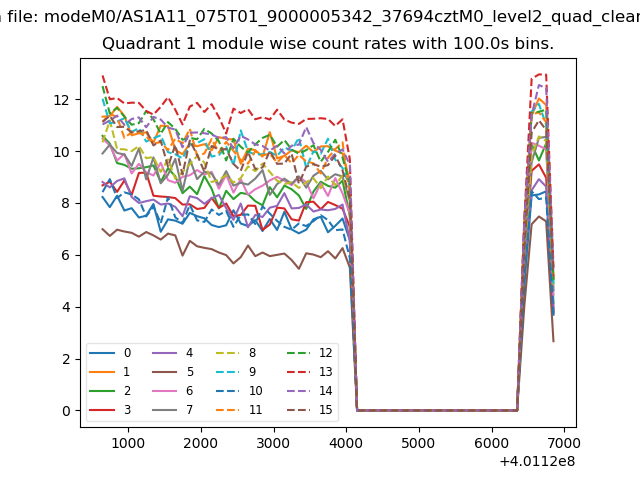
| Module-wise count rates for Quadrant A Data is divided into 100 sec bins |
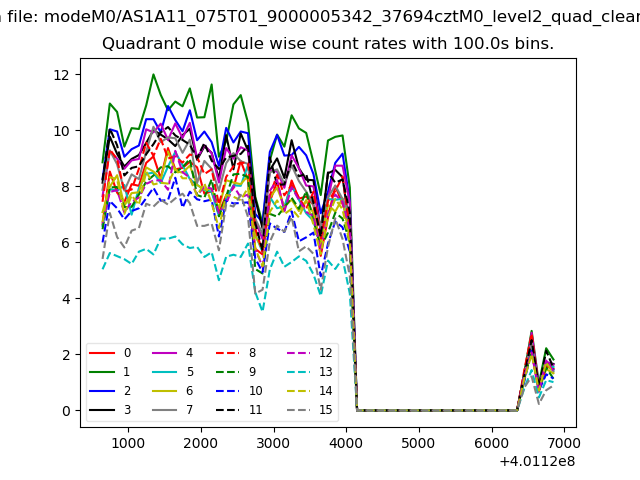 |
 |
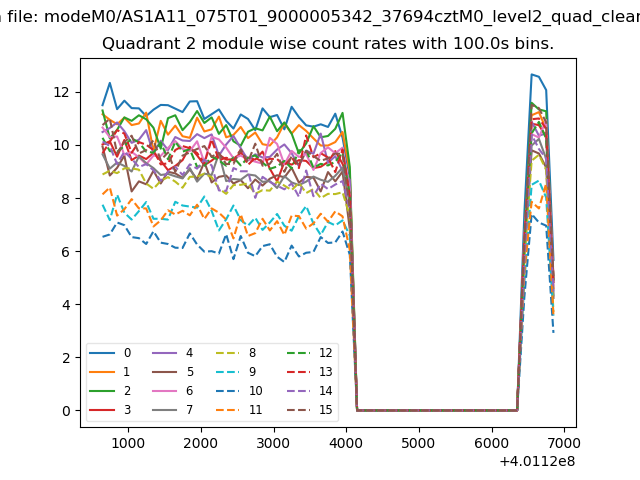
| Module-wise count rates for Quadrant B Data is divided into 100 sec bins |
 |
 |
| Module-wise count rates for Quadrant C Data is divided into 100 sec bins |
 |
 |
| Module-wise count rates for Quadrant D Data is divided into 100 sec bins |
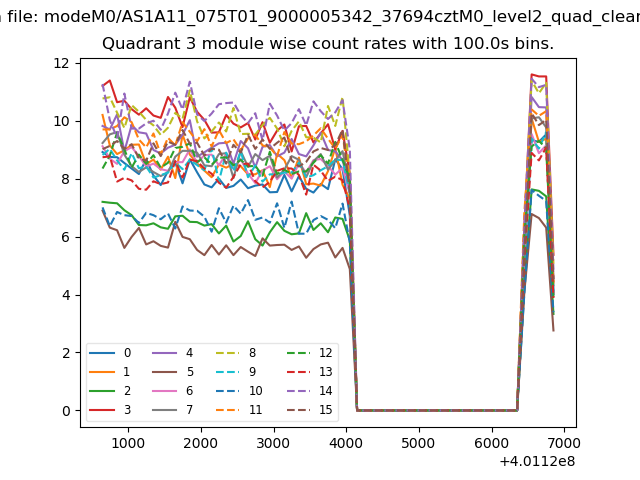 |
 |
| Parameter | Plot |
|---|---|
| CZT HV Monitor | 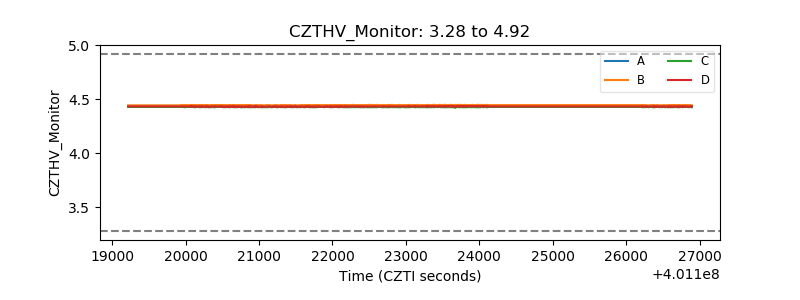 |
| D_VDD | 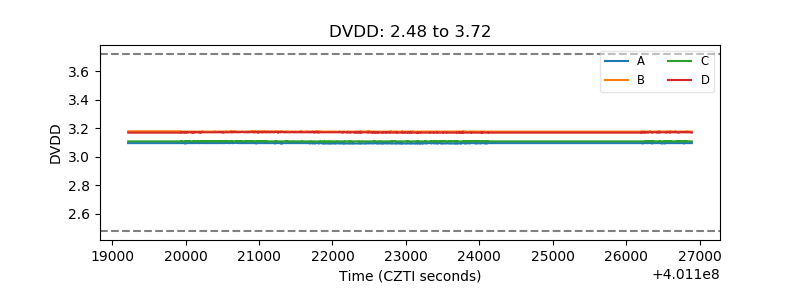 |
| Temperature 1 | 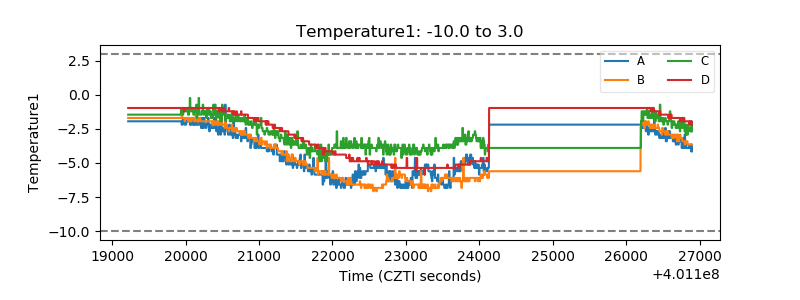 |
| Veto HV Monitor | 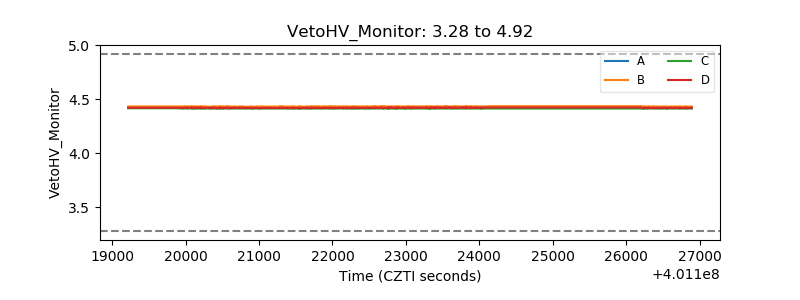 |
| Veto LLD | 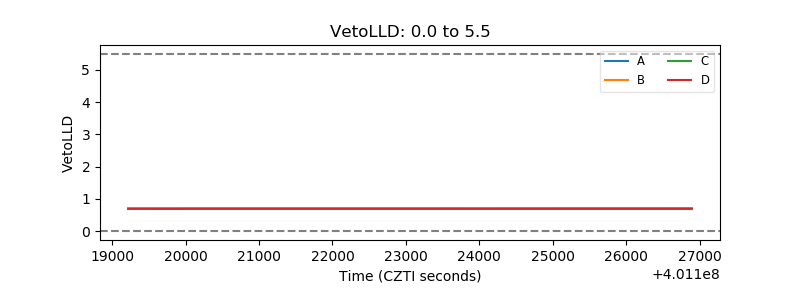 |
| Alpha Counter | 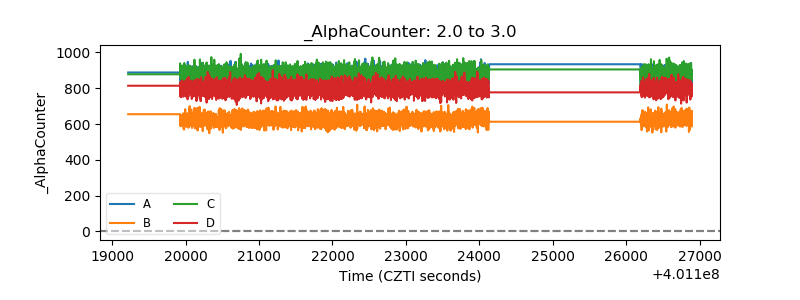 |
| _CPM_Rate |  |
| CZT Counter | 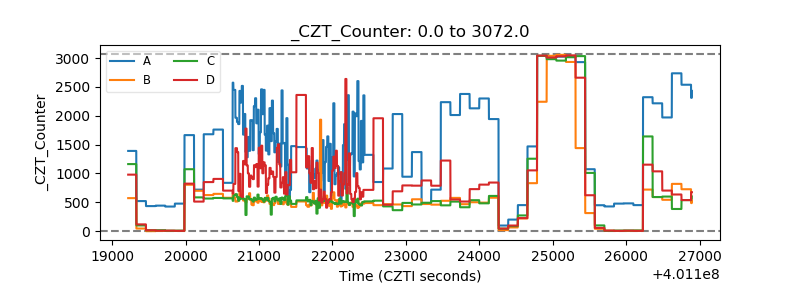 |
| +2.5 Volts monitor |  |
| +5 Volts monitor | 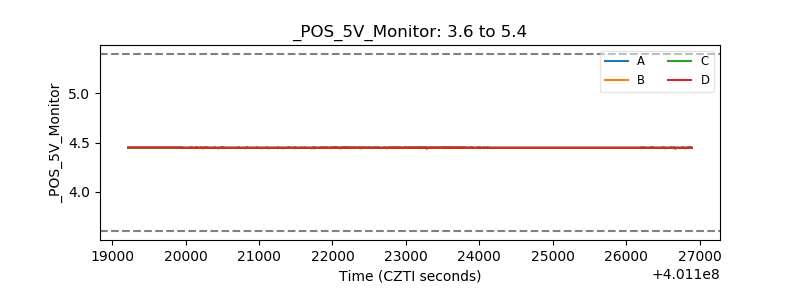 |
| _ROLL_ROT | 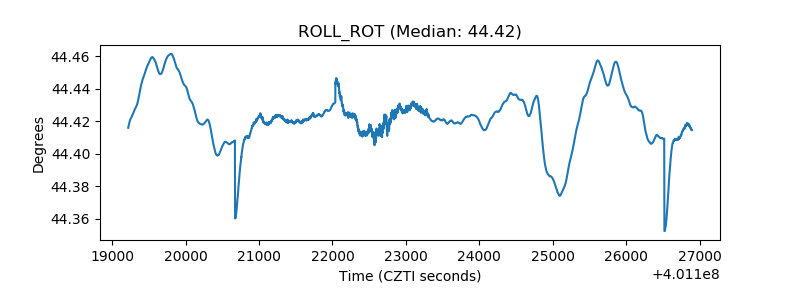 |
| _Roll_DEC | 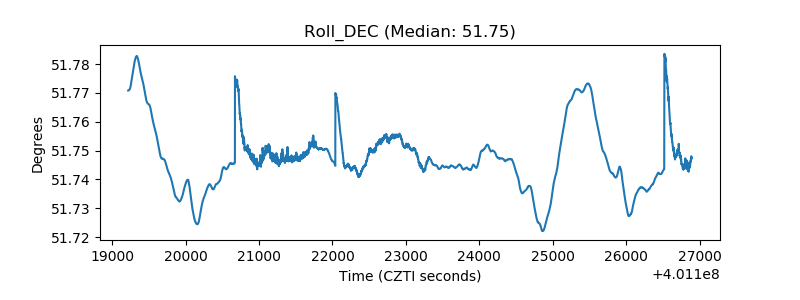 |
| _Roll_RA | 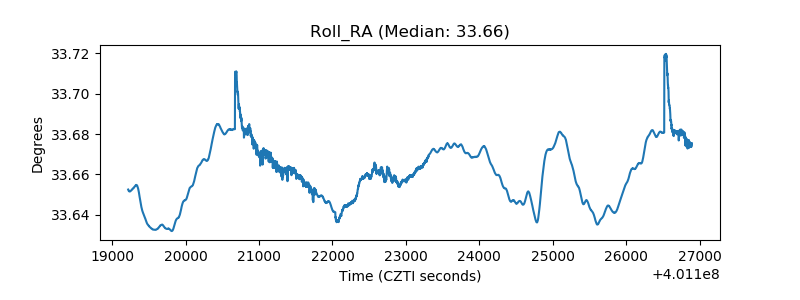 |
| Veto Counter | 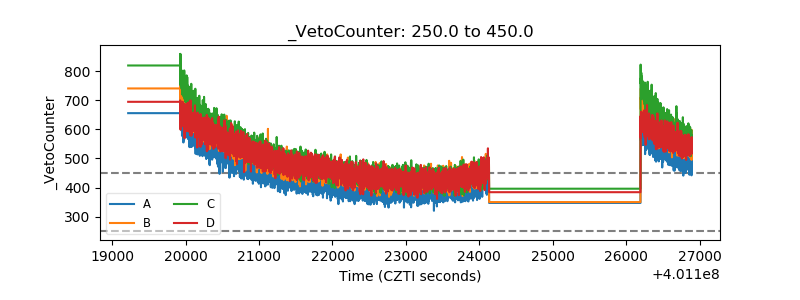 |