| Param | Original file | Final file |
|---|---|---|
| Filename | modeM0/AS1A11_075T01_9000005342_37696cztM0_level2.evt | modeM0/AS1A11_075T01_9000005342_37696cztM0_level2_quad_clean.evt |
| Size (bytes) | 471,813,120 | 96,600,960 |
| Size | 450.0 MB | 92.1 MB |
| Events in quadrant A | 5,642,922 | 611,533 |
| Events in quadrant B | 2,648,499 | 663,316 |
| Events in quadrant C | 2,703,383 | 667,292 |
| Events in quadrant D | 2,948,409 | 625,799 |
| Mode SS | |||
|---|---|---|---|
| Quadrant | BADHDUFLAG | Total packets | Discarded packets |
| A | 0 | 106 | 0 |
| B | 0 | 106 | 0 |
| C | 0 | 106 | 0 |
| D | 0 | 106 | 0 |
| Mode M0 | |||
|---|---|---|---|
| Quadrant | BADHDUFLAG | Total packets | Discarded packets |
| A | 0 | 20272 | 3 |
| B | 0 | 11069 | 2 |
| C | 0 | 10957 | 2 |
| D | 0 | 12071 | 2 |
| Mode M9 | |||
|---|---|---|---|
| Quadrant | BADHDUFLAG | Total packets | Discarded packets |
| A | 0 | 43 | 0 |
| B | 0 | 43 | 0 |
| C | 0 | 43 | 0 |
| D | 0 | 43 | 0 |
| Quadrant | Total seconds | Saturated seconds | Saturation percentage |
|---|---|---|---|
| A | 5101 | 411 | 8.057244% |
| B | 5101 | 33 | 0.646932% |
| C | 5101 | 31 | 0.607724% |
| D | 5101 | 52 | 1.019408% |
Noise dominated data is calculated using 1-second bins in cleaned event files. If a bin has >2000 counts, and if more than 50% of those come from <1% of pixels, then it is considered to be noise-dominated and hence unusable.
| Quadrant | # 1 sec bins | Bins with >0 counts | Bins with >2000 counts | High rate bins dominated by noise | Noise dominated (total time) | Noise dominated (detector-on time) | Marked lightcurve |
|---|---|---|---|---|---|---|---|
| A | 9346 | 5103 | 354 | 354 | 3.79% | 6.94% | 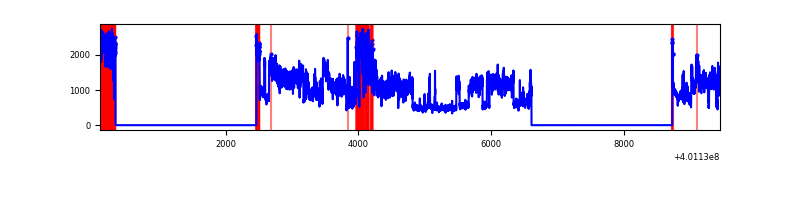 |
| B | 9346 | 5101 | 14 | 14 | 0.15% | 0.27% | 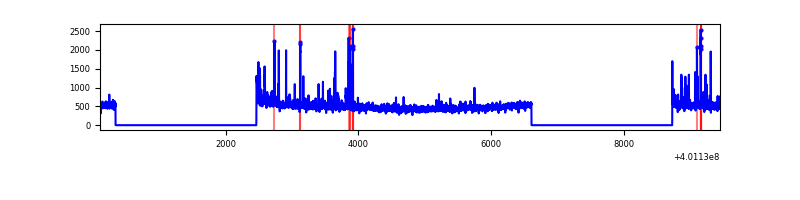 |
| C | 9346 | 5101 | 25 | 25 | 0.27% | 0.49% | 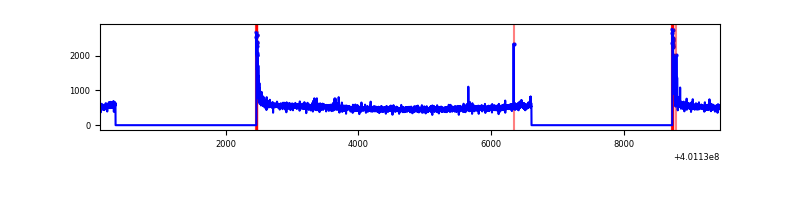 |
| D | 9346 | 5102 | 47 | 47 | 0.50% | 0.92% | 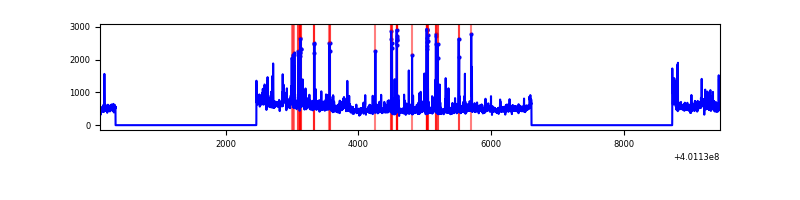 |
Top three noisy pixels from each quadrant. If the there are fewer than three noisy pixels in the level2.evt file, extra rows are filled as -1
| Pixel properties | Quadrant properties | ||||||
|---|---|---|---|---|---|---|---|
| Quadrant | DetID | PixID | Counts | Sigma | Mean | Median | Sigma |
| A | 15 | 222 | 3011825 | 25524.37 | 584 | 572 | 118.0 |
| A | 10 | 83 | 305630 | 2585.77 | 584 | 572 | 118.0 |
| A | 9 | 143 | 21943 | 181.15 | 584 | 572 | 118.0 |
| B | 5 | 172 | 106176 | 915.41 | 606 | 589 | 115.3 |
| B | 0 | 189 | 45961 | 393.36 | 606 | 589 | 115.3 |
| B | 5 | 255 | 30331 | 257.86 | 606 | 589 | 115.3 |
| C | 15 | 214 | 219408 | 1573.31 | 603 | 607 | 139.1 |
| C | 0 | 10 | 111312 | 796.03 | 603 | 607 | 139.1 |
| C | 14 | 254 | 9668 | 65.15 | 603 | 607 | 139.1 |
| D | 12 | 227 | 296350 | 2032.73 | 596 | 580 | 145.5 |
| D | 13 | 249 | 143525 | 982.41 | 596 | 580 | 145.5 |
| D | 2 | 249 | 48969 | 332.56 | 596 | 580 | 145.5 |
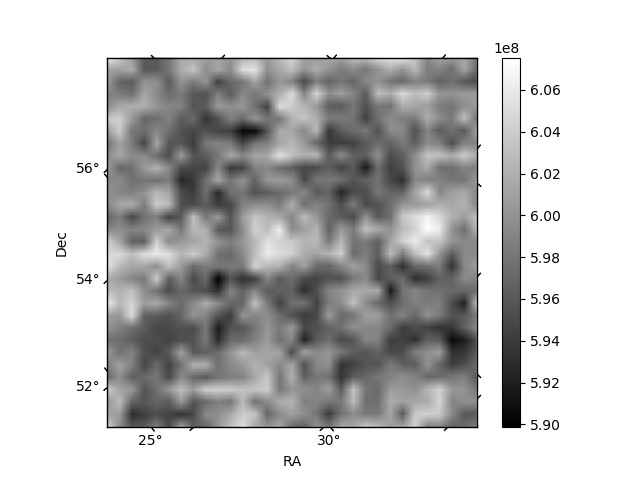
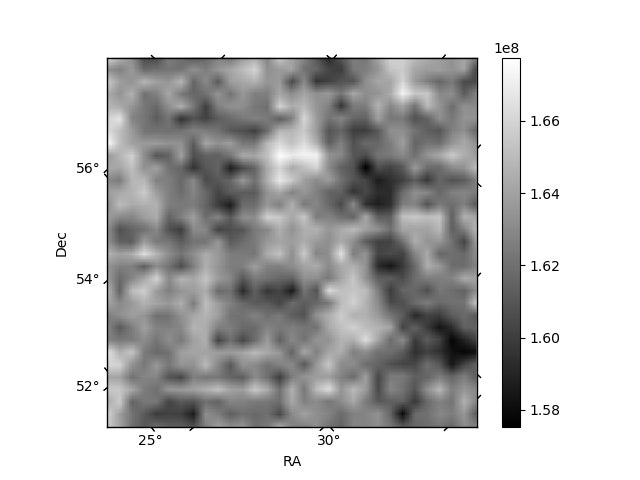
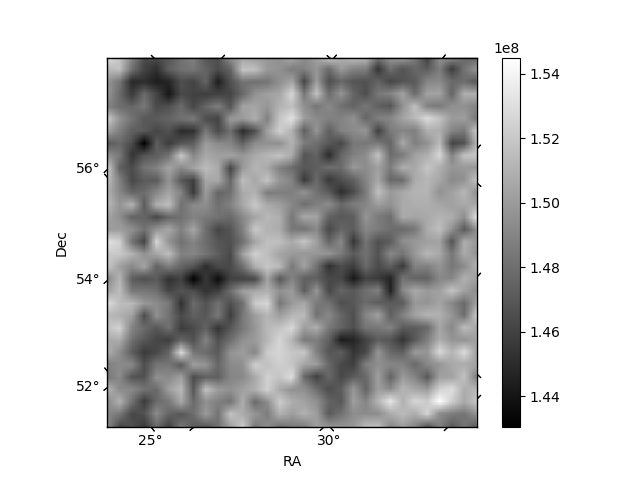
Histogram calculated using DETX and DETY for each event in the final _common_clean file
| Quadrant A | 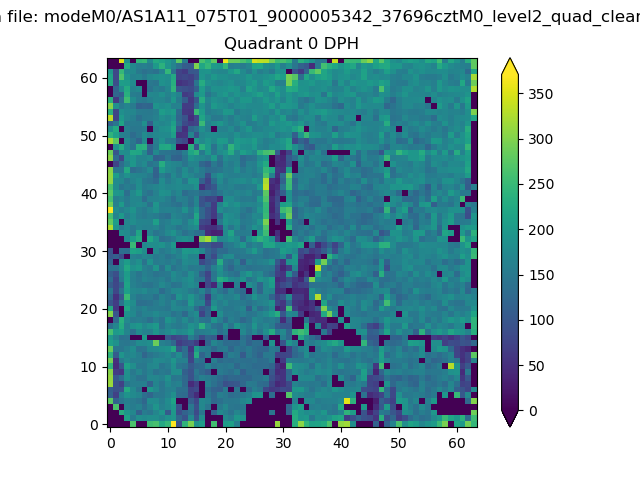 |
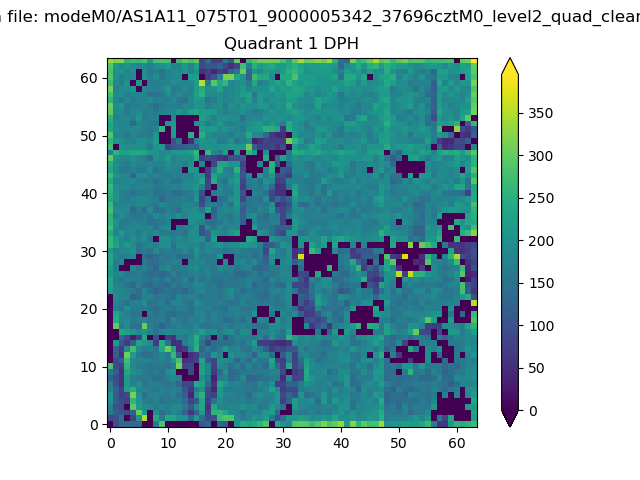 |
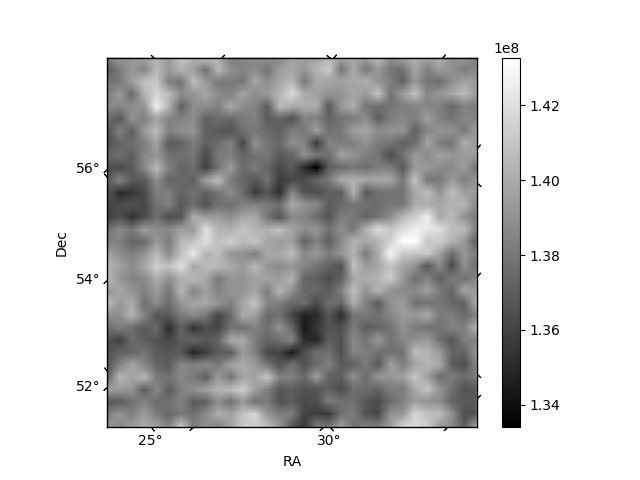
Quadrant B |
|---|---|---|---|
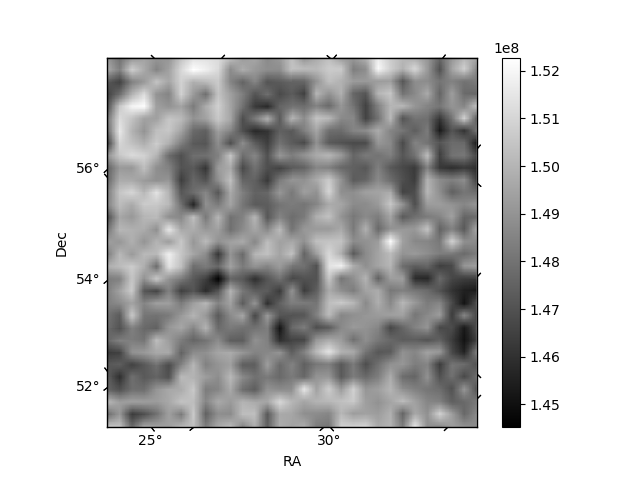
| Quadrant D | 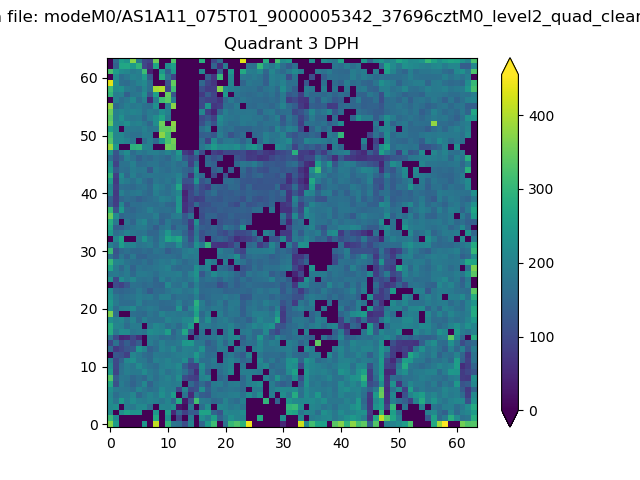 |
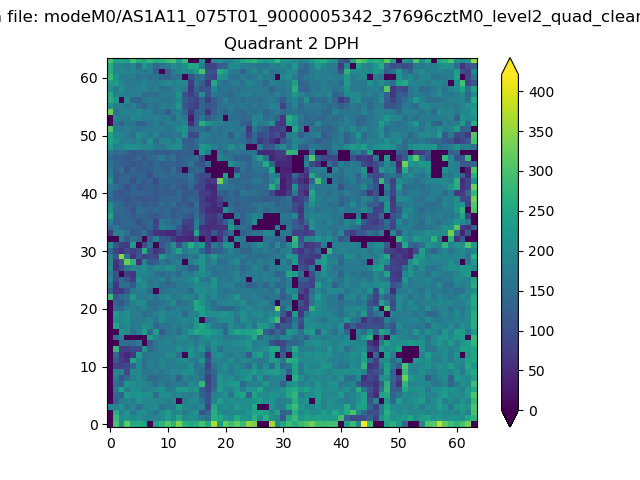 |
Quadrant C |
| Plot type | Count rate plots | Images |
|---|---|---|
| Comparison with Poisson distribution Blue bars denote a histogram of data divided into 1 sec bins. Red curve is a Poisson curve with rate = median count rate of data. |
 |
 |
| Quadrant-wise count rates Data is divided into 100 sec bins |
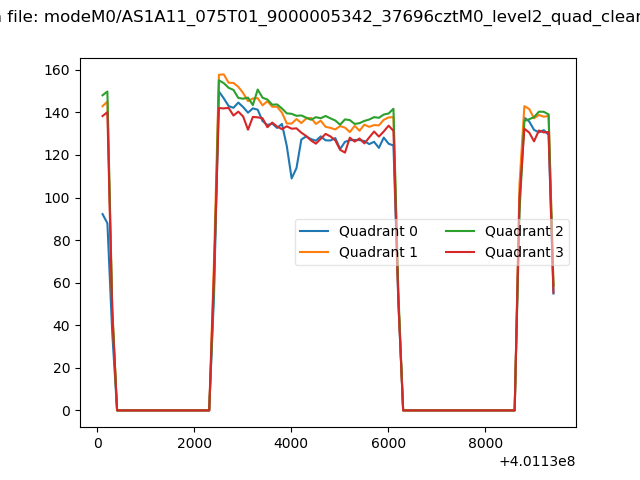 |
|
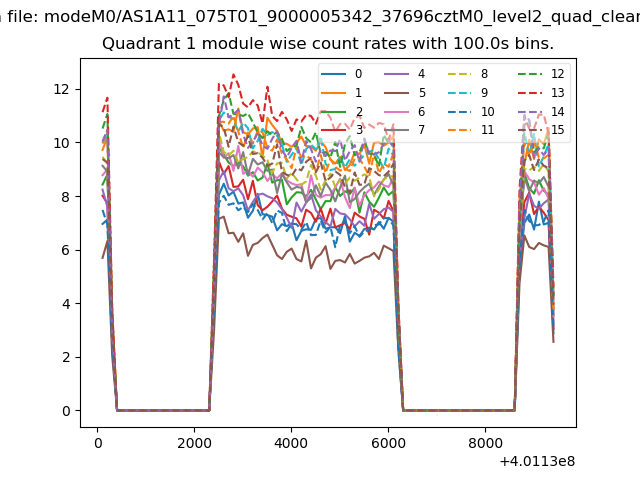
| Module-wise count rates for Quadrant A Data is divided into 100 sec bins |
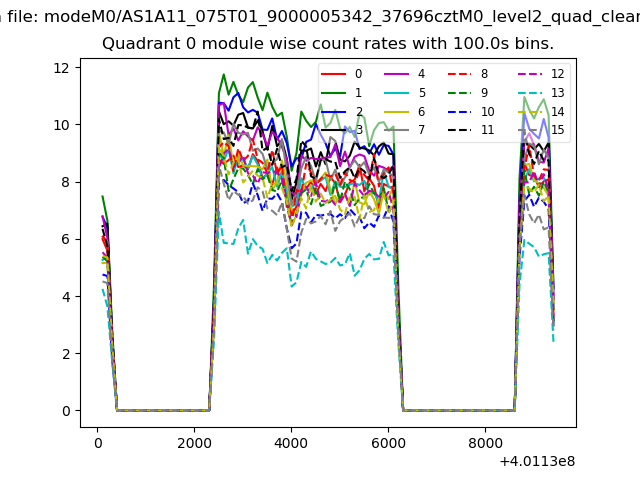 |
 |
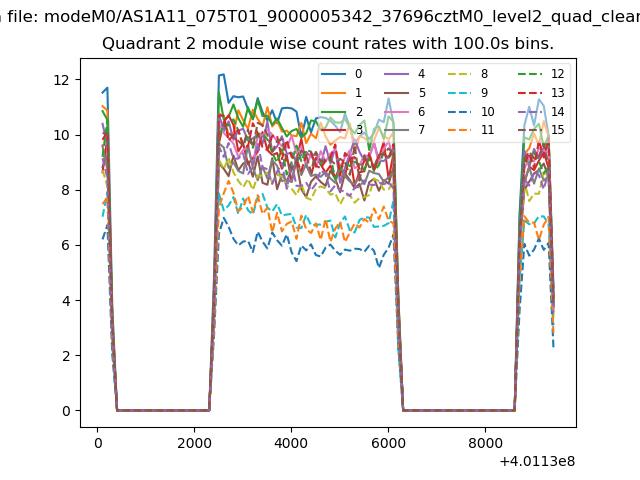
| Module-wise count rates for Quadrant B Data is divided into 100 sec bins |
 |
 |
| Module-wise count rates for Quadrant C Data is divided into 100 sec bins |
 |
 |
| Module-wise count rates for Quadrant D Data is divided into 100 sec bins |
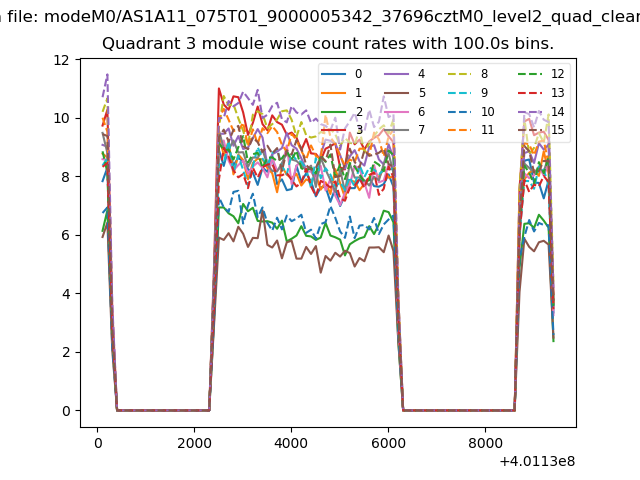 |
 |
| Parameter | Plot |
|---|---|
| CZT HV Monitor | 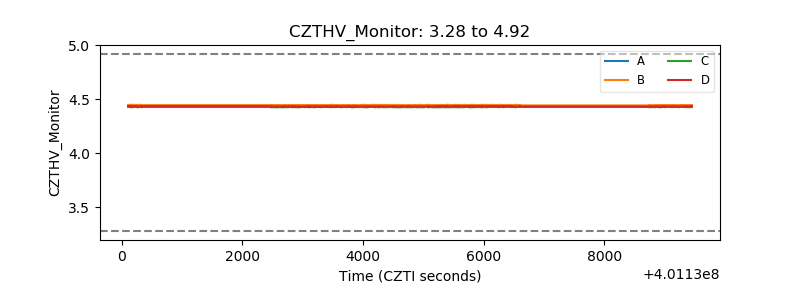 |
| D_VDD | 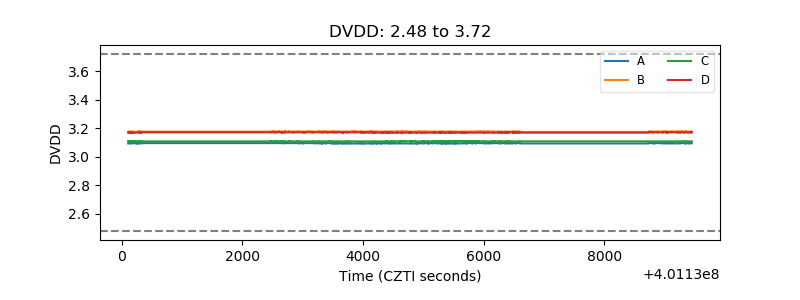 |
| Temperature 1 | 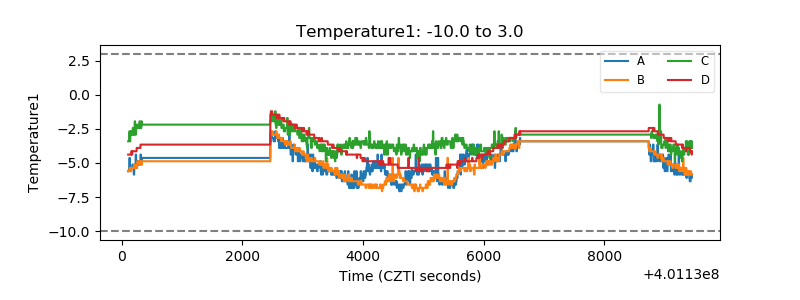 |
| Veto HV Monitor | 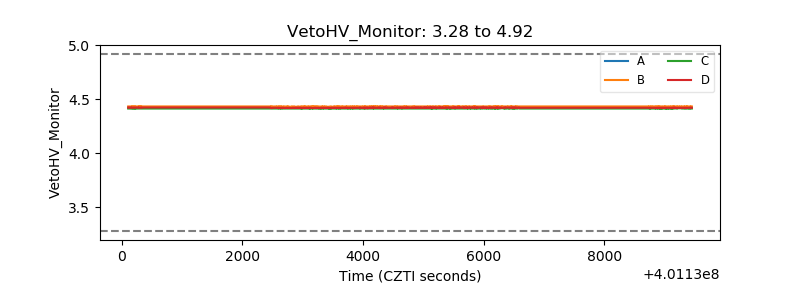 |
| Veto LLD | 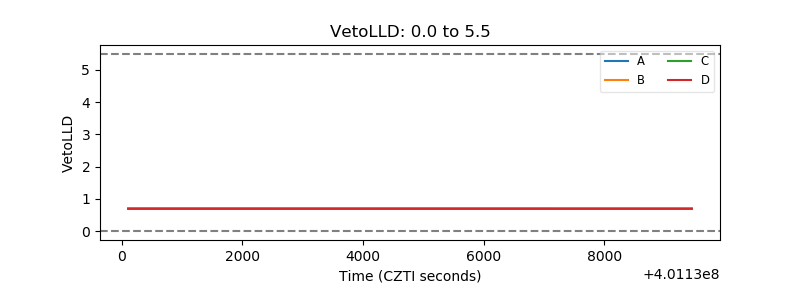 |
| Alpha Counter |  |
| _CPM_Rate | 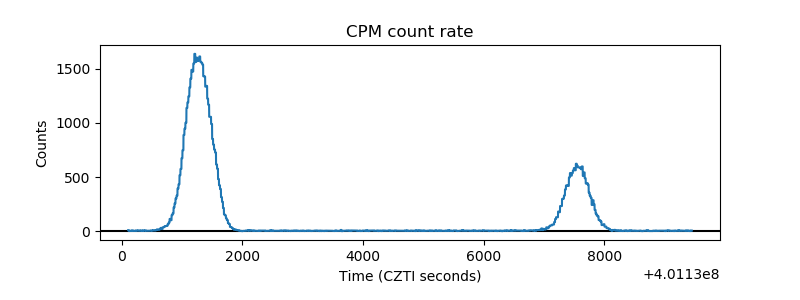 |
| CZT Counter | 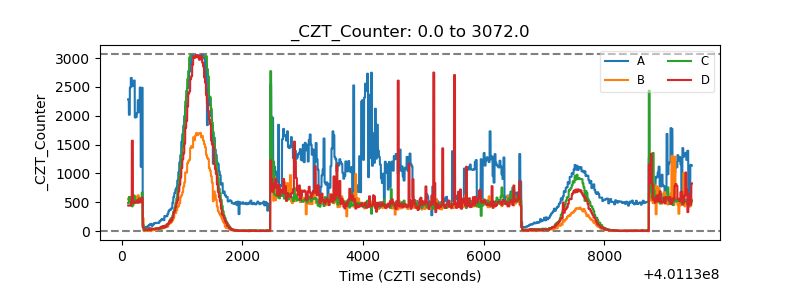 |
| +2.5 Volts monitor | 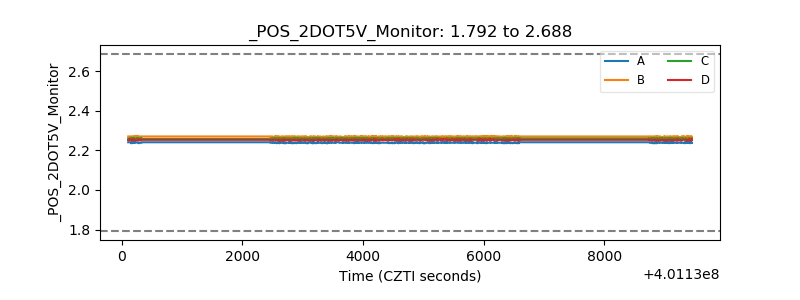 |
| +5 Volts monitor |  |
| _ROLL_ROT | 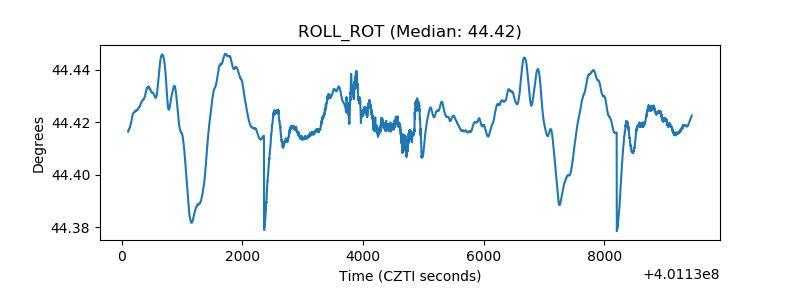 |
| _Roll_DEC | 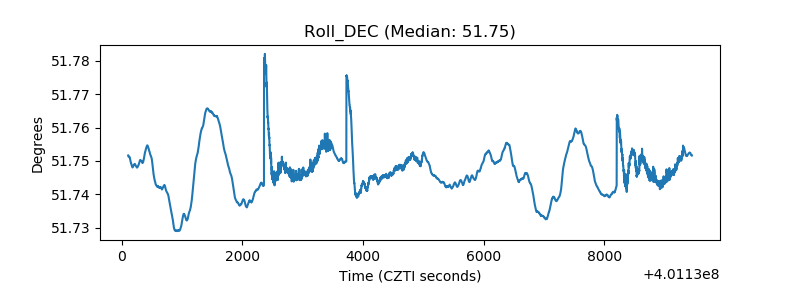 |
| _Roll_RA | 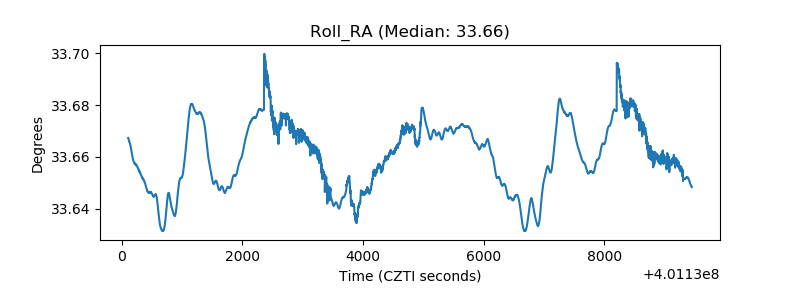 |
| Veto Counter | 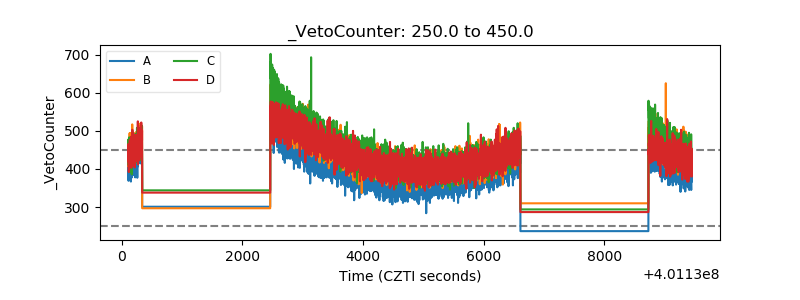 |