| Param | Original file | Final file |
|---|---|---|
| Filename | modeM0/AS1A11_075T01_9000005342_37697cztM0_level2.evt | modeM0/AS1A11_075T01_9000005342_37697cztM0_level2_quad_clean.evt |
| Size (bytes) | 466,202,880 | 79,320,960 |
| Size | 444.6 MB | 75.6 MB |
| Events in quadrant A | 4,635,138 | 501,224 |
| Events in quadrant B | 2,425,102 | 527,088 |
| Events in quadrant C | 2,512,486 | 532,684 |
| Events in quadrant D | 4,209,057 | 491,673 |
| Mode SS | |||
|---|---|---|---|
| Quadrant | BADHDUFLAG | Total packets | Discarded packets |
| A | 0 | 102 | 0 |
| B | 0 | 102 | 0 |
| C | 0 | 102 | 0 |
| D | 0 | 102 | 0 |
| Mode M0 | |||
|---|---|---|---|
| Quadrant | BADHDUFLAG | Total packets | Discarded packets |
| A | 0 | 17266 | 3 |
| B | 0 | 10478 | 2 |
| C | 0 | 10422 | 2 |
| D | 0 | 15950 | 2 |
| Mode M9 | |||
|---|---|---|---|
| Quadrant | BADHDUFLAG | Total packets | Discarded packets |
| A | 0 | 37 | 0 |
| B | 0 | 37 | 0 |
| C | 0 | 37 | 0 |
| D | 0 | 38 | 0 |
| Quadrant | Total seconds | Saturated seconds | Saturation percentage |
|---|---|---|---|
| A | 4981 | 87 | 1.746637% |
| B | 4981 | 27 | 0.542060% |
| C | 4981 | 22 | 0.441678% |
| D | 4981 | 121 | 2.429231% |
Noise dominated data is calculated using 1-second bins in cleaned event files. If a bin has >2000 counts, and if more than 50% of those come from <1% of pixels, then it is considered to be noise-dominated and hence unusable.
| Quadrant | # 1 sec bins | Bins with >0 counts | Bins with >2000 counts | High rate bins dominated by noise | Noise dominated (total time) | Noise dominated (detector-on time) | Marked lightcurve |
|---|---|---|---|---|---|---|---|
| A | 6954 | 4982 | 15 | 15 | 0.22% | 0.30% | 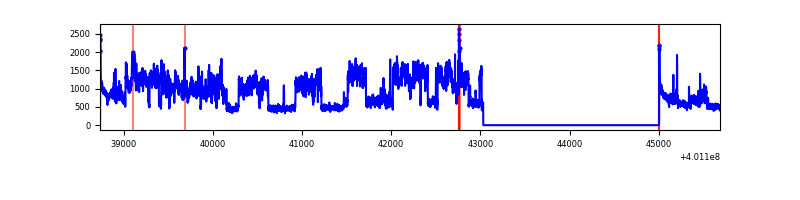 |
| B | 6953 | 4981 | 15 | 15 | 0.22% | 0.30% | 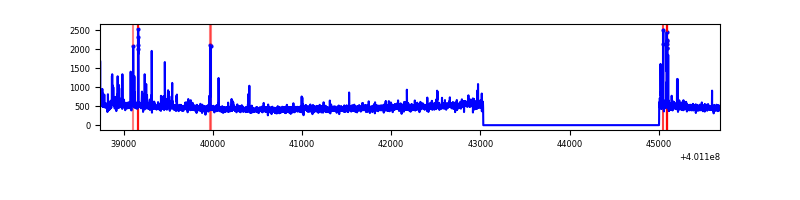 |
| C | 6953 | 4980 | 16 | 16 | 0.23% | 0.32% | 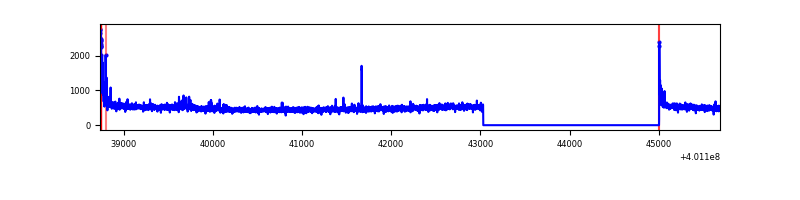 |
| D | 6953 | 4980 | 131 | 131 | 1.88% | 2.63% | 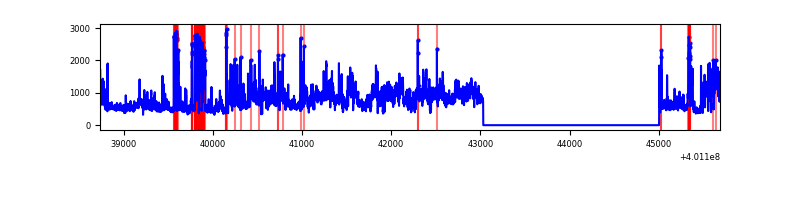 |
Top three noisy pixels from each quadrant. If the there are fewer than three noisy pixels in the level2.evt file, extra rows are filled as -1
| Pixel properties | Quadrant properties | ||||||
|---|---|---|---|---|---|---|---|
| Quadrant | DetID | PixID | Counts | Sigma | Mean | Median | Sigma |
| A | 15 | 222 | 2122201 | 19194.2 | 553 | 543 | 110.5 |
| A | 10 | 83 | 295918 | 2672.2 | 553 | 543 | 110.5 |
| A | 13 | 248 | 31163 | 277.01 | 553 | 543 | 110.5 |
| B | 5 | 172 | 81223 | 748.47 | 562 | 548 | 107.8 |
| B | 0 | 230 | 34324 | 313.36 | 562 | 548 | 107.8 |
| B | 5 | 255 | 28358 | 258.01 | 562 | 548 | 107.8 |
| C | 15 | 214 | 228738 | 1771.61 | 557 | 562 | 128.8 |
| C | 0 | 10 | 83335 | 642.67 | 557 | 562 | 128.8 |
| C | 3 | 233 | 16856 | 126.51 | 557 | 562 | 128.8 |
| D | 12 | 227 | 1551078 | 11895.91 | 543 | 529 | 130.3 |
| D | 5 | 222 | 230966 | 1767.93 | 543 | 529 | 130.3 |
| D | 13 | 249 | 158986 | 1215.69 | 543 | 529 | 130.3 |
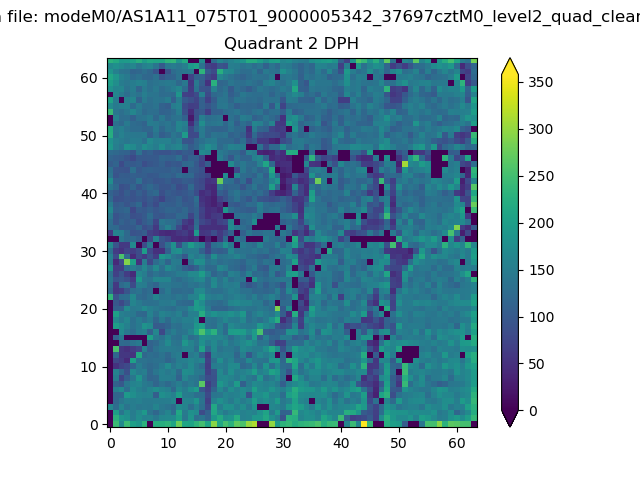
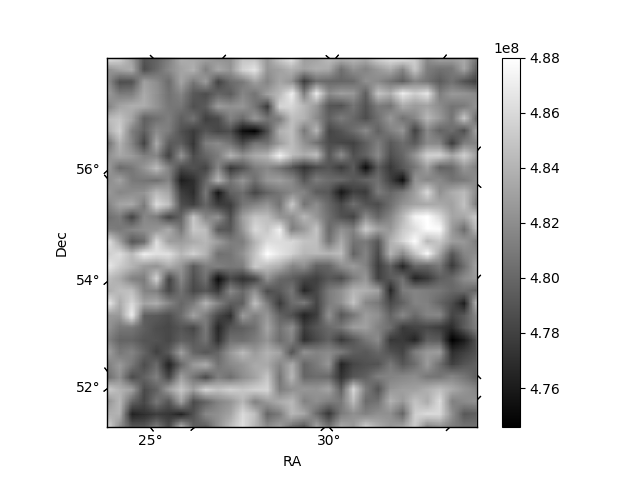
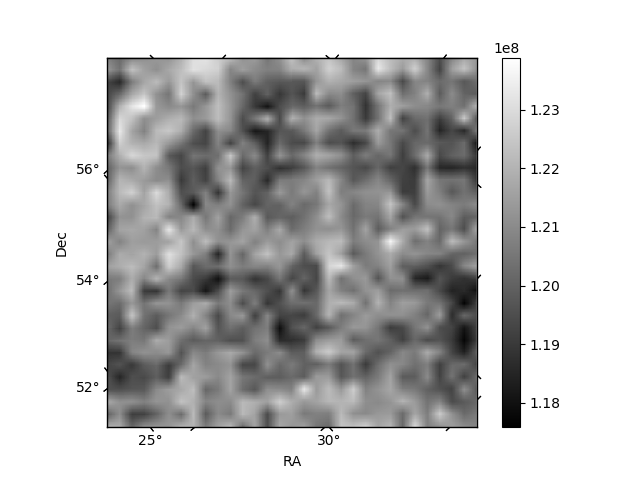
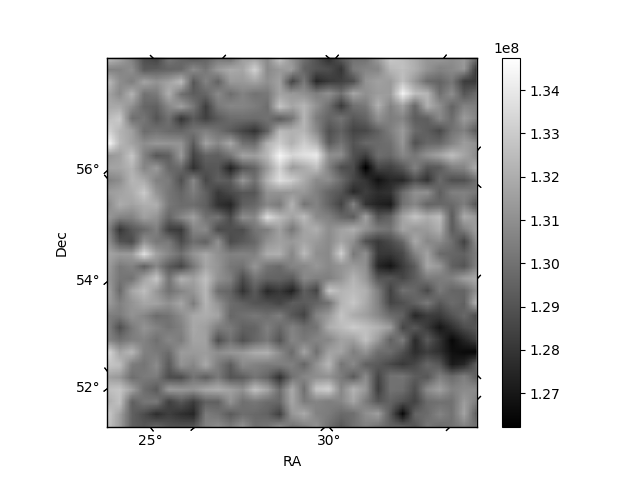
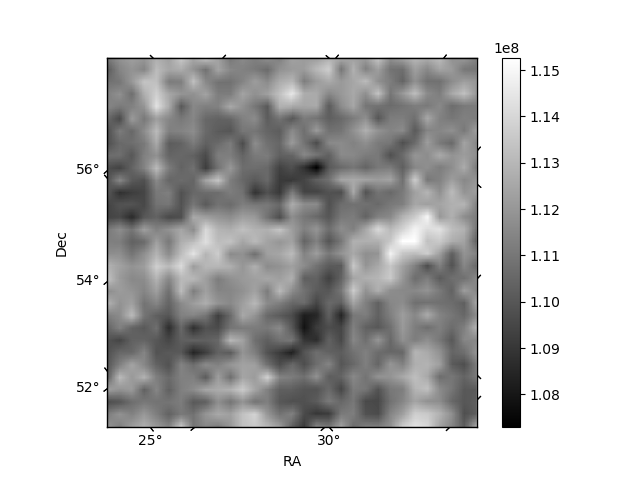
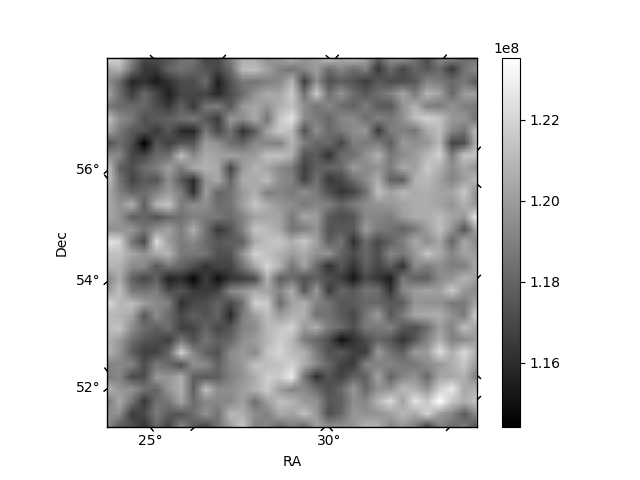
Histogram calculated using DETX and DETY for each event in the final _common_clean file
| Quadrant A | 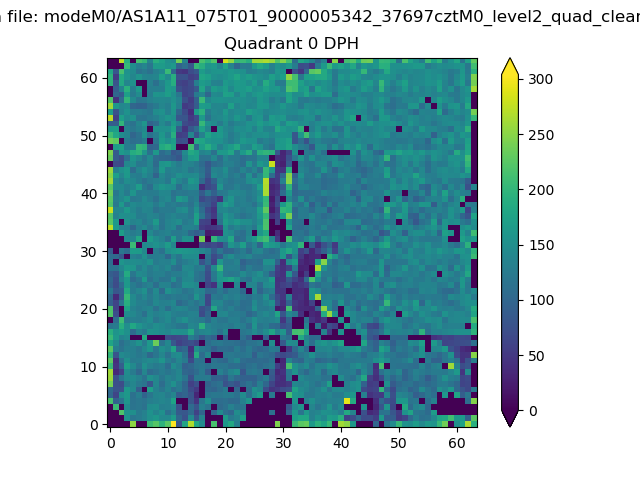 |
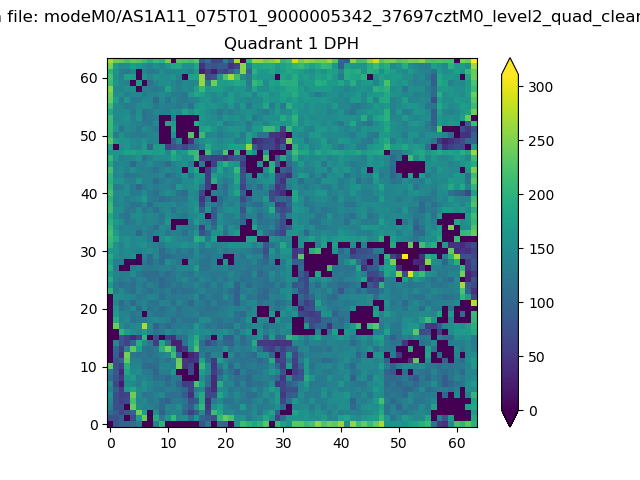 |
Quadrant B |
|---|---|---|---|
| Quadrant D | 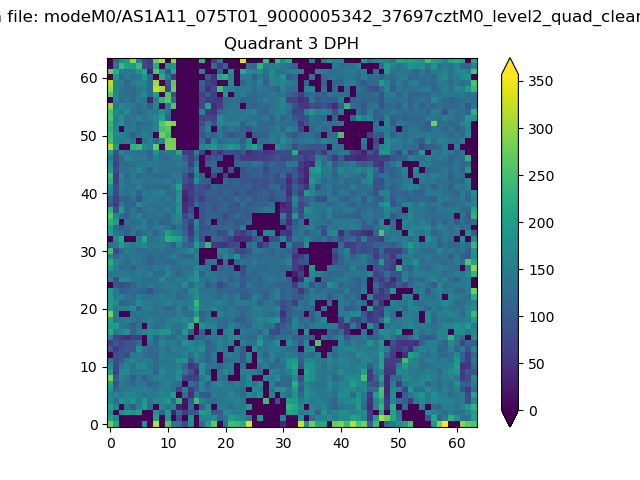 |
 |
Quadrant C |
| Plot type | Count rate plots | Images |
|---|---|---|
| Comparison with Poisson distribution Blue bars denote a histogram of data divided into 1 sec bins. Red curve is a Poisson curve with rate = median count rate of data. |
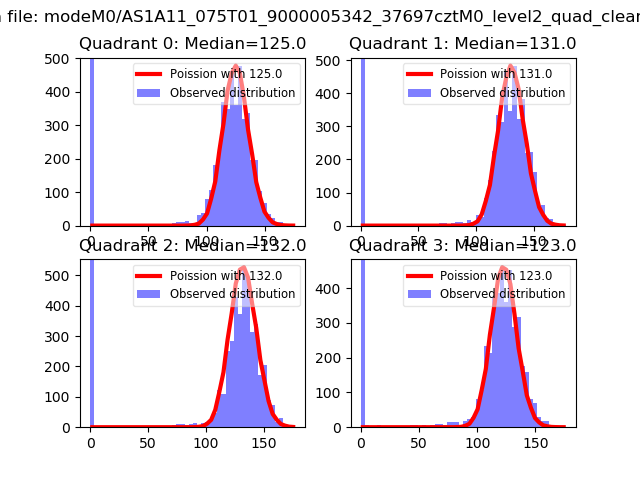 |
 |
| Quadrant-wise count rates Data is divided into 100 sec bins |
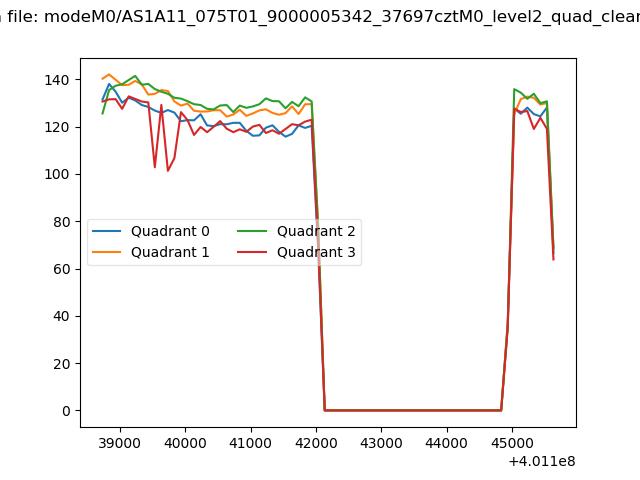 |
|
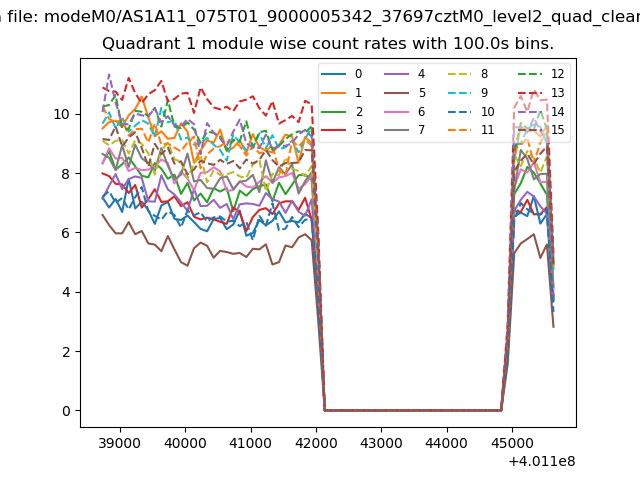
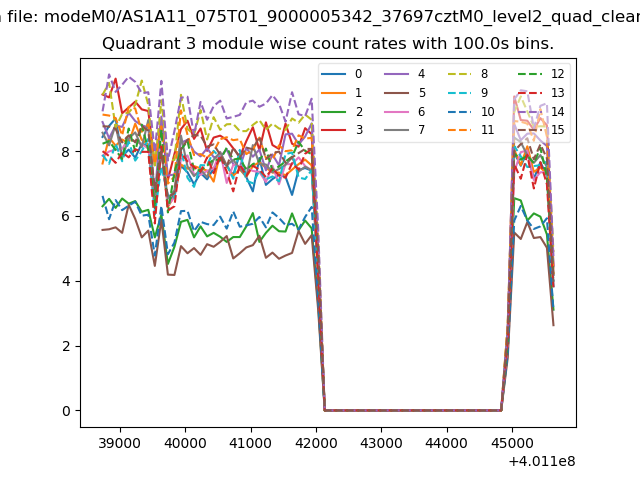
| Module-wise count rates for Quadrant A Data is divided into 100 sec bins |
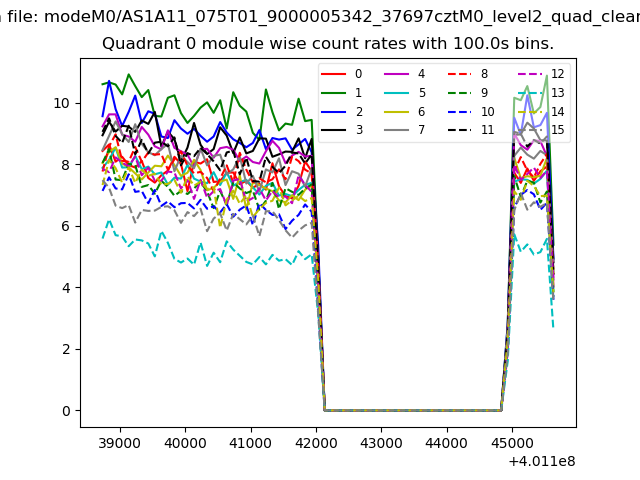 |
 |
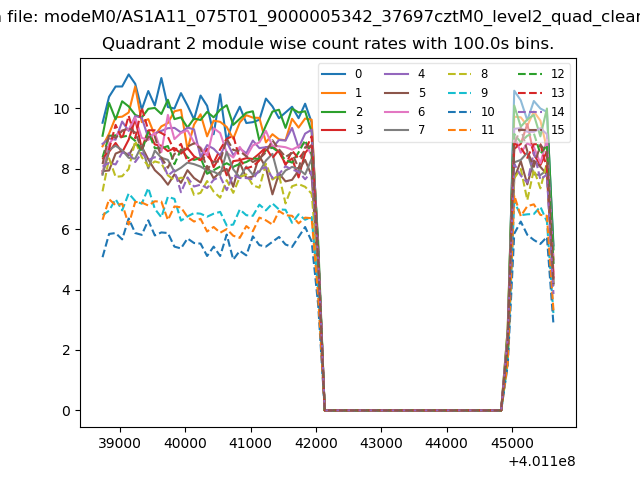
| Module-wise count rates for Quadrant B Data is divided into 100 sec bins |
 |
 |
| Module-wise count rates for Quadrant C Data is divided into 100 sec bins |
 |
 |
| Module-wise count rates for Quadrant D Data is divided into 100 sec bins |
 |
 |
| Parameter | Plot |
|---|---|
| CZT HV Monitor | 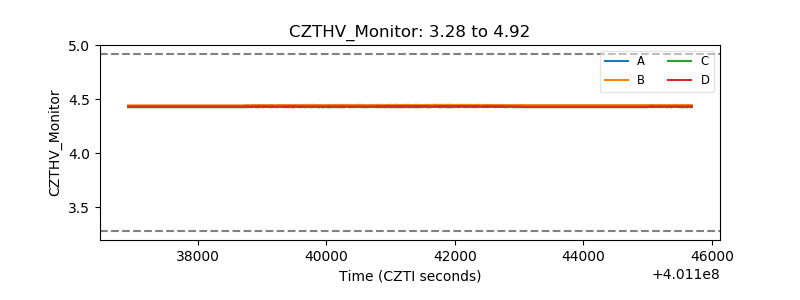 |
| D_VDD | 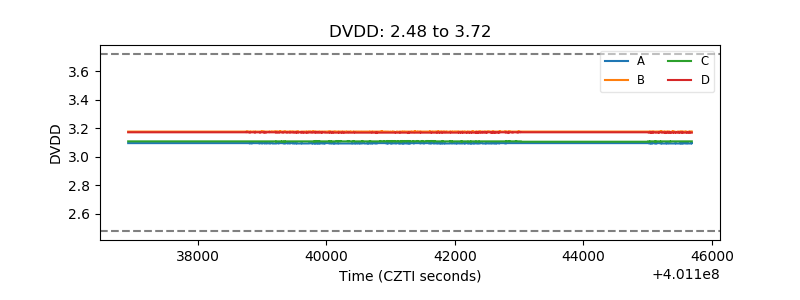 |
| Temperature 1 | 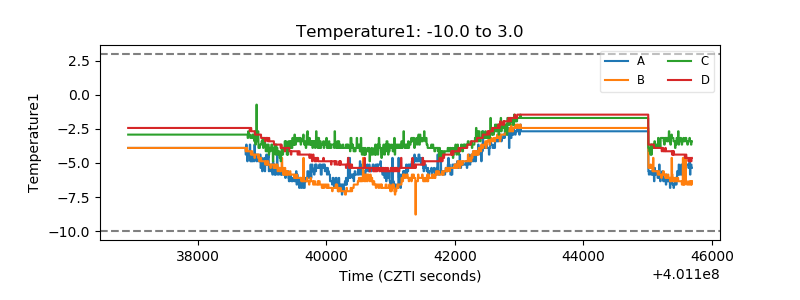 |
| Veto HV Monitor | 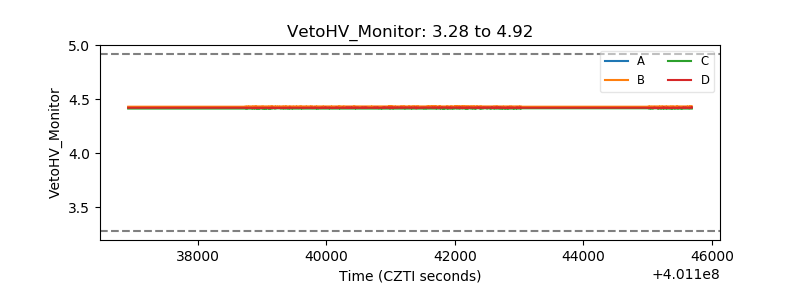 |
| Veto LLD | 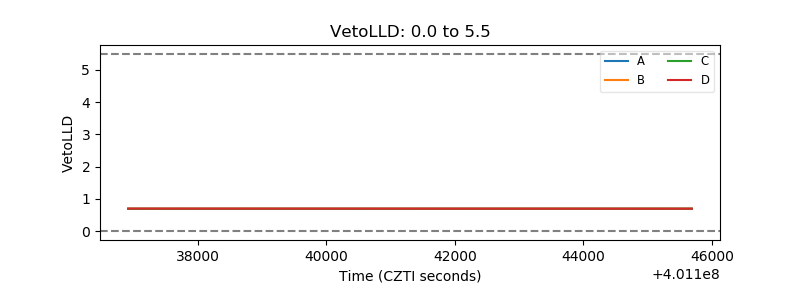 |
| Alpha Counter | 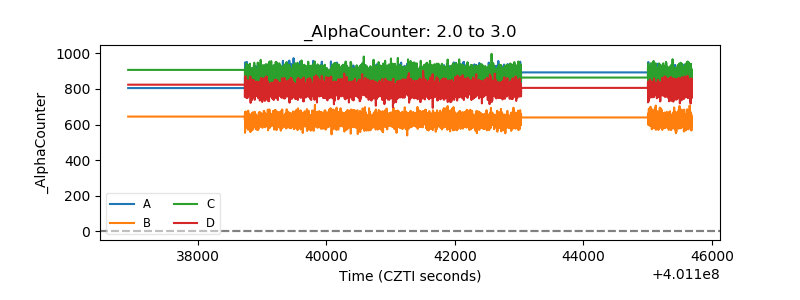 |
| _CPM_Rate | 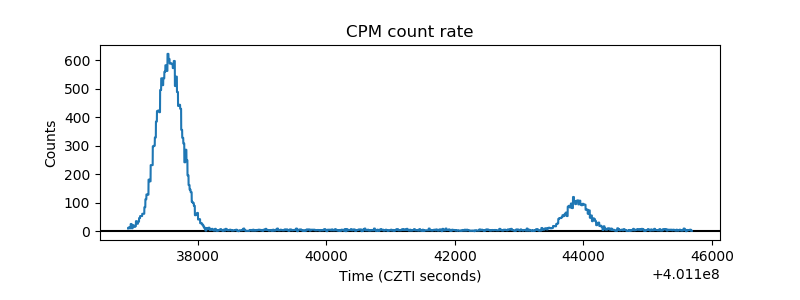 |
| CZT Counter | 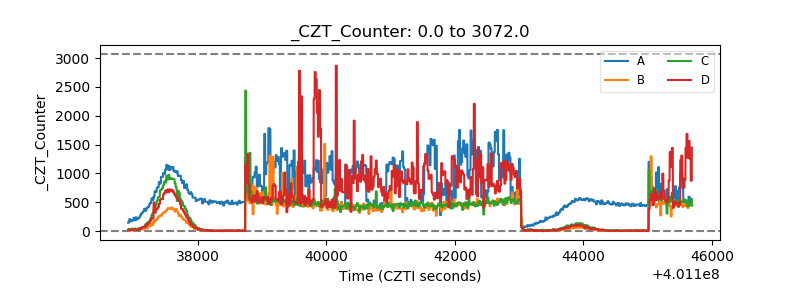 |
| +2.5 Volts monitor | 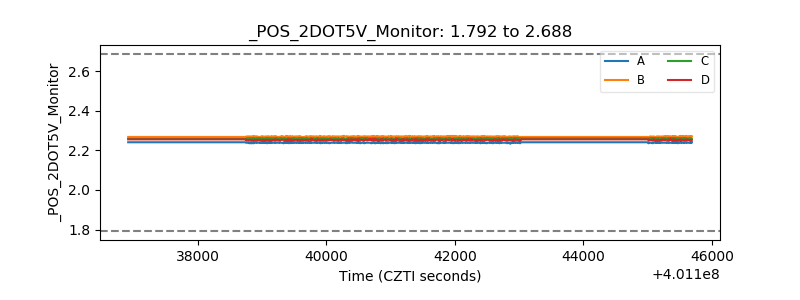 |
| +5 Volts monitor | 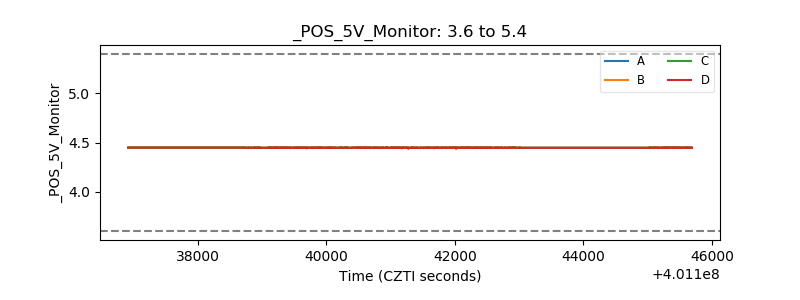 |
| _ROLL_ROT | 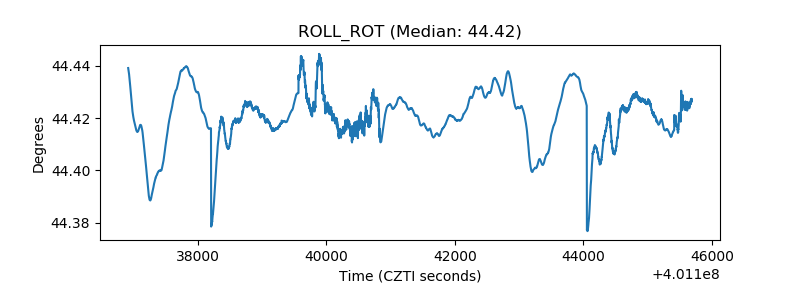 |
| _Roll_DEC | 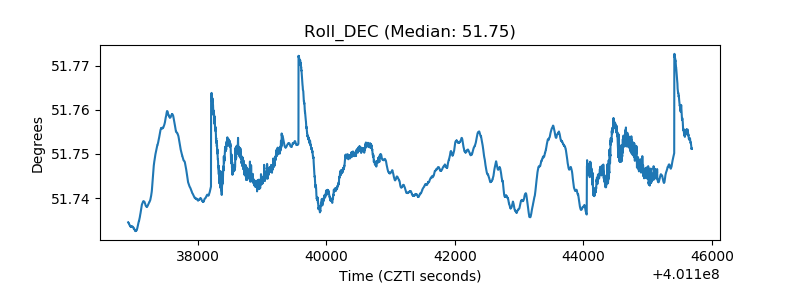 |
| _Roll_RA | 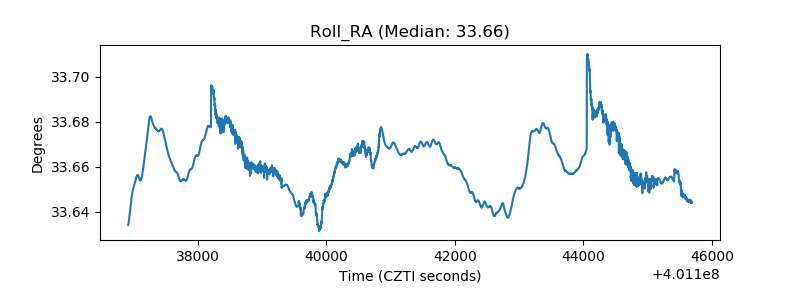 |
| Veto Counter | 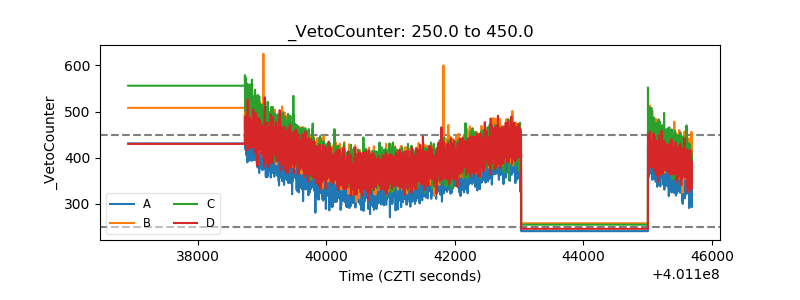 |