| Param | Original file | Final file |
|---|---|---|
| Filename | modeM0/AS1A11_075T01_9000005342_37698cztM0_level2.evt | modeM0/AS1A11_075T01_9000005342_37698cztM0_level2_quad_clean.evt |
| Size (bytes) | 551,445,120 | 74,269,440 |
| Size | 525.9 MB | 70.8 MB |
| Events in quadrant A | 4,521,385 | 447,477 |
| Events in quadrant B | 3,103,907 | 464,058 |
| Events in quadrant C | 3,172,554 | 471,145 |
| Events in quadrant D | 5,474,586 | 424,809 |
| Mode SS | |||
|---|---|---|---|
| Quadrant | BADHDUFLAG | Total packets | Discarded packets |
| A | 0 | 132 | 0 |
| B | 0 | 132 | 0 |
| C | 0 | 132 | 0 |
| D | 0 | 132 | 0 |
| Mode M0 | |||
|---|---|---|---|
| Quadrant | BADHDUFLAG | Total packets | Discarded packets |
| A | 0 | 17895 | 3 |
| B | 0 | 13419 | 2 |
| C | 0 | 13239 | 2 |
| D | 0 | 20693 | 2 |
| Mode M9 | |||
|---|---|---|---|
| Quadrant | BADHDUFLAG | Total packets | Discarded packets |
| A | 0 | 35 | 0 |
| B | 0 | 35 | 0 |
| C | 0 | 35 | 0 |
| D | 0 | 35 | 0 |
| Quadrant | Total seconds | Saturated seconds | Saturation percentage |
|---|---|---|---|
| A | 6317 | 106 | 1.678012% |
| B | 6317 | 73 | 1.155612% |
| C | 6317 | 25 | 0.395757% |
| D | 6317 | 411 | 6.506253% |
Noise dominated data is calculated using 1-second bins in cleaned event files. If a bin has >2000 counts, and if more than 50% of those come from <1% of pixels, then it is considered to be noise-dominated and hence unusable.
| Quadrant | # 1 sec bins | Bins with >0 counts | Bins with >2000 counts | High rate bins dominated by noise | Noise dominated (total time) | Noise dominated (detector-on time) | Marked lightcurve |
|---|---|---|---|---|---|---|---|
| A | 9901 | 6318 | 34 | 34 | 0.34% | 0.54% | 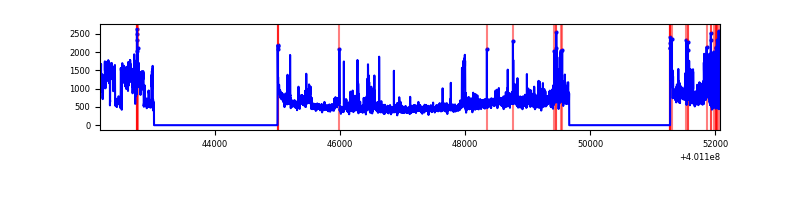 |
| B | 9901 | 6317 | 57 | 57 | 0.58% | 0.90% | 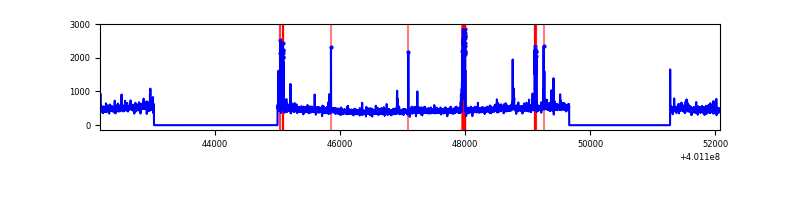 |
| C | 9901 | 6316 | 22 | 22 | 0.22% | 0.35% | 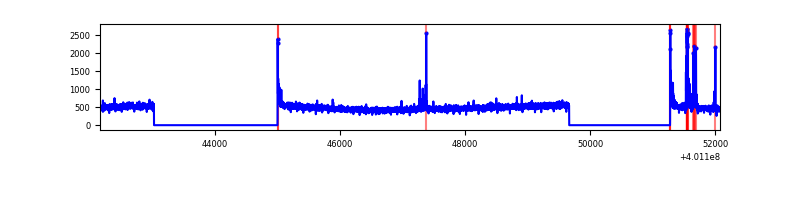 |
| D | 9902 | 6317 | 475 | 475 | 4.80% | 7.52% | 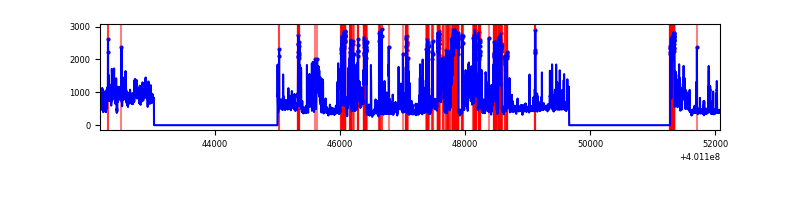 |
Top three noisy pixels from each quadrant. If the there are fewer than three noisy pixels in the level2.evt file, extra rows are filled as -1
| Pixel properties | Quadrant properties | ||||||
|---|---|---|---|---|---|---|---|
| Quadrant | DetID | PixID | Counts | Sigma | Mean | Median | Sigma |
| A | 15 | 222 | 1224069 | 8627.5 | 710 | 696 | 141.8 |
| A | 10 | 83 | 337493 | 2375.17 | 710 | 696 | 141.8 |
| A | 13 | 248 | 139947 | 982.03 | 710 | 696 | 141.8 |
| B | 5 | 172 | 168925 | 1240.68 | 711 | 691 | 135.6 |
| B | 5 | 255 | 50443 | 366.91 | 711 | 691 | 135.6 |
| B | 0 | 230 | 37372 | 270.51 | 711 | 691 | 135.6 |
| C | 15 | 214 | 284832 | 1760.98 | 700 | 705 | 161.3 |
| C | 14 | 254 | 104510 | 643.37 | 700 | 705 | 161.3 |
| C | 0 | 10 | 51315 | 313.67 | 700 | 705 | 161.3 |
| D | 12 | 227 | 2375342 | 14523.97 | 681 | 662 | 163.5 |
| D | 13 | 249 | 227033 | 1384.53 | 681 | 662 | 163.5 |
| D | 7 | 38 | 66807 | 404.55 | 681 | 662 | 163.5 |
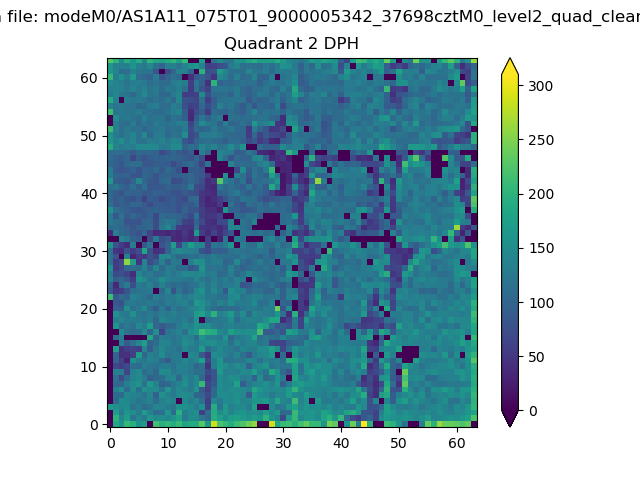
Histogram calculated using DETX and DETY for each event in the final _common_clean file
| Quadrant A | 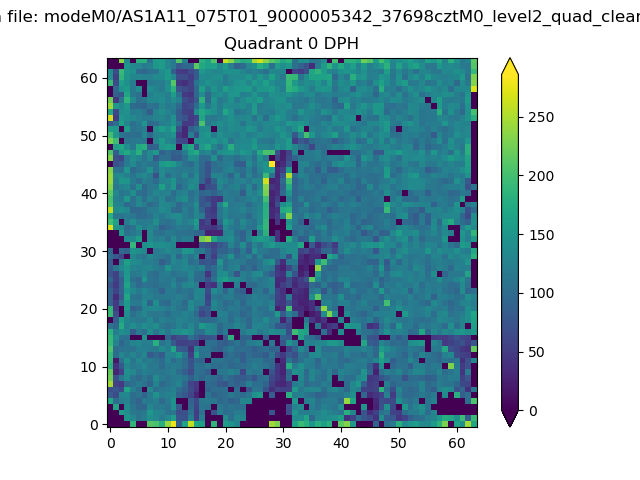 |
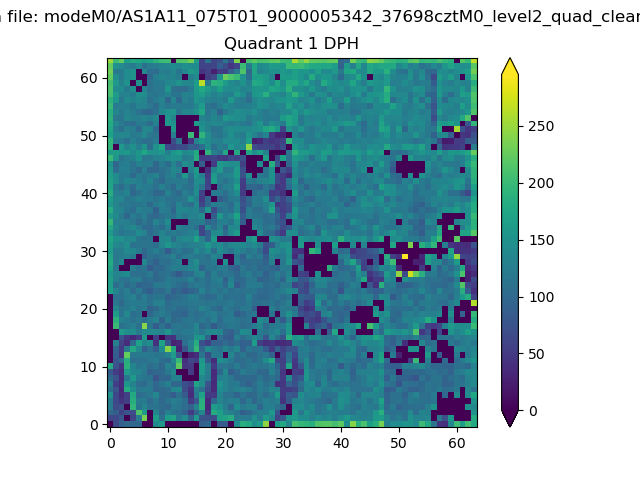 |
Quadrant B |
|---|---|---|---|
| Quadrant D | 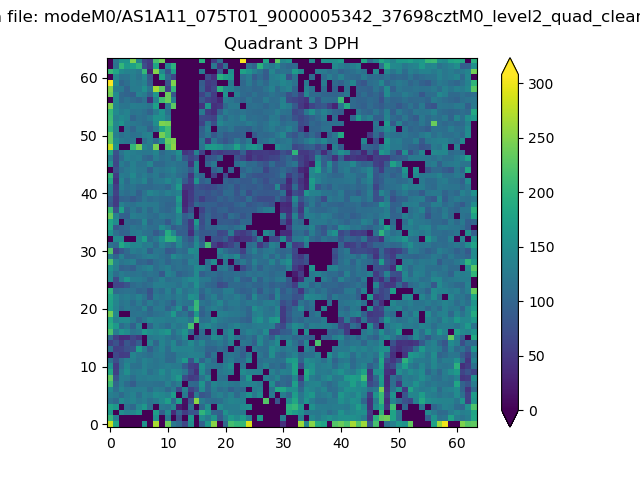 |
 |
Quadrant C |
| Plot type | Count rate plots | Images |
|---|---|---|
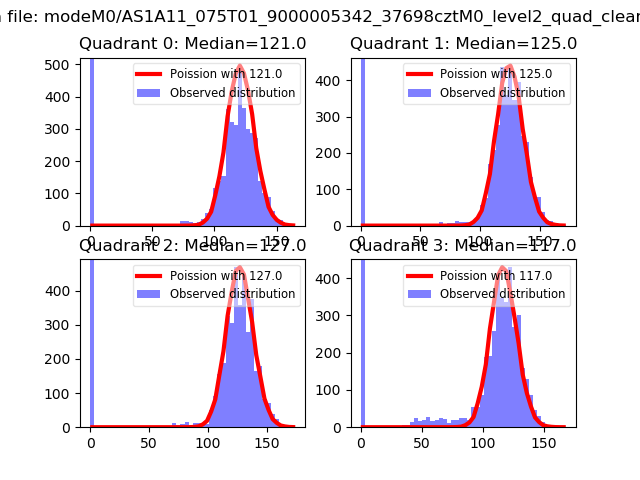
| Comparison with Poisson distribution Blue bars denote a histogram of data divided into 1 sec bins. Red curve is a Poisson curve with rate = median count rate of data. |
 |
 |
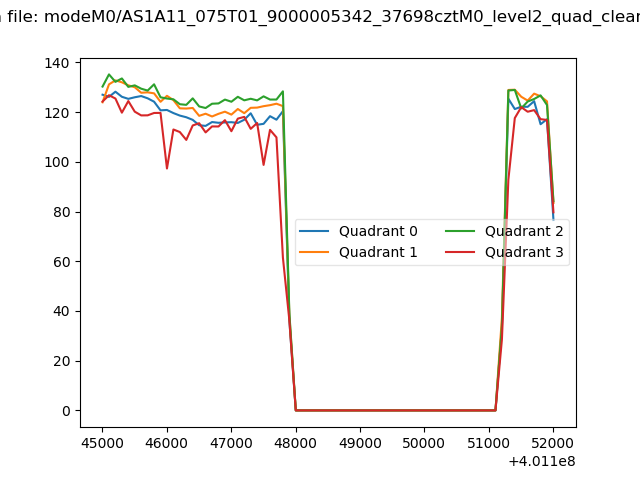
| Quadrant-wise count rates Data is divided into 100 sec bins |
 |
|
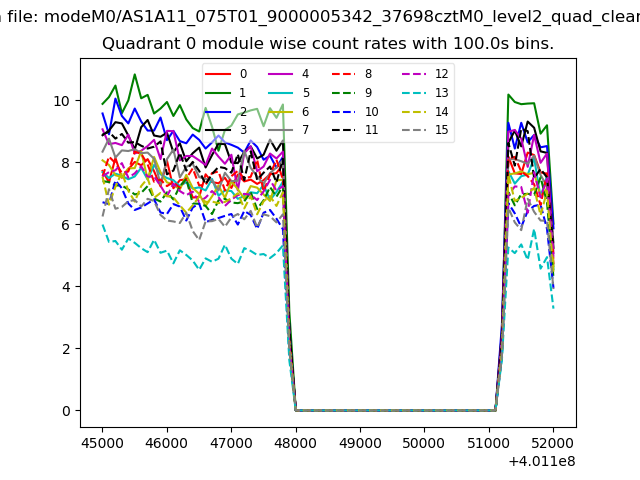
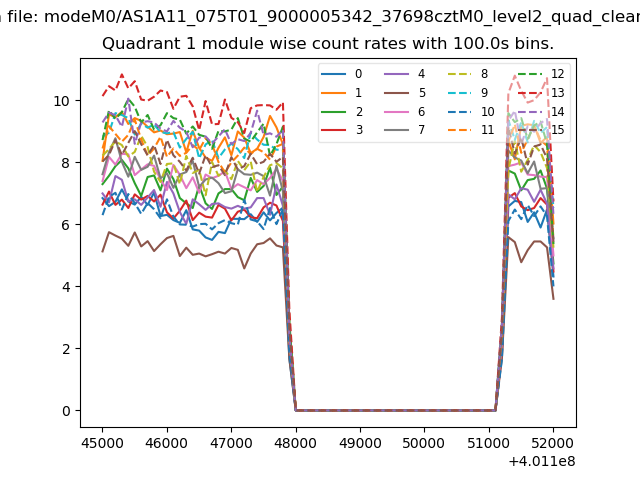
| Module-wise count rates for Quadrant A Data is divided into 100 sec bins |
 |
 |
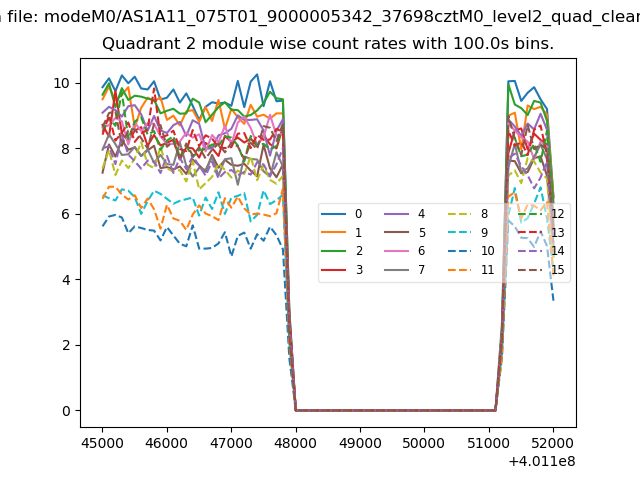
| Module-wise count rates for Quadrant B Data is divided into 100 sec bins |
 |
 |
| Module-wise count rates for Quadrant C Data is divided into 100 sec bins |
 |
 |
| Module-wise count rates for Quadrant D Data is divided into 100 sec bins |
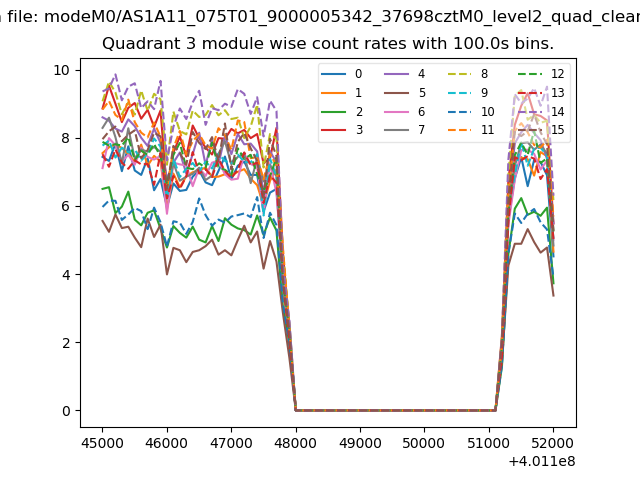 |
 |
| Parameter | Plot |
|---|---|
| CZT HV Monitor | 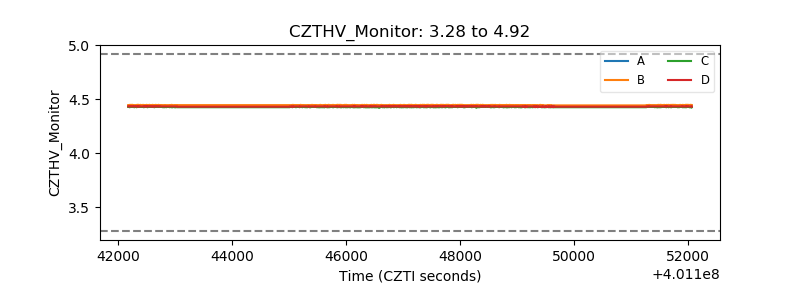 |
| D_VDD | 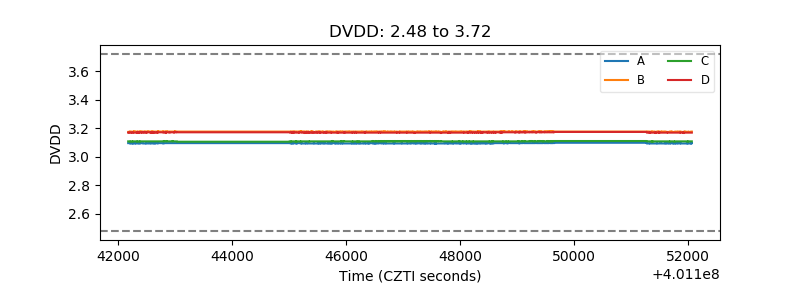 |
| Temperature 1 | 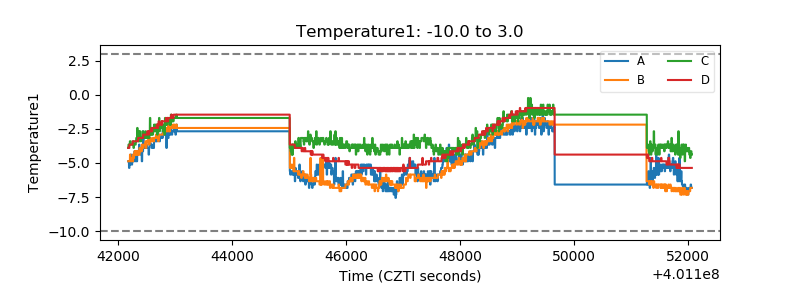 |
| Veto HV Monitor | 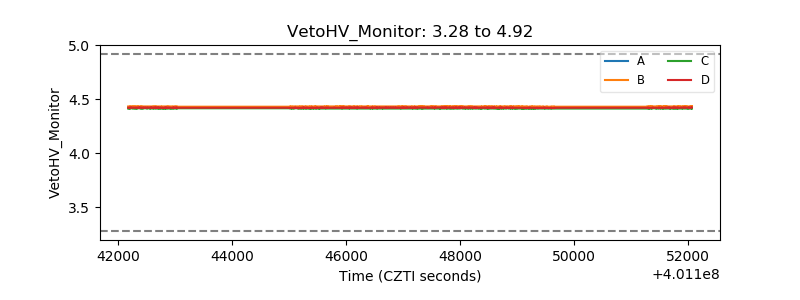 |
| Veto LLD | 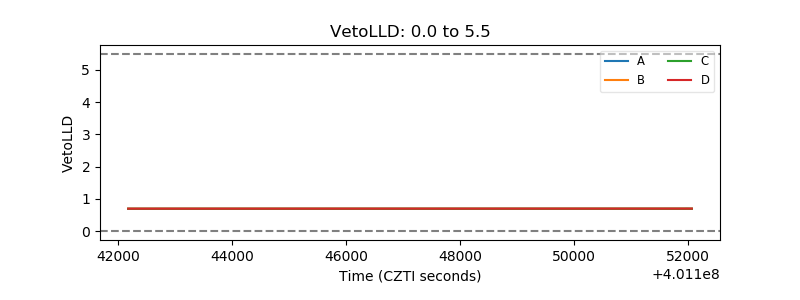 |
| Alpha Counter | 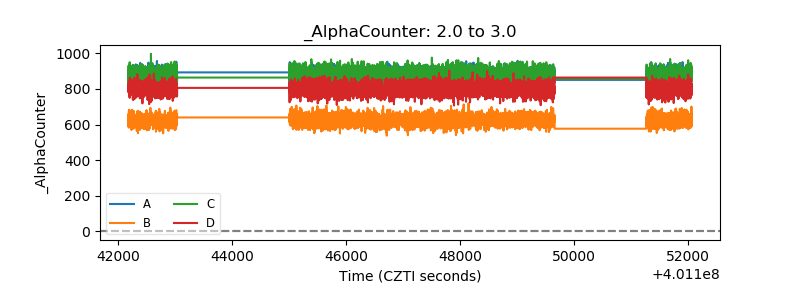 |
| _CPM_Rate | 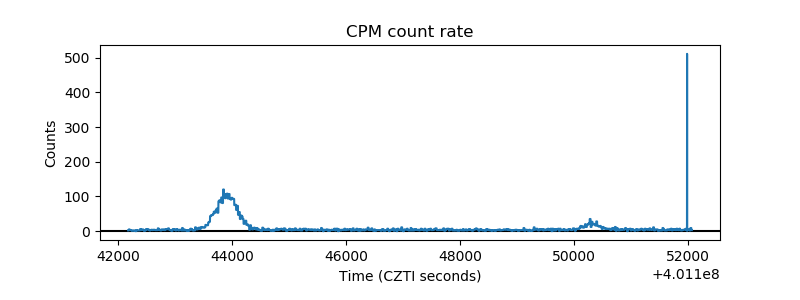 |
| CZT Counter | 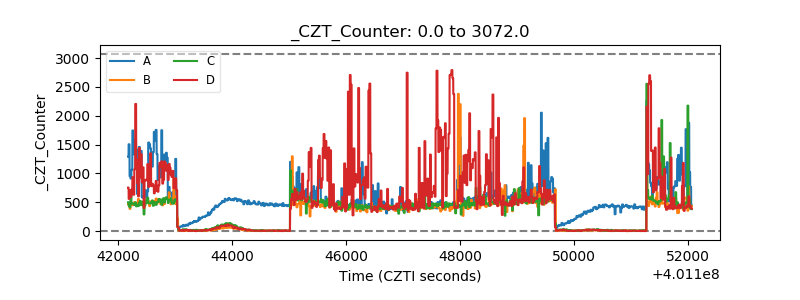 |
| +2.5 Volts monitor |  |
| +5 Volts monitor | 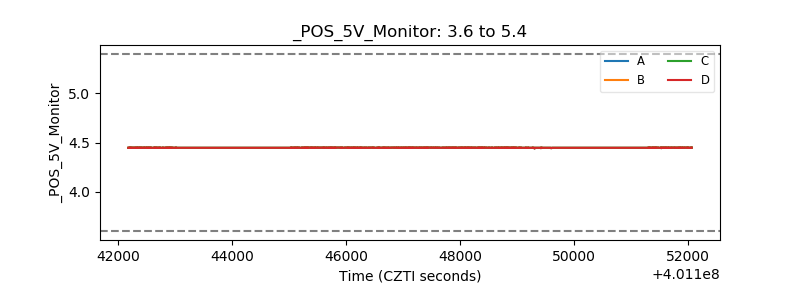 |
| _ROLL_ROT | 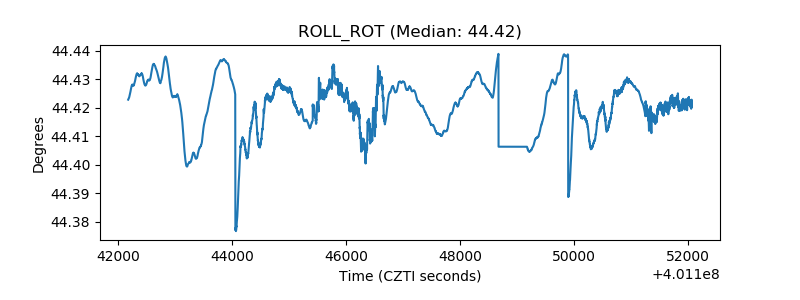 |
| _Roll_DEC | 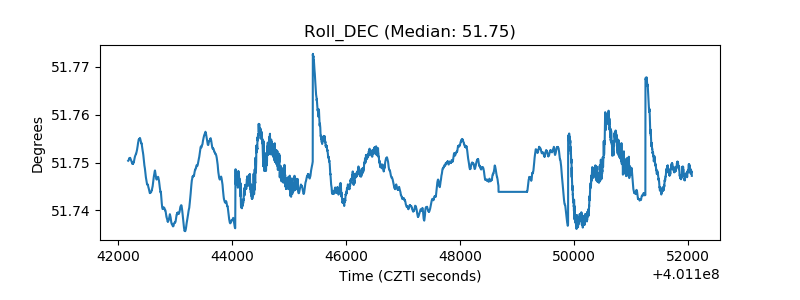 |
| _Roll_RA | 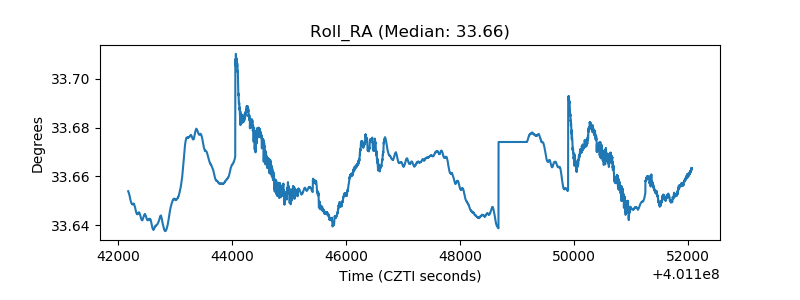 |
| Veto Counter | 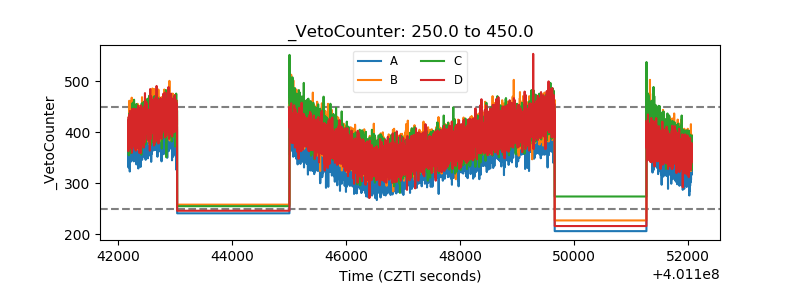 |