| Param | Original file | Final file |
|---|---|---|
| Filename | modeM0/AS1A11_075T01_9000005342_37699cztM0_level2.evt | modeM0/AS1A11_075T01_9000005342_37699cztM0_level2_quad_clean.evt |
| Size (bytes) | 595,667,520 | 75,211,200 |
| Size | 568.1 MB | 71.7 MB |
| Events in quadrant A | 5,116,067 | 451,494 |
| Events in quadrant B | 3,301,034 | 477,821 |
| Events in quadrant C | 3,171,949 | 483,390 |
| Events in quadrant D | 6,023,314 | 423,735 |
| Mode SS | |||
|---|---|---|---|
| Quadrant | BADHDUFLAG | Total packets | Discarded packets |
| A | 0 | 132 | 0 |
| B | 0 | 132 | 0 |
| C | 0 | 132 | 0 |
| D | 0 | 132 | 0 |
| Mode M0 | |||
|---|---|---|---|
| Quadrant | BADHDUFLAG | Total packets | Discarded packets |
| A | 0 | 19846 | 3 |
| B | 0 | 14046 | 2 |
| C | 0 | 13353 | 2 |
| D | 0 | 22438 | 2 |
| Mode M9 | |||
|---|---|---|---|
| Quadrant | BADHDUFLAG | Total packets | Discarded packets |
| A | 0 | 29 | 0 |
| B | 0 | 29 | 0 |
| C | 0 | 29 | 0 |
| D | 0 | 29 | 0 |
| Quadrant | Total seconds | Saturated seconds | Saturation percentage |
|---|---|---|---|
| A | 6306 | 321 | 5.090390% |
| B | 6306 | 110 | 1.744370% |
| C | 6306 | 28 | 0.444022% |
| D | 6306 | 877 | 13.907390% |
Noise dominated data is calculated using 1-second bins in cleaned event files. If a bin has >2000 counts, and if more than 50% of those come from <1% of pixels, then it is considered to be noise-dominated and hence unusable.
| Quadrant | # 1 sec bins | Bins with >0 counts | Bins with >2000 counts | High rate bins dominated by noise | Noise dominated (total time) | Noise dominated (detector-on time) | Marked lightcurve |
|---|---|---|---|---|---|---|---|
| A | 9261 | 6308 | 286 | 286 | 3.09% | 4.53% | 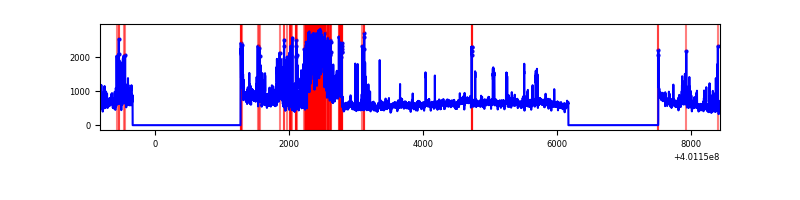 |
| B | 9260 | 6305 | 61 | 61 | 0.66% | 0.97% | 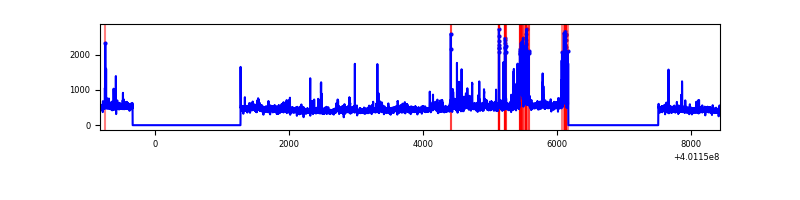 |
| C | 9260 | 6305 | 27 | 27 | 0.29% | 0.43% | 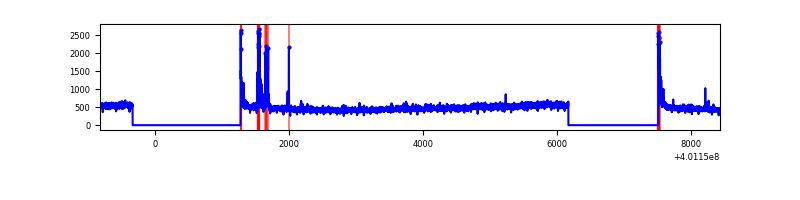 |
| D | 9261 | 6306 | 846 | 846 | 9.14% | 13.42% | 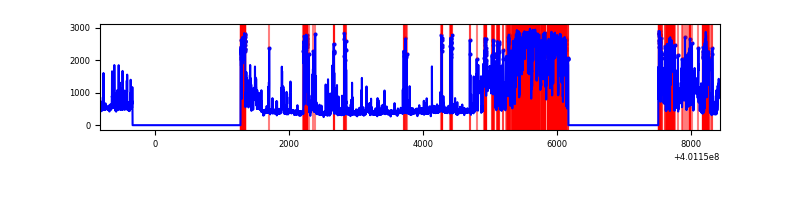 |
Top three noisy pixels from each quadrant. If the there are fewer than three noisy pixels in the level2.evt file, extra rows are filled as -1
| Pixel properties | Quadrant properties | ||||||
|---|---|---|---|---|---|---|---|
| Quadrant | DetID | PixID | Counts | Sigma | Mean | Median | Sigma |
| A | 15 | 222 | 1368041 | 9702.97 | 703 | 688 | 140.9 |
| A | 13 | 248 | 589658 | 4179.43 | 703 | 688 | 140.9 |
| A | 10 | 83 | 345859 | 2449.39 | 703 | 688 | 140.9 |
| B | 5 | 172 | 288835 | 2130.14 | 706 | 686 | 135.3 |
| B | 0 | 230 | 68079 | 498.2 | 706 | 686 | 135.3 |
| B | 5 | 200 | 49554 | 361.26 | 706 | 686 | 135.3 |
| C | 15 | 214 | 283227 | 1747.16 | 696 | 700 | 161.7 |
| C | 14 | 254 | 95951 | 589.04 | 696 | 700 | 161.7 |
| C | 0 | 10 | 79156 | 485.17 | 696 | 700 | 161.7 |
| D | 12 | 227 | 2930087 | 18612.21 | 645 | 627 | 157.4 |
| D | 13 | 249 | 356848 | 2263.24 | 645 | 627 | 157.4 |
| D | 2 | 249 | 110043 | 695.17 | 645 | 627 | 157.4 |
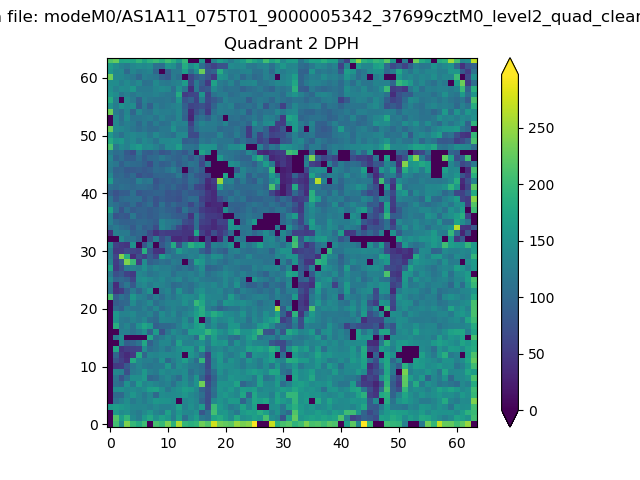
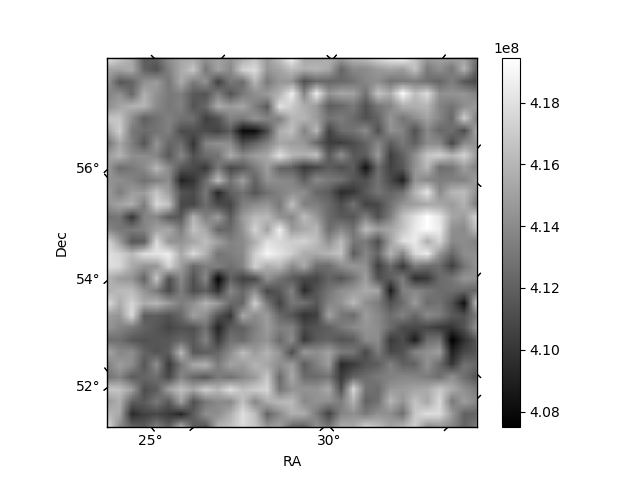
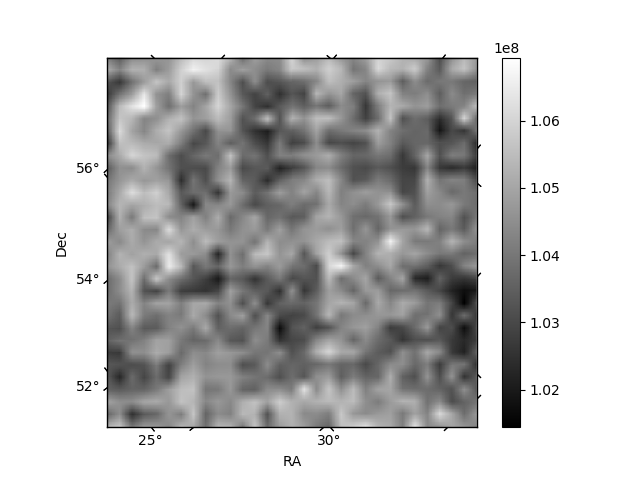
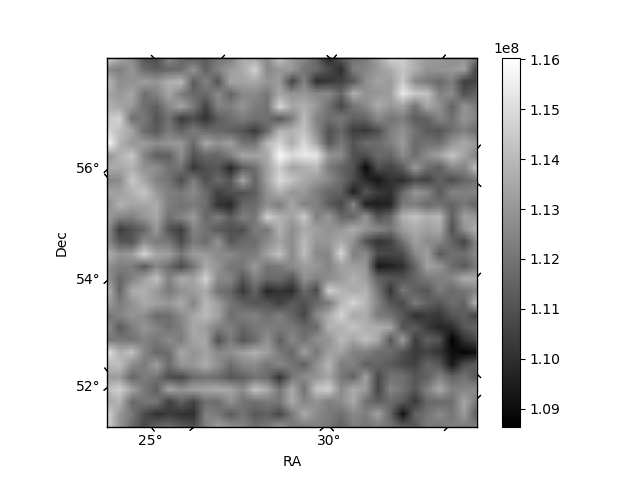
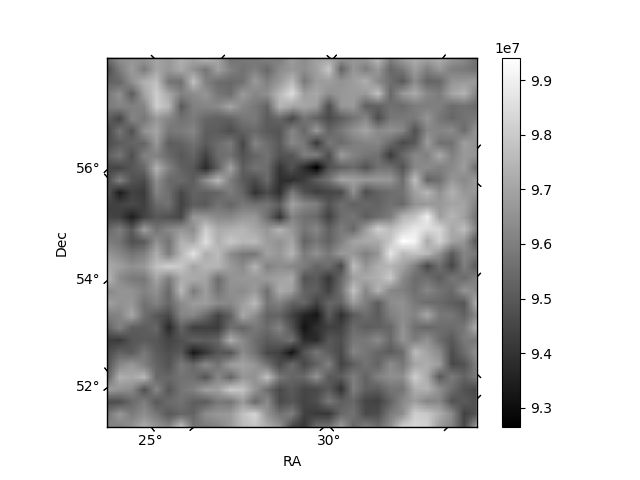
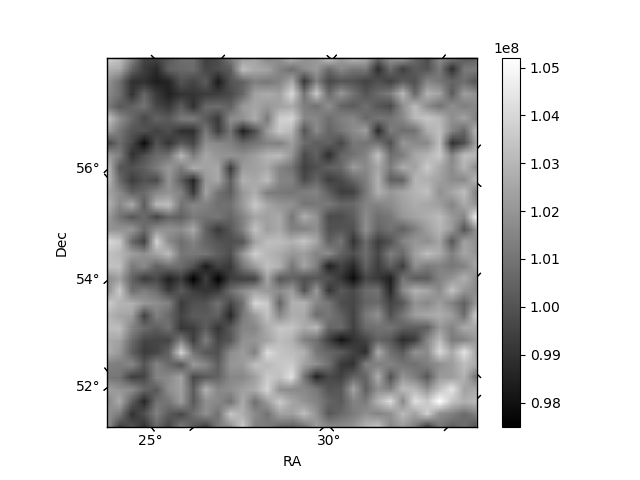
Histogram calculated using DETX and DETY for each event in the final _common_clean file
| Quadrant A | 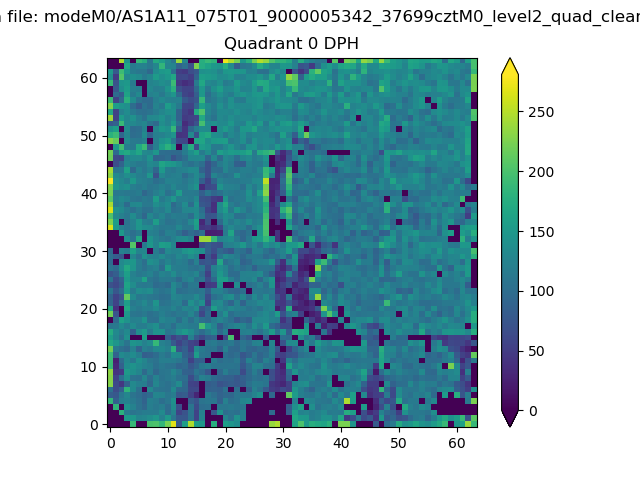 |
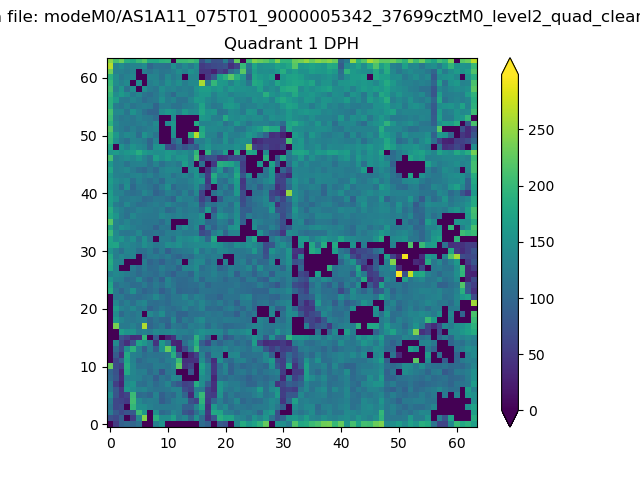 |
Quadrant B |
|---|---|---|---|
| Quadrant D | 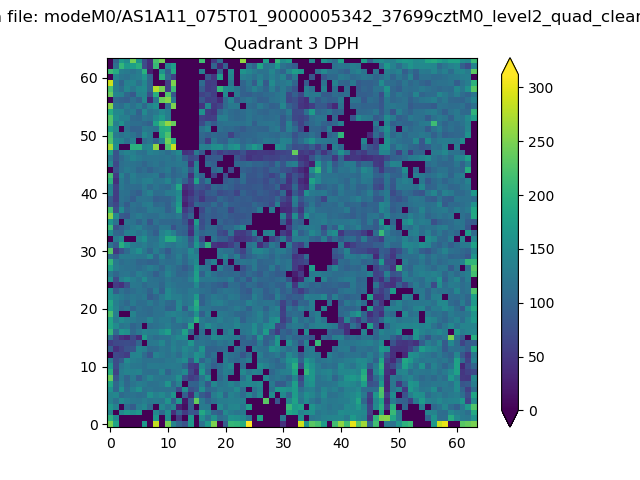 |
 |
Quadrant C |
| Plot type | Count rate plots | Images |
|---|---|---|
| Comparison with Poisson distribution Blue bars denote a histogram of data divided into 1 sec bins. Red curve is a Poisson curve with rate = median count rate of data. |
 |
 |
| Quadrant-wise count rates Data is divided into 100 sec bins |
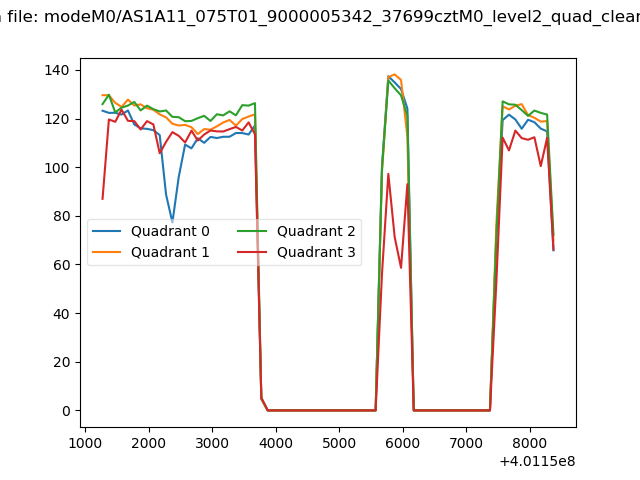 |
|
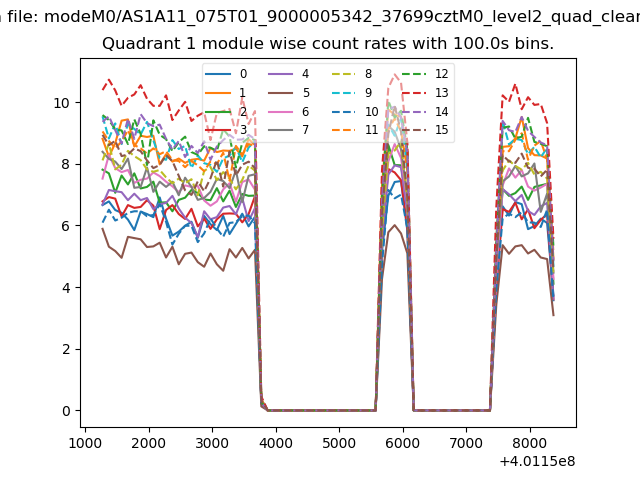
| Module-wise count rates for Quadrant A Data is divided into 100 sec bins |
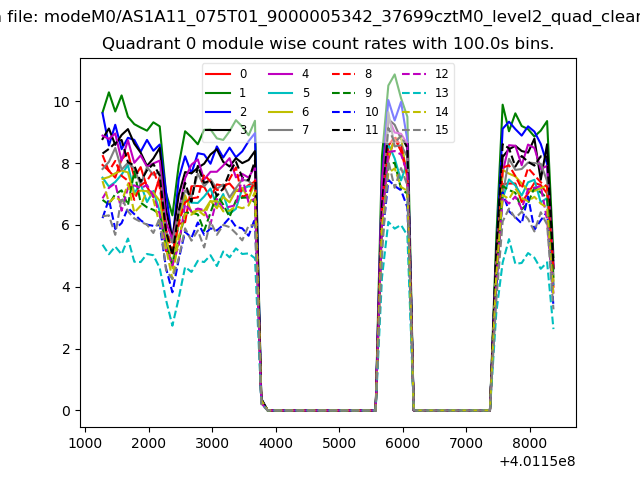 |
 |
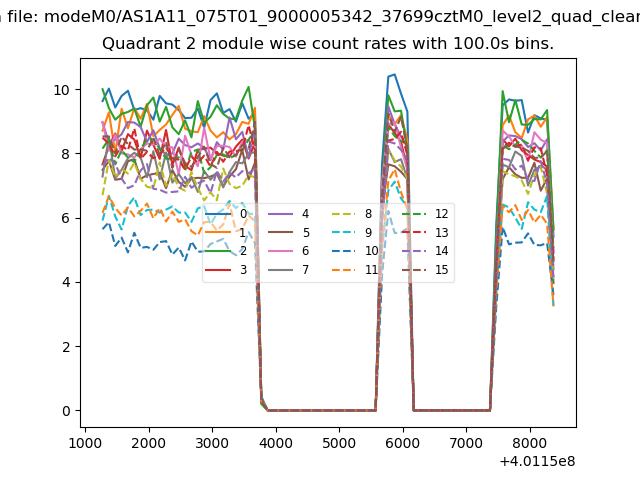
| Module-wise count rates for Quadrant B Data is divided into 100 sec bins |
 |
 |
| Module-wise count rates for Quadrant C Data is divided into 100 sec bins |
 |
 |
| Module-wise count rates for Quadrant D Data is divided into 100 sec bins |
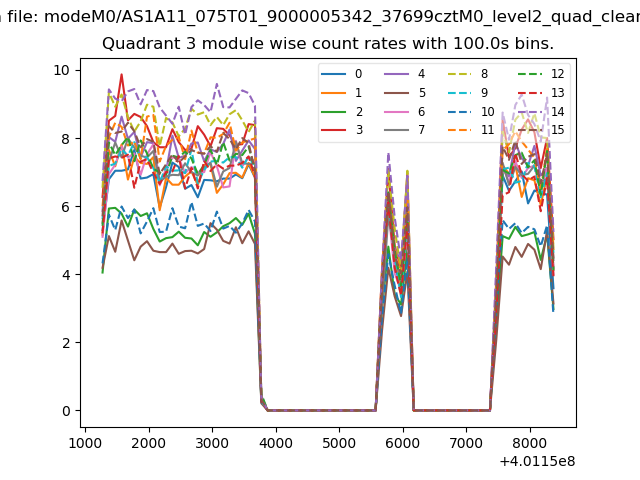 |
 |
| Parameter | Plot |
|---|---|
| CZT HV Monitor | 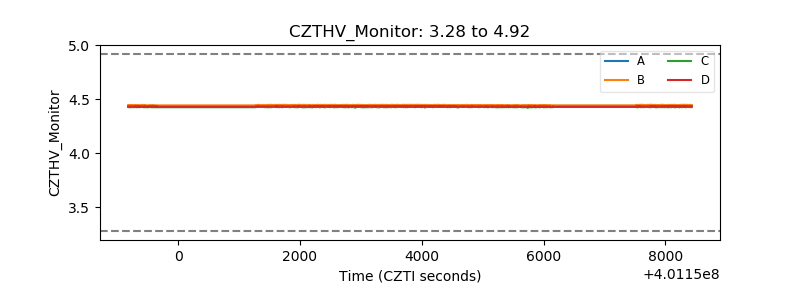 |
| D_VDD | 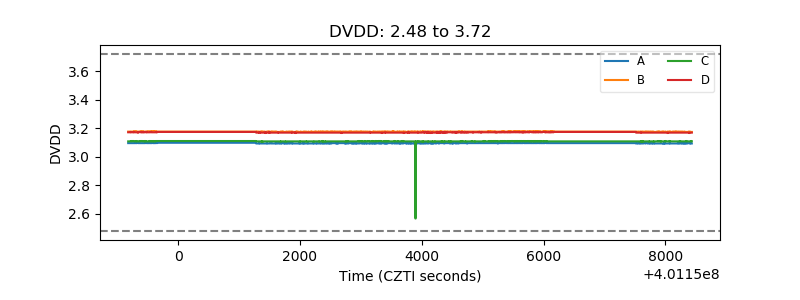 |
| Temperature 1 | 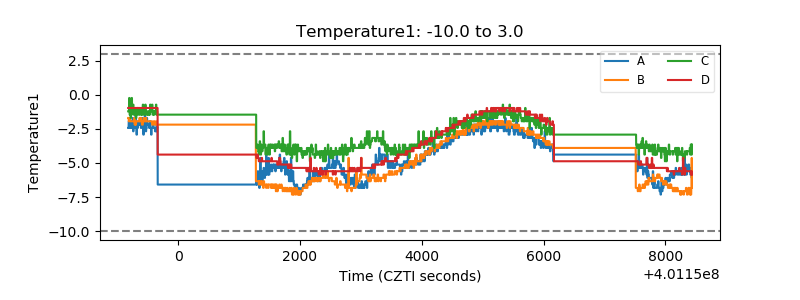 |
| Veto HV Monitor | 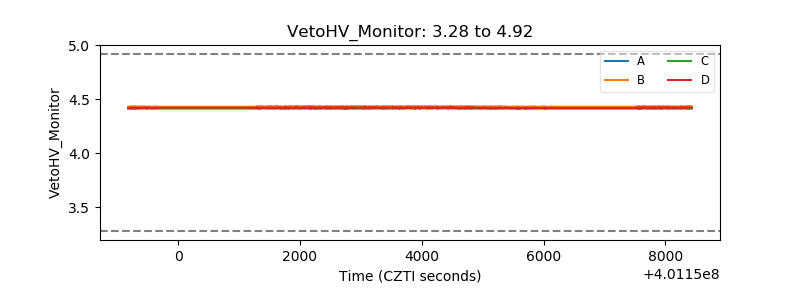 |
| Veto LLD | 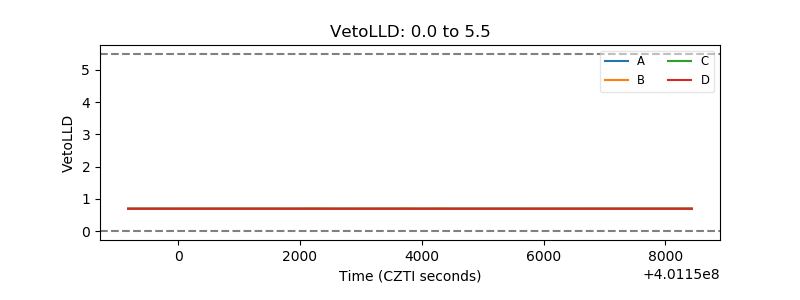 |
| Alpha Counter | 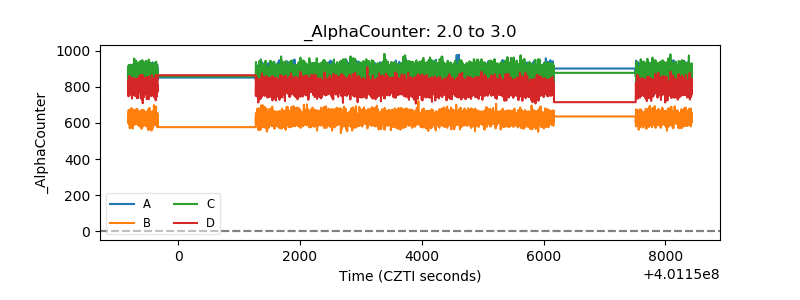 |
| _CPM_Rate | 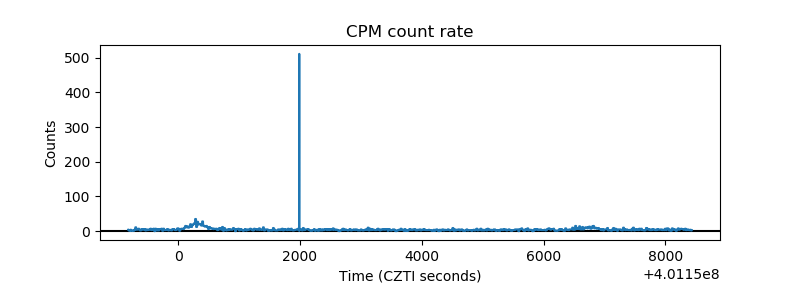 |
| CZT Counter | 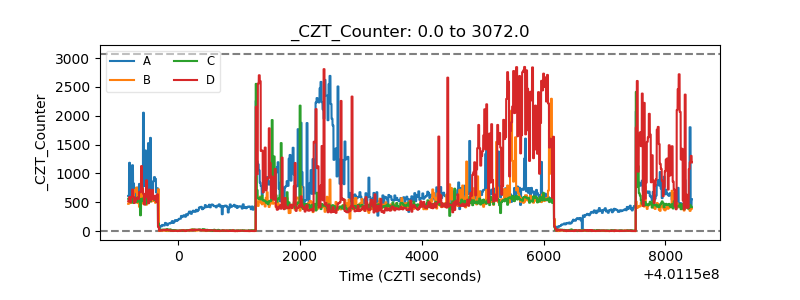 |
| +2.5 Volts monitor | 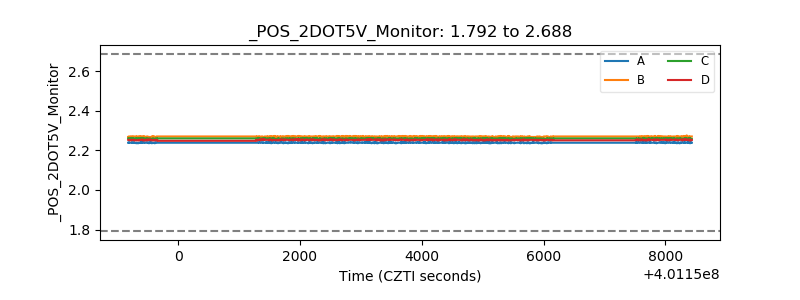 |
| +5 Volts monitor | 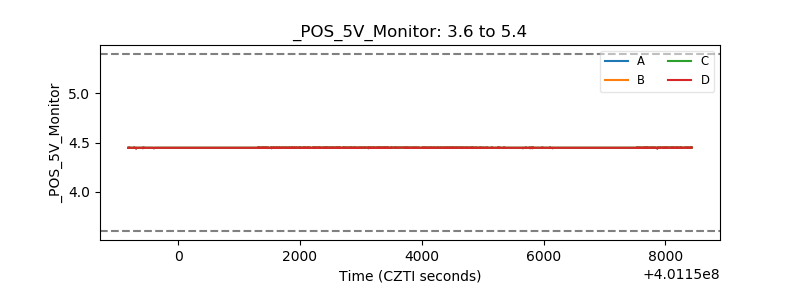 |
| _ROLL_ROT | 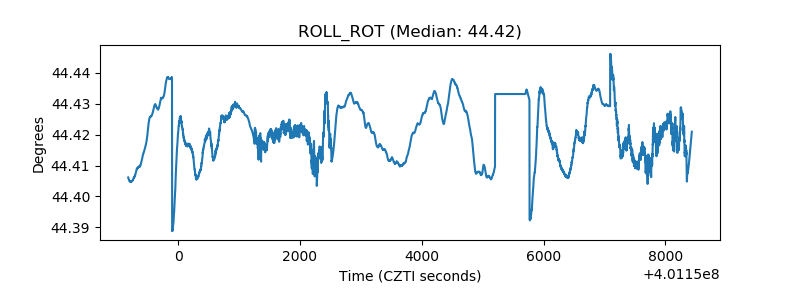 |
| _Roll_DEC | 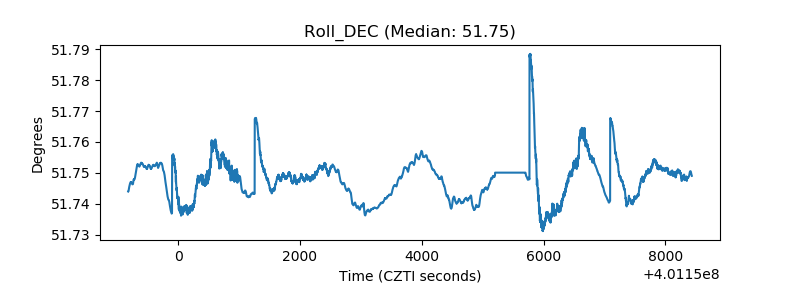 |
| _Roll_RA | 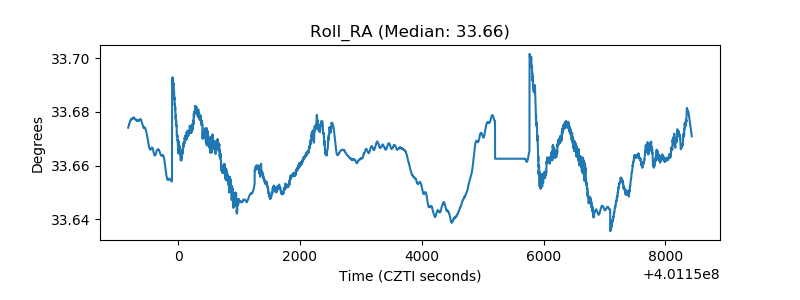 |
| Veto Counter | 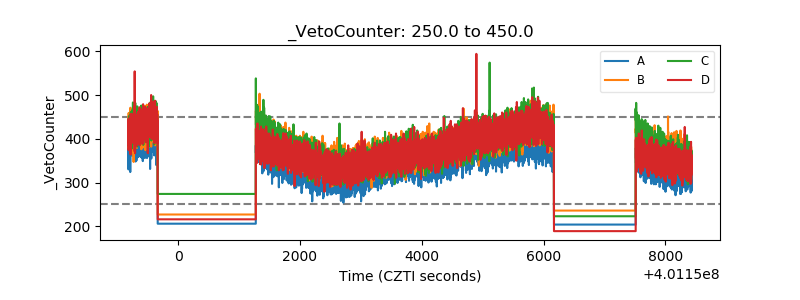 |