| Param | Original file | Final file |
|---|---|---|
| Filename | modeM0/AS1A11_075T01_9000005342_37702cztM0_level2.evt | modeM0/AS1A11_075T01_9000005342_37702cztM0_level2_quad_clean.evt |
| Size (bytes) | 887,042,880 | 131,008,320 |
| Size | 846.0 MB | 124.9 MB |
| Events in quadrant A | 6,139,581 | 811,425 |
| Events in quadrant B | 5,610,630 | 832,904 |
| Events in quadrant C | 5,289,563 | 837,063 |
| Events in quadrant D | 9,115,656 | 759,186 |
| Mode SS | |||
|---|---|---|---|
| Quadrant | BADHDUFLAG | Total packets | Discarded packets |
| A | 0 | 216 | 0 |
| B | 0 | 216 | 0 |
| C | 0 | 216 | 0 |
| D | 0 | 216 | 0 |
| Mode M0 | |||
|---|---|---|---|
| Quadrant | BADHDUFLAG | Total packets | Discarded packets |
| A | 0 | 24856 | 4 |
| B | 0 | 23636 | 3 |
| C | 0 | 22059 | 3 |
| D | 0 | 34401 | 3 |
| Mode M9 | |||
|---|---|---|---|
| Quadrant | BADHDUFLAG | Total packets | Discarded packets |
| A | 0 | 40 | 0 |
| B | 0 | 40 | 0 |
| C | 0 | 40 | 0 |
| D | 0 | 40 | 0 |
| Quadrant | Total seconds | Saturated seconds | Saturation percentage |
|---|---|---|---|
| A | 10493 | 97 | 0.924426% |
| B | 10493 | 187 | 1.782140% |
| C | 10493 | 35 | 0.333556% |
| D | 10493 | 727 | 6.928428% |
Noise dominated data is calculated using 1-second bins in cleaned event files. If a bin has >2000 counts, and if more than 50% of those come from <1% of pixels, then it is considered to be noise-dominated and hence unusable.
| Quadrant | # 1 sec bins | Bins with >0 counts | Bins with >2000 counts | High rate bins dominated by noise | Noise dominated (total time) | Noise dominated (detector-on time) | Marked lightcurve |
|---|---|---|---|---|---|---|---|
| A | 14489 | 10495 | 22 | 22 | 0.15% | 0.21% | 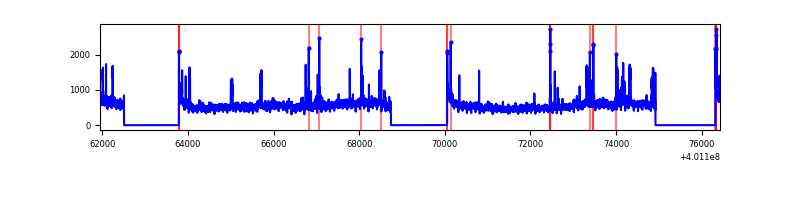 |
| B | 14490 | 10493 | 116 | 116 | 0.80% | 1.11% | 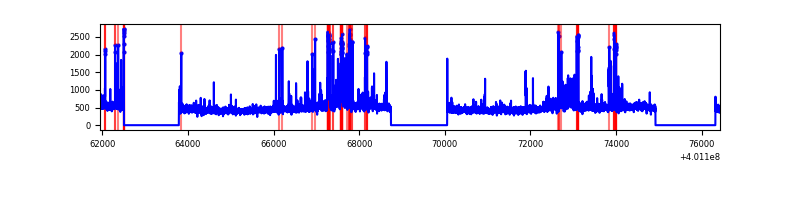 |
| C | 14490 | 10493 | 35 | 35 | 0.24% | 0.33% | 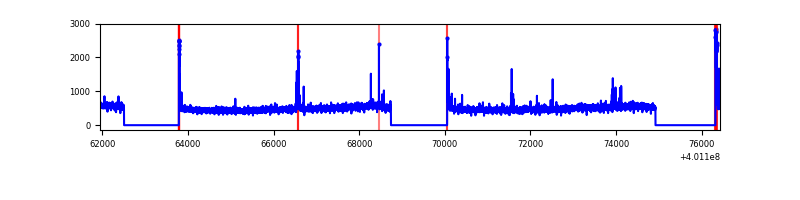 |
| D | 14490 | 10493 | 641 | 641 | 4.42% | 6.11% | 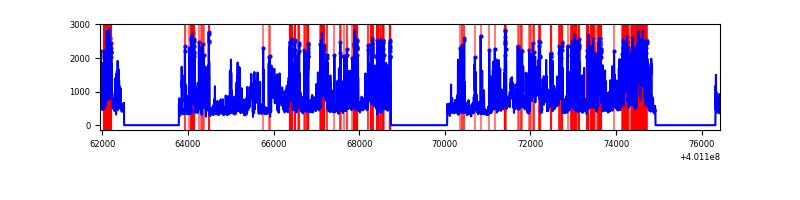 |
Top three noisy pixels from each quadrant. If the there are fewer than three noisy pixels in the level2.evt file, extra rows are filled as -1
| Pixel properties | Quadrant properties | ||||||
|---|---|---|---|---|---|---|---|
| Quadrant | DetID | PixID | Counts | Sigma | Mean | Median | Sigma |
| A | 15 | 222 | 825772 | 3432.58 | 1194 | 1170 | 240.2 |
| A | 10 | 83 | 525735 | 2183.61 | 1194 | 1170 | 240.2 |
| A | 9 | 143 | 100733 | 414.45 | 1194 | 1170 | 240.2 |
| B | 5 | 172 | 548013 | 2408.0 | 1186 | 1152 | 227.1 |
| B | 0 | 189 | 123397 | 538.28 | 1186 | 1152 | 227.1 |
| B | 0 | 230 | 65763 | 284.5 | 1186 | 1152 | 227.1 |
| C | 15 | 214 | 468997 | 1731.11 | 1175 | 1184 | 270.2 |
| C | 0 | 10 | 145870 | 535.4 | 1175 | 1184 | 270.2 |
| C | 14 | 254 | 80017 | 291.72 | 1175 | 1184 | 270.2 |
| D | 12 | 227 | 3107201 | 11136.07 | 1146 | 1116 | 278.9 |
| D | 2 | 250 | 887817 | 3179.04 | 1146 | 1116 | 278.9 |
| D | 13 | 249 | 227232 | 810.68 | 1146 | 1116 | 278.9 |
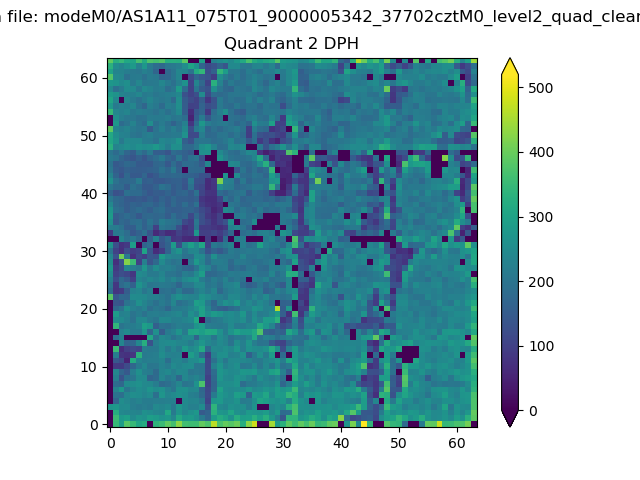
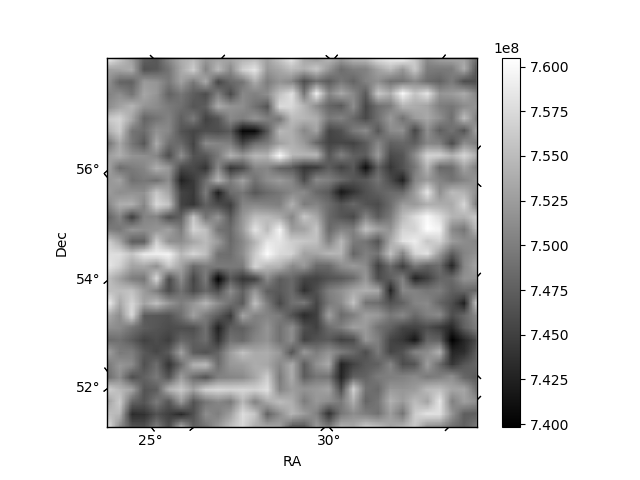
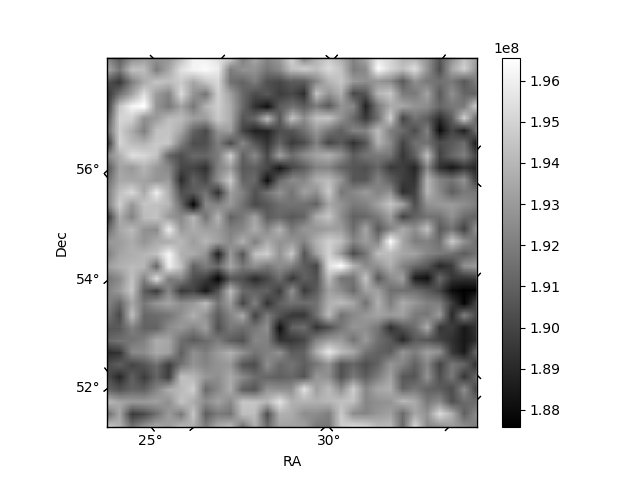
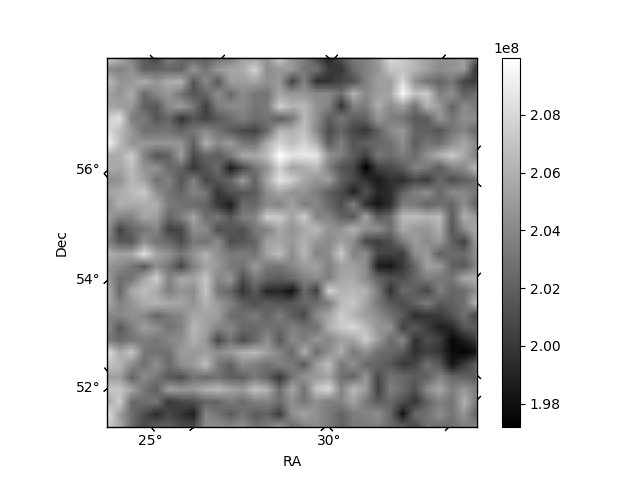
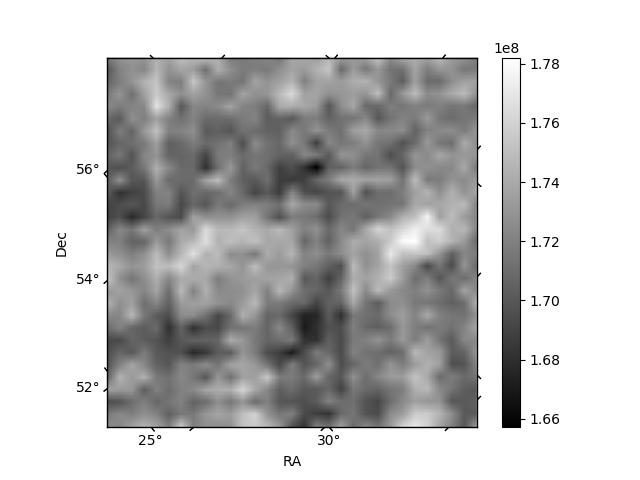
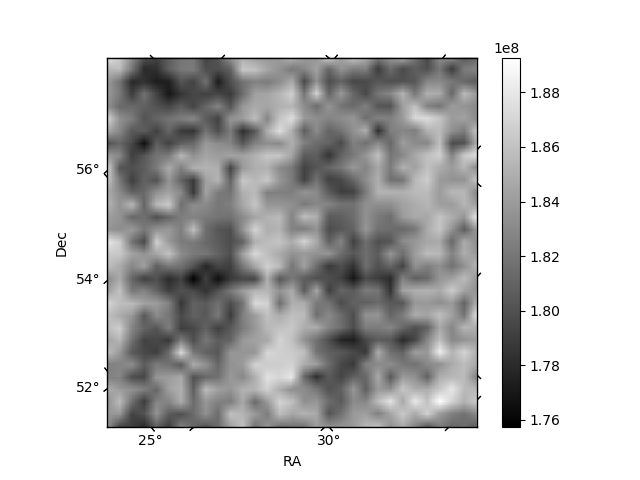
Histogram calculated using DETX and DETY for each event in the final _common_clean file
| Quadrant A | 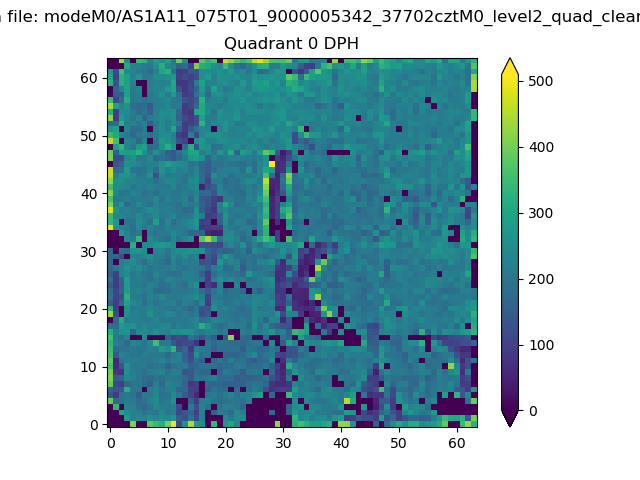 |
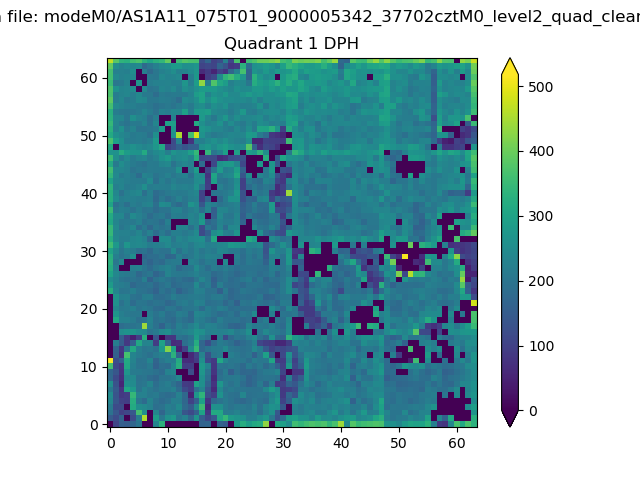 |
Quadrant B |
|---|---|---|---|
| Quadrant D | 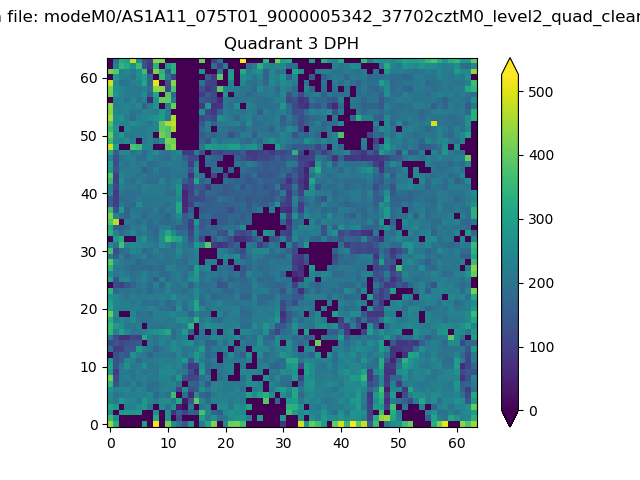 |
 |
Quadrant C |
| Plot type | Count rate plots | Images |
|---|---|---|
| Comparison with Poisson distribution Blue bars denote a histogram of data divided into 1 sec bins. Red curve is a Poisson curve with rate = median count rate of data. |
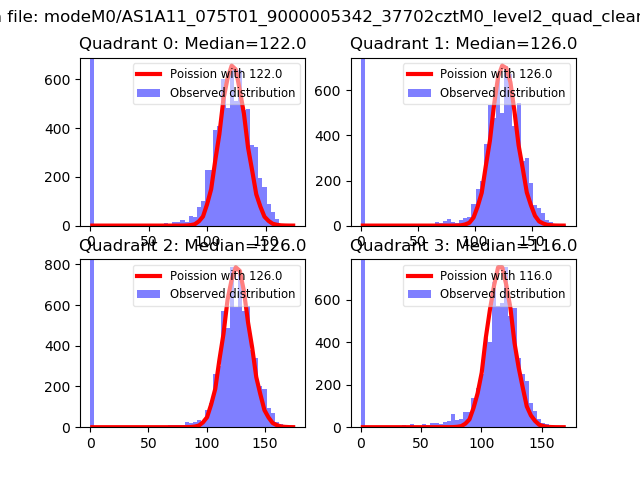 |
 |
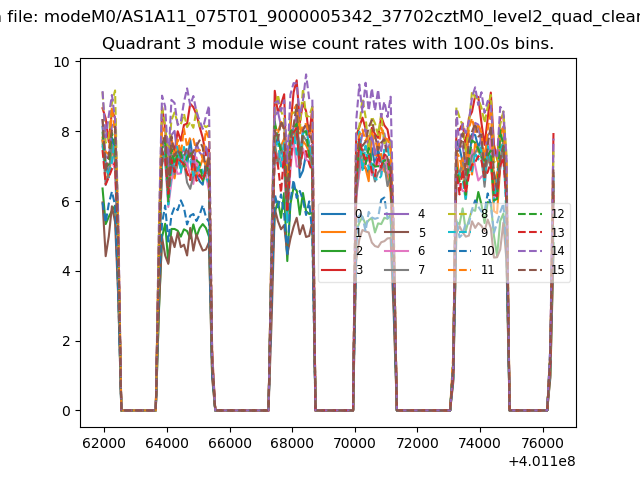
| Quadrant-wise count rates Data is divided into 100 sec bins |
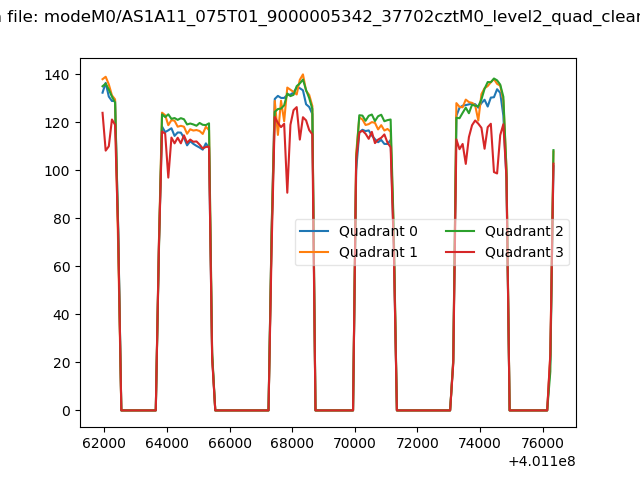 |
|
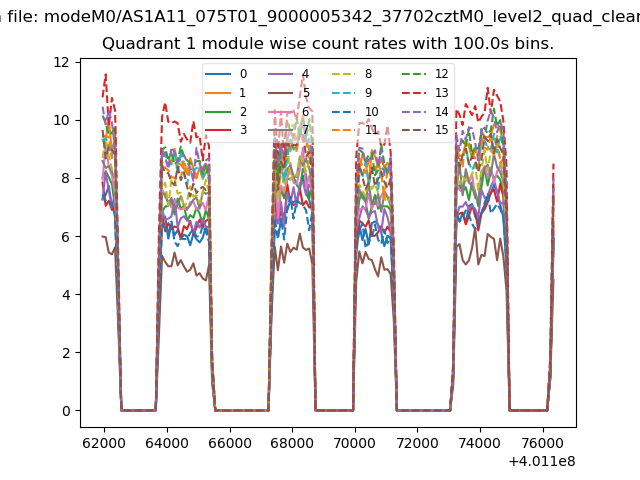
| Module-wise count rates for Quadrant A Data is divided into 100 sec bins |
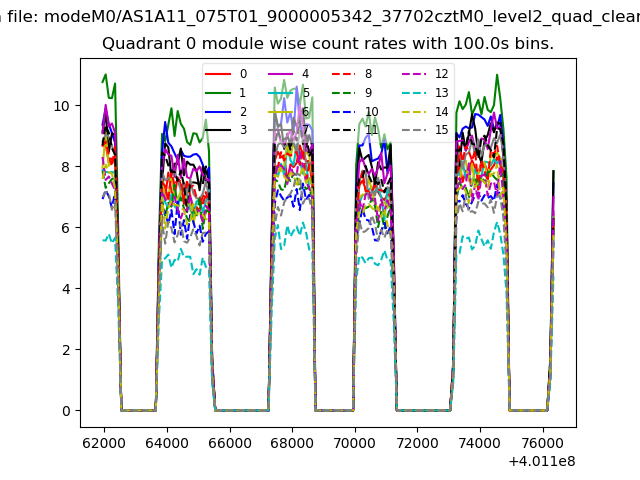 |
 |
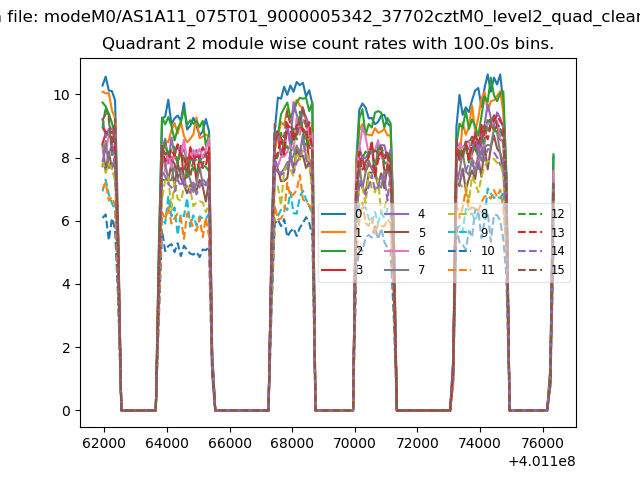
| Module-wise count rates for Quadrant B Data is divided into 100 sec bins |
 |
 |
| Module-wise count rates for Quadrant C Data is divided into 100 sec bins |
 |
 |
| Module-wise count rates for Quadrant D Data is divided into 100 sec bins |
 |
 |
| Parameter | Plot |
|---|---|
| CZT HV Monitor |  |
| D_VDD | 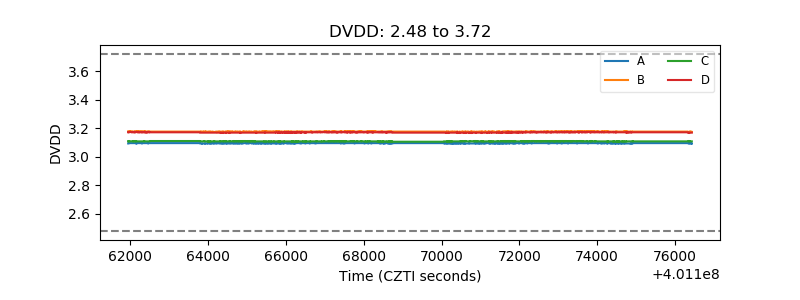 |
| Temperature 1 | 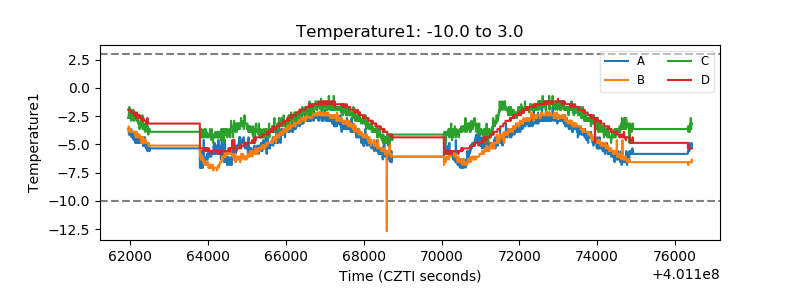 |
| Veto HV Monitor | 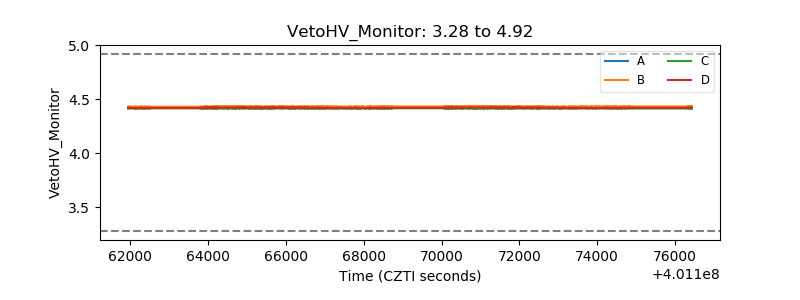 |
| Veto LLD | 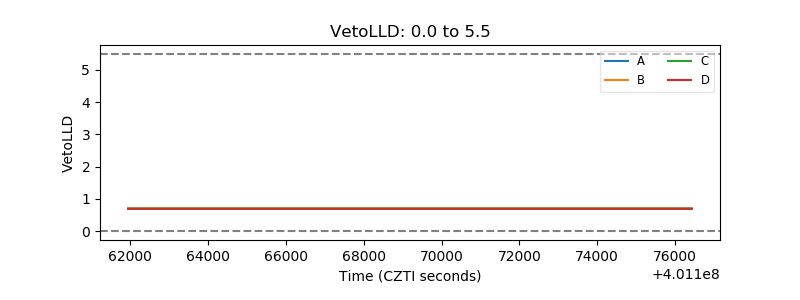 |
| Alpha Counter | 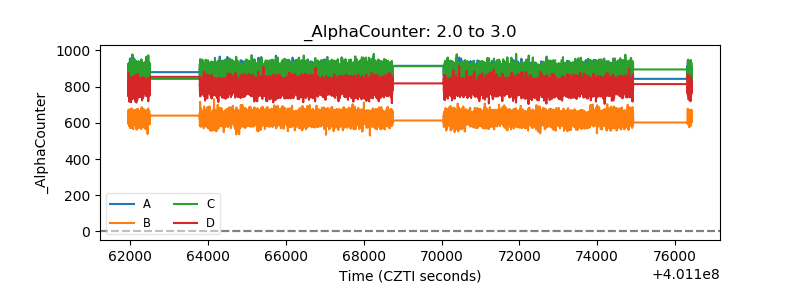 |
| _CPM_Rate | 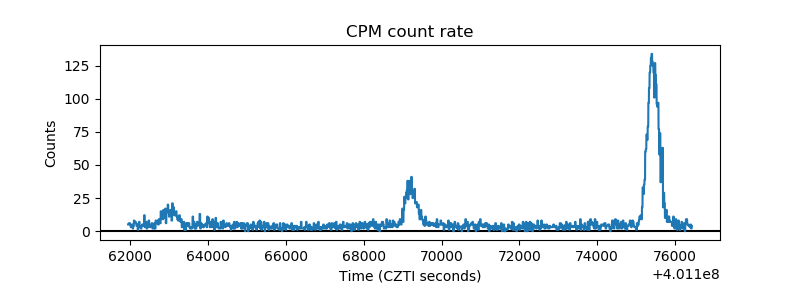 |
| CZT Counter | 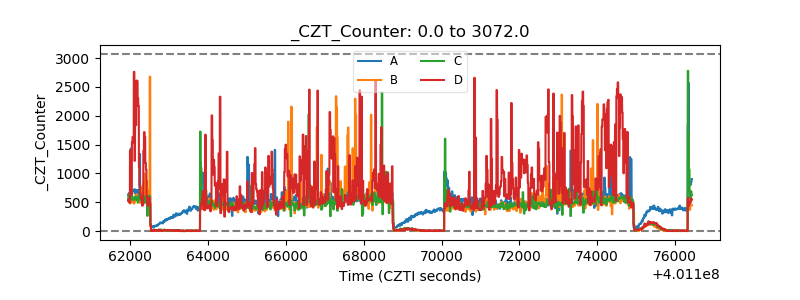 |
| +2.5 Volts monitor | 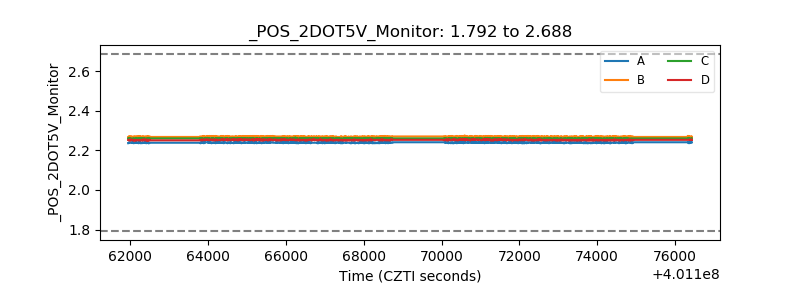 |
| +5 Volts monitor | 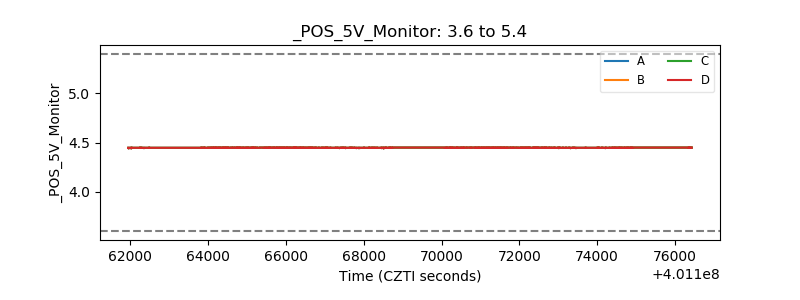 |
| _ROLL_ROT | 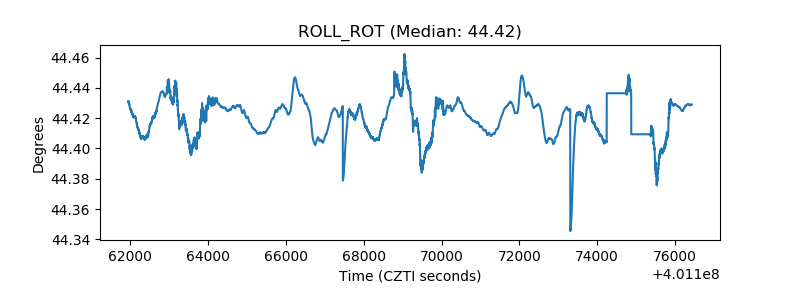 |
| _Roll_DEC | 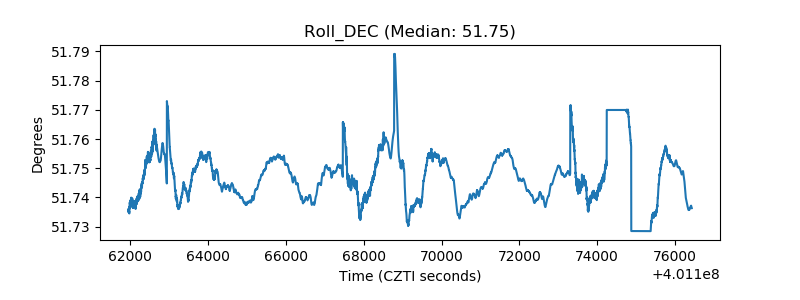 |
| _Roll_RA | 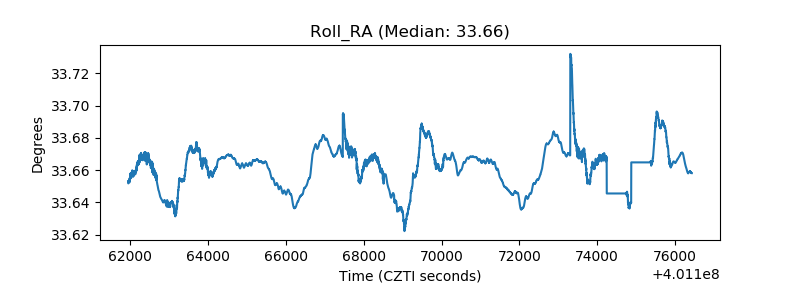 |
| Veto Counter | 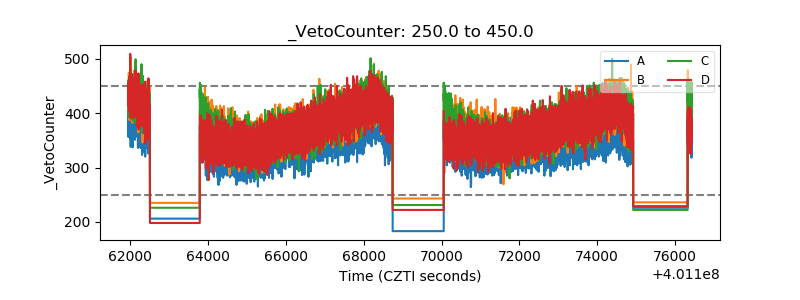 |