| Param | Original file | Final file |
|---|---|---|
| Filename | modeM0/AS1A11_075T01_9000005342_37703cztM0_level2.evt | modeM0/AS1A11_075T01_9000005342_37703cztM0_level2_quad_clean.evt |
| Size (bytes) | 466,997,760 | 65,707,200 |
| Size | 445.4 MB | 62.7 MB |
| Events in quadrant A | 3,327,239 | 397,484 |
| Events in quadrant B | 2,812,991 | 408,394 |
| Events in quadrant C | 2,992,206 | 405,986 |
| Events in quadrant D | 4,631,112 | 386,256 |
| Mode SS | |||
|---|---|---|---|
| Quadrant | BADHDUFLAG | Total packets | Discarded packets |
| A | 0 | 114 | 0 |
| B | 0 | 114 | 0 |
| C | 0 | 114 | 0 |
| D | 0 | 114 | 0 |
| Mode M0 | |||
|---|---|---|---|
| Quadrant | BADHDUFLAG | Total packets | Discarded packets |
| A | 0 | 13335 | 3 |
| B | 0 | 11953 | 2 |
| C | 0 | 12153 | 2 |
| D | 0 | 17485 | 2 |
| Mode M9 | |||
|---|---|---|---|
| Quadrant | BADHDUFLAG | Total packets | Discarded packets |
| A | 0 | 24 | 0 |
| B | 0 | 24 | 0 |
| C | 0 | 24 | 0 |
| D | 0 | 25 | 0 |
| Quadrant | Total seconds | Saturated seconds | Saturation percentage |
|---|---|---|---|
| A | 5595 | 38 | 0.679178% |
| B | 5595 | 26 | 0.464701% |
| C | 5595 | 57 | 1.018767% |
| D | 5595 | 295 | 5.272565% |
Noise dominated data is calculated using 1-second bins in cleaned event files. If a bin has >2000 counts, and if more than 50% of those come from <1% of pixels, then it is considered to be noise-dominated and hence unusable.
| Quadrant | # 1 sec bins | Bins with >0 counts | Bins with >2000 counts | High rate bins dominated by noise | Noise dominated (total time) | Noise dominated (detector-on time) | Marked lightcurve |
|---|---|---|---|---|---|---|---|
| A | 7118 | 5595 | 29 | 29 | 0.41% | 0.52% | 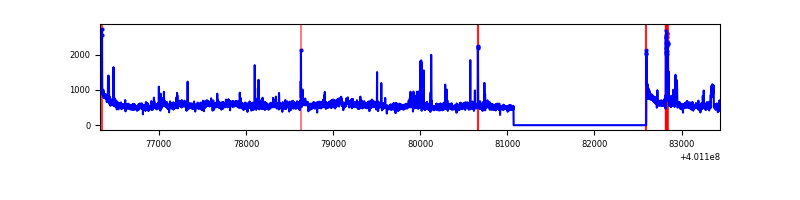 |
| B | 7117 | 5594 | 17 | 17 | 0.24% | 0.30% | 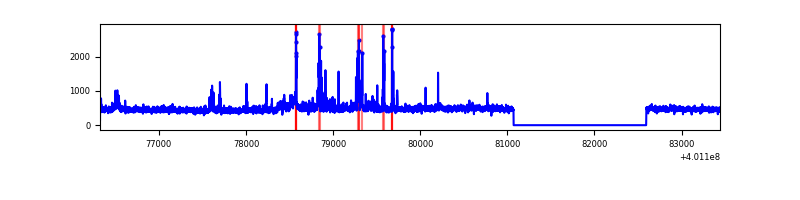 |
| C | 7117 | 5594 | 53 | 53 | 0.74% | 0.95% | 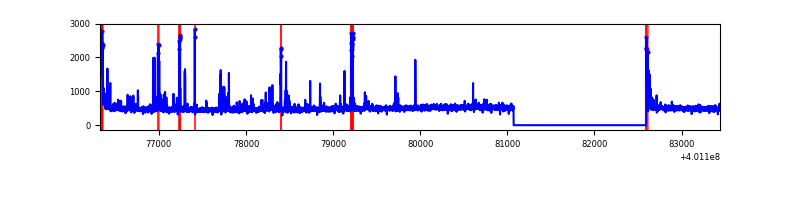 |
| D | 7117 | 5594 | 336 | 336 | 4.72% | 6.01% | 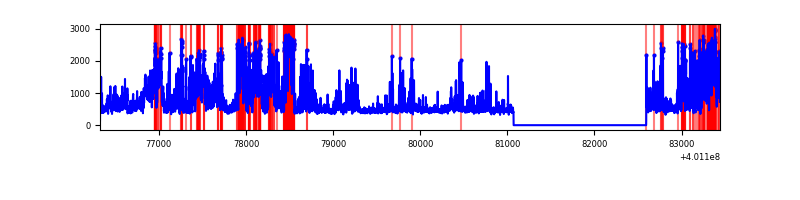 |
Top three noisy pixels from each quadrant. If the there are fewer than three noisy pixels in the level2.evt file, extra rows are filled as -1
| Pixel properties | Quadrant properties | ||||||
|---|---|---|---|---|---|---|---|
| Quadrant | DetID | PixID | Counts | Sigma | Mean | Median | Sigma |
| A | 15 | 222 | 408226 | 3164.77 | 637 | 623 | 128.8 |
| A | 10 | 83 | 322652 | 2500.34 | 637 | 623 | 128.8 |
| A | 9 | 143 | 76066 | 585.76 | 637 | 623 | 128.8 |
| B | 5 | 172 | 109070 | 893.13 | 634 | 617 | 121.4 |
| B | 0 | 189 | 54725 | 445.59 | 634 | 617 | 121.4 |
| B | 10 | 245 | 33262 | 268.84 | 634 | 617 | 121.4 |
| C | 15 | 214 | 255817 | 1753.33 | 621 | 624 | 145.5 |
| C | 14 | 254 | 211085 | 1445.99 | 621 | 624 | 145.5 |
| C | 0 | 10 | 103444 | 706.43 | 621 | 624 | 145.5 |
| D | 12 | 227 | 1230533 | 8226.59 | 612 | 596 | 149.5 |
| D | 12 | 217 | 296325 | 1978.02 | 612 | 596 | 149.5 |
| D | 2 | 250 | 258313 | 1723.77 | 612 | 596 | 149.5 |
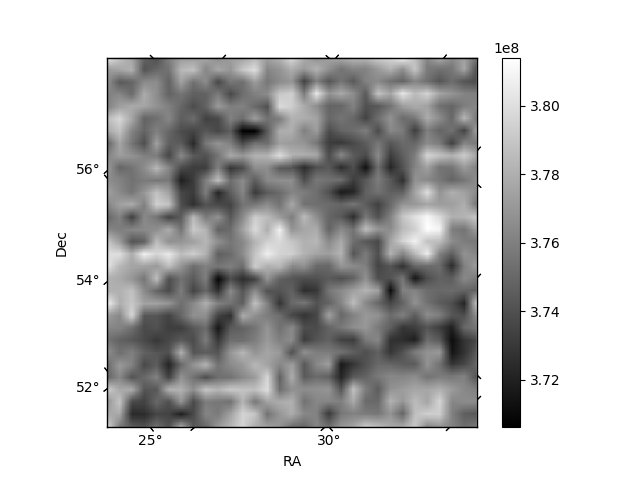
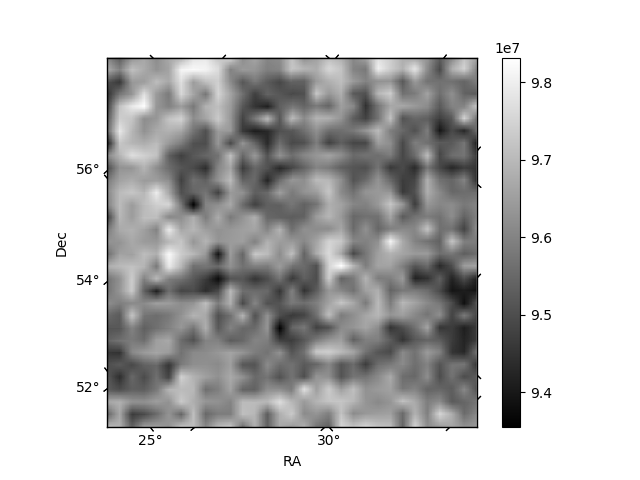
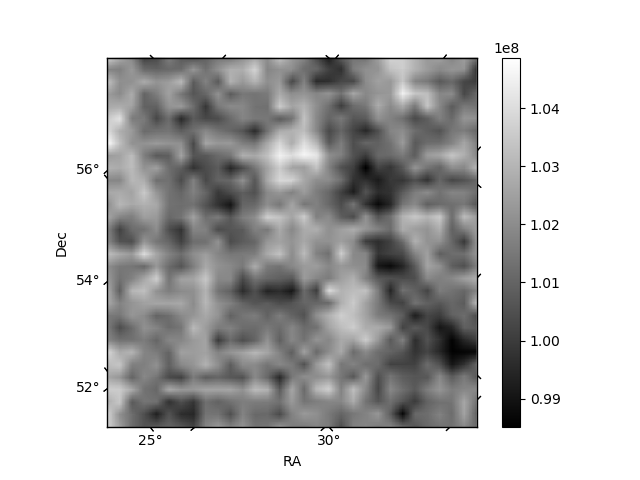
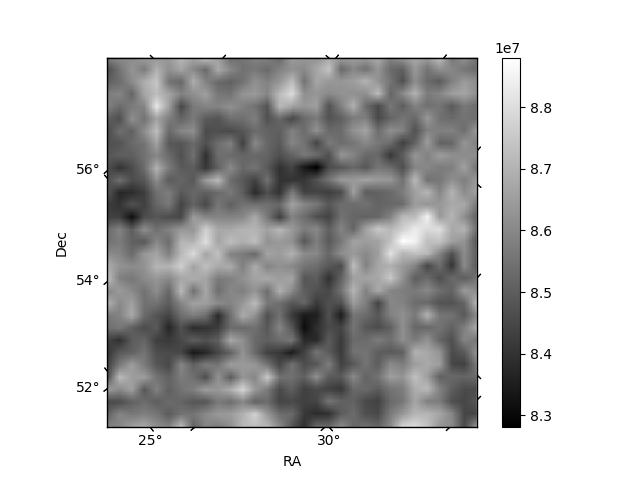
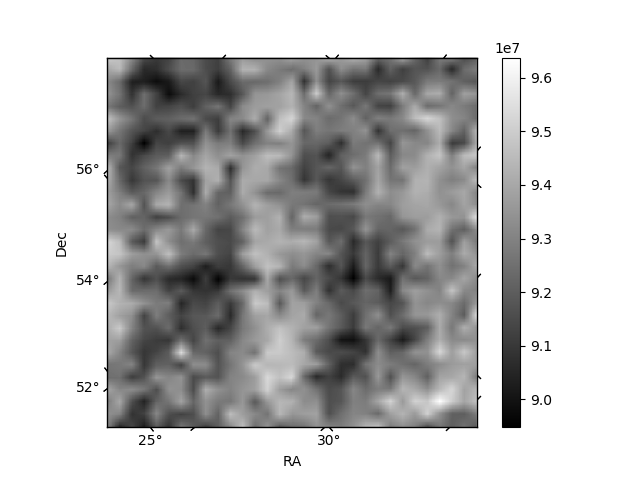
Histogram calculated using DETX and DETY for each event in the final _common_clean file
| Quadrant A | 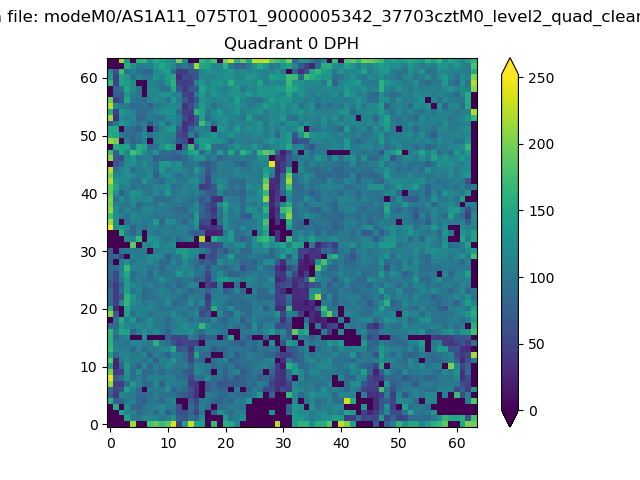 |
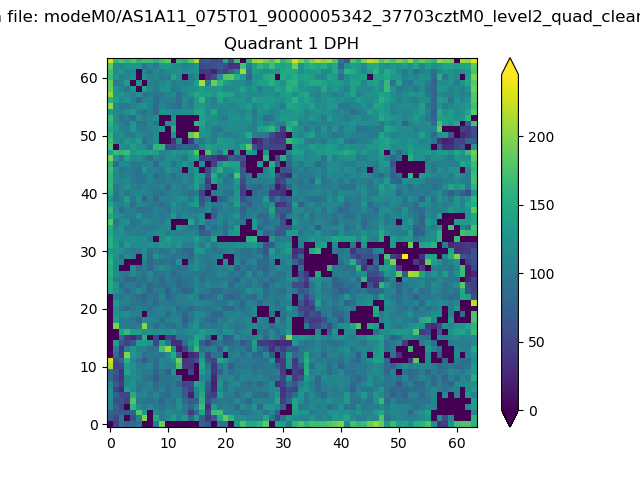 |
Quadrant B |
|---|---|---|---|
| Quadrant D | 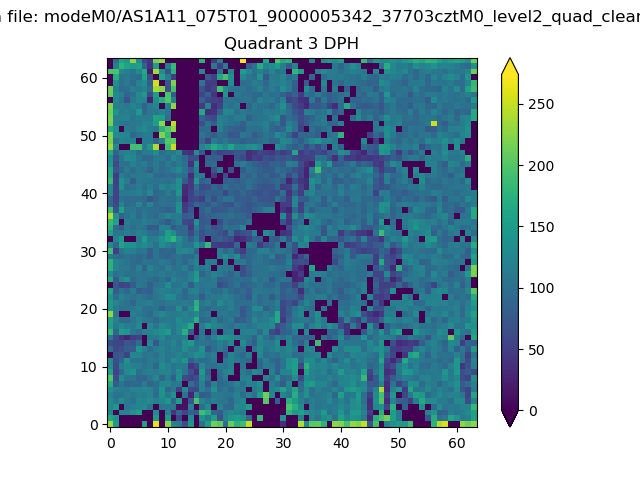 |
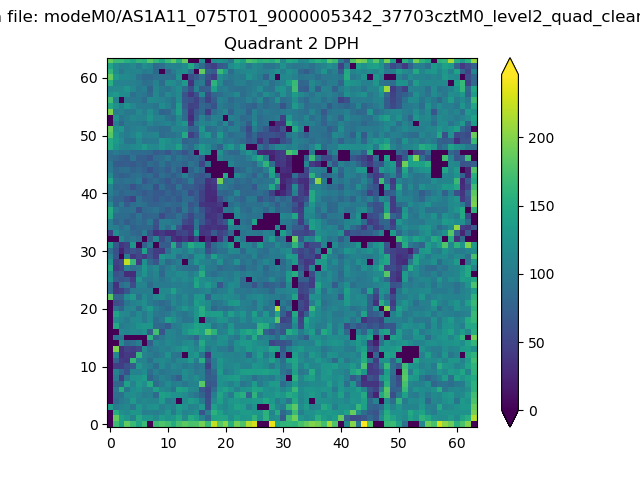 |
Quadrant C |
| Plot type | Count rate plots | Images |
|---|---|---|
| Comparison with Poisson distribution Blue bars denote a histogram of data divided into 1 sec bins. Red curve is a Poisson curve with rate = median count rate of data. |
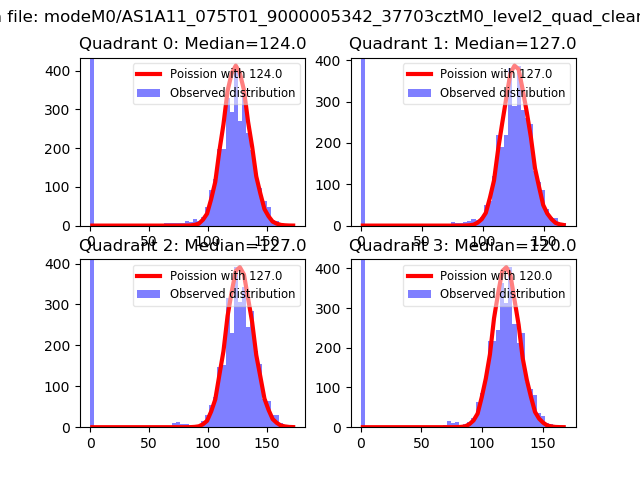 |
 |
| Quadrant-wise count rates Data is divided into 100 sec bins |
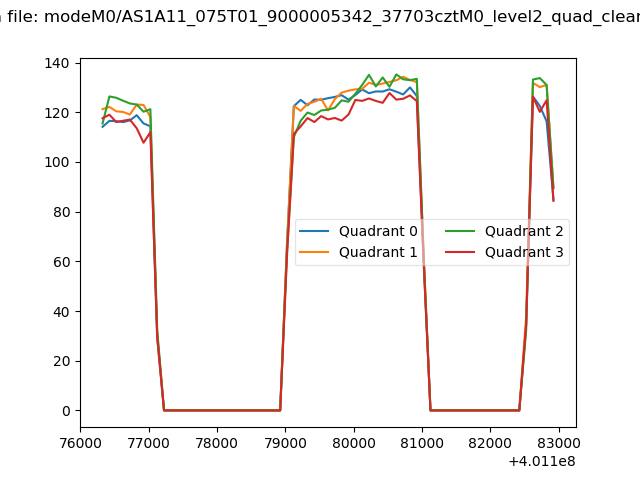 |
|
| Module-wise count rates for Quadrant A Data is divided into 100 sec bins |
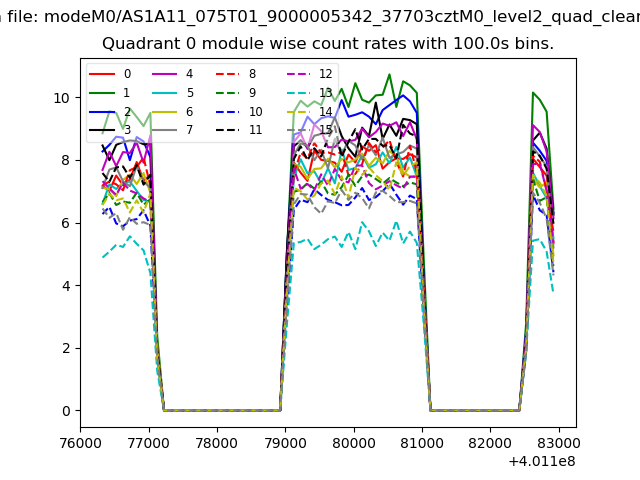 |
 |
| Module-wise count rates for Quadrant B Data is divided into 100 sec bins |
 |
 |
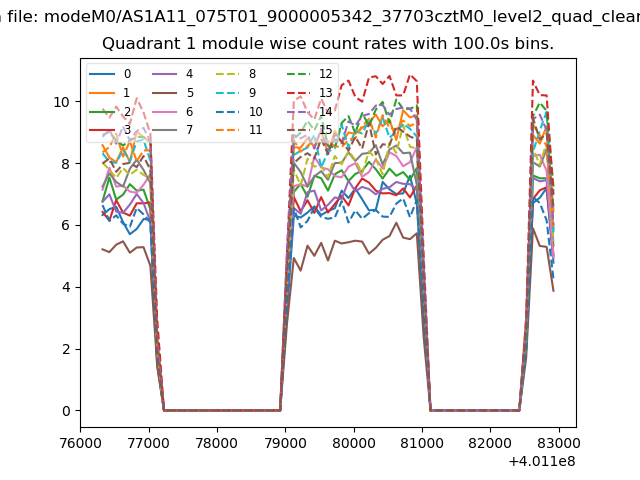
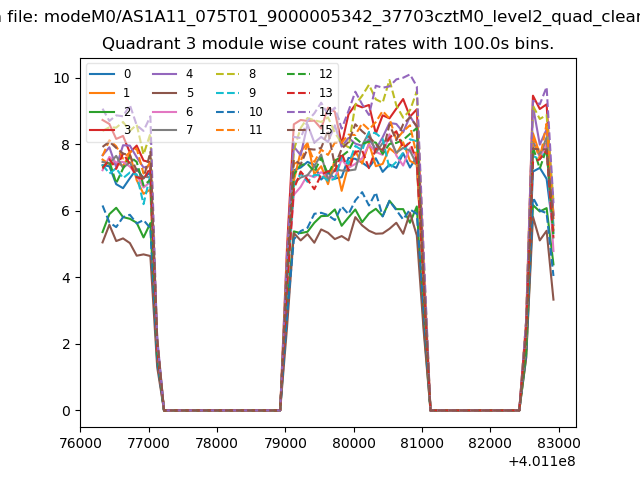
| Module-wise count rates for Quadrant C Data is divided into 100 sec bins |
 |
 |
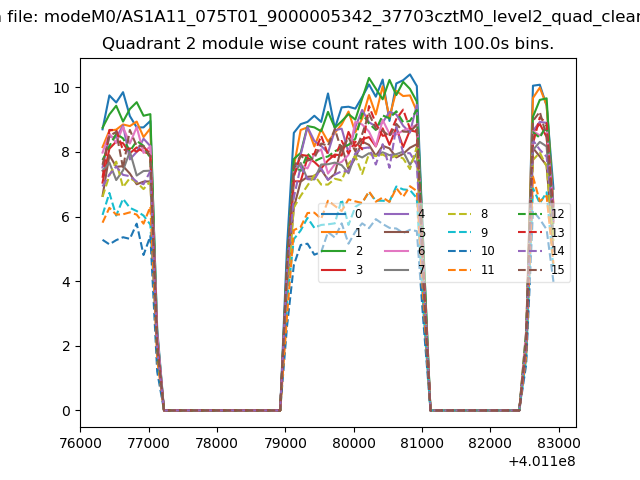
| Module-wise count rates for Quadrant D Data is divided into 100 sec bins |
 |
 |
| Parameter | Plot |
|---|---|
| CZT HV Monitor | 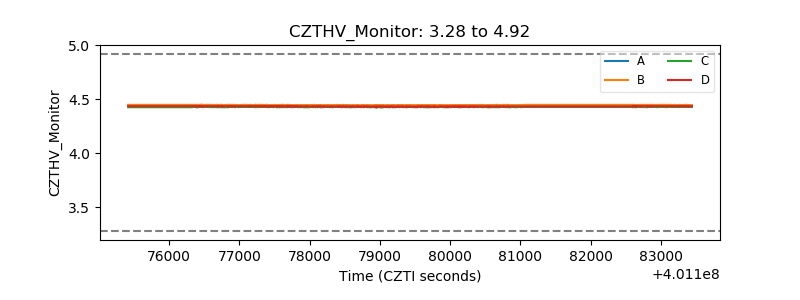 |
| D_VDD | 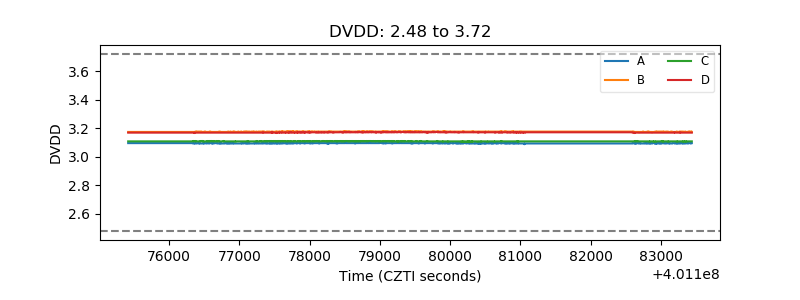 |
| Temperature 1 | 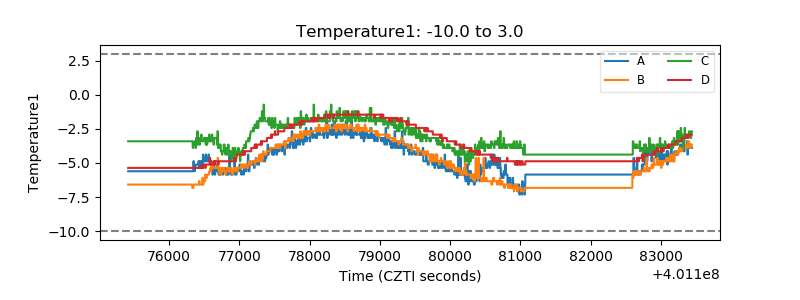 |
| Veto HV Monitor | 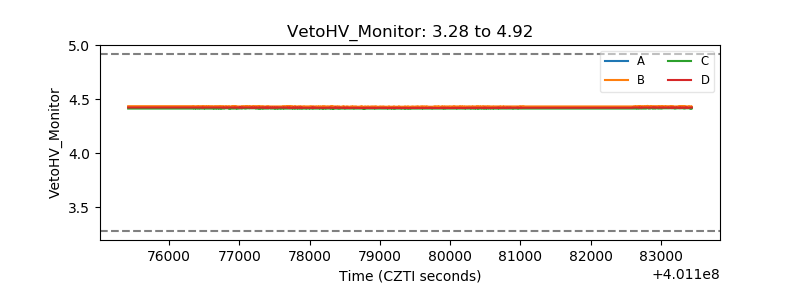 |
| Veto LLD | 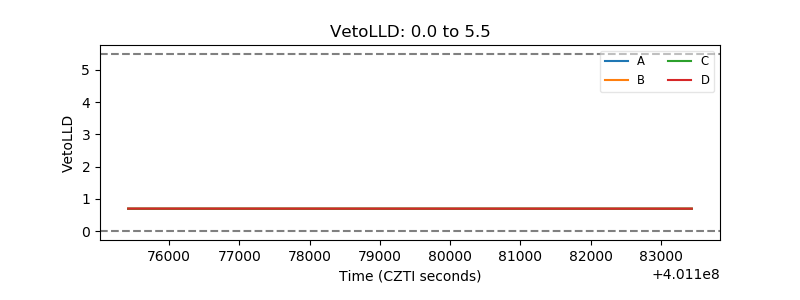 |
| Alpha Counter | 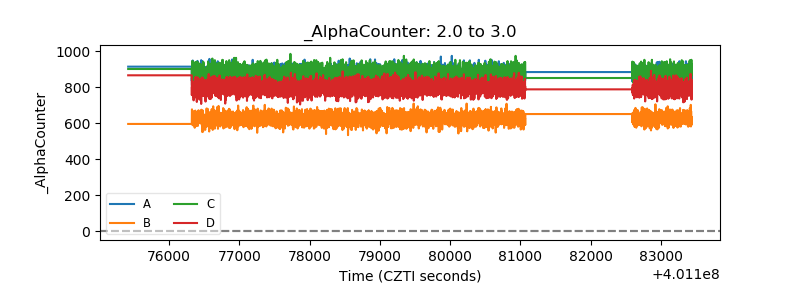 |
| _CPM_Rate | 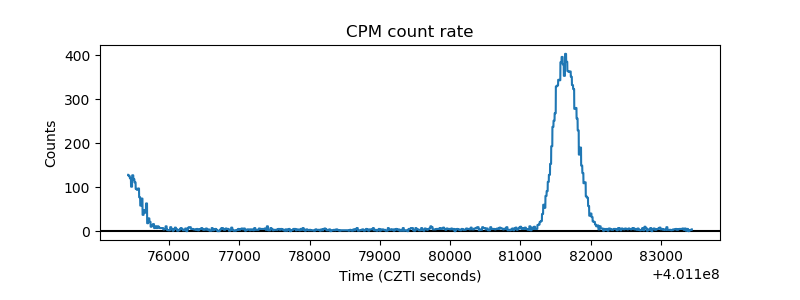 |
| CZT Counter | 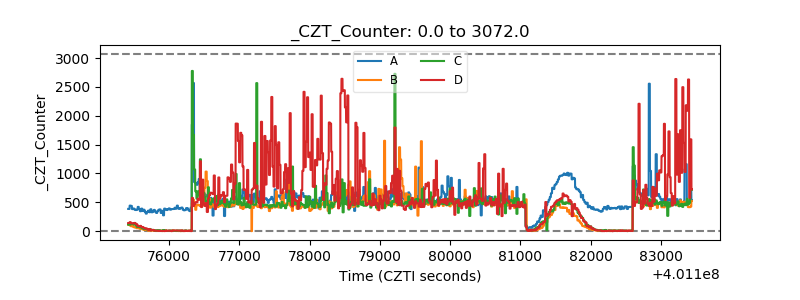 |
| +2.5 Volts monitor | 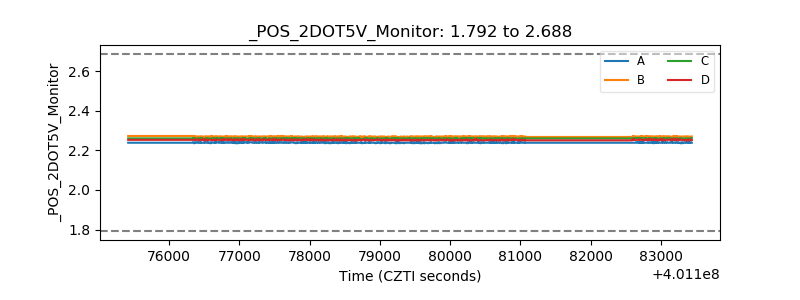 |
| +5 Volts monitor | 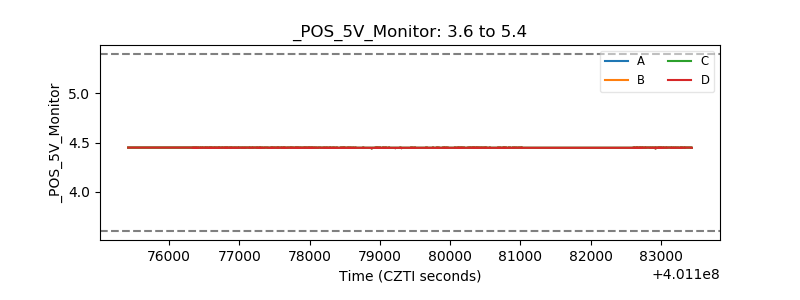 |
| _ROLL_ROT | 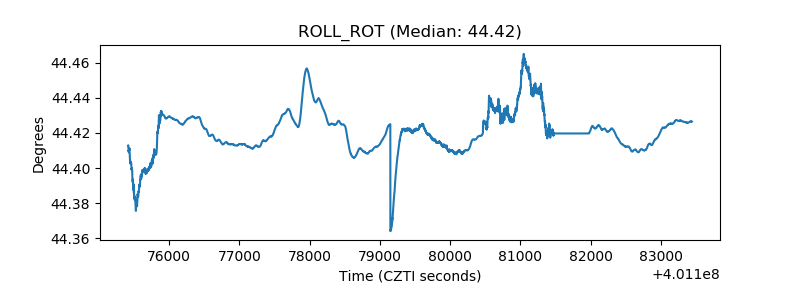 |
| _Roll_DEC | 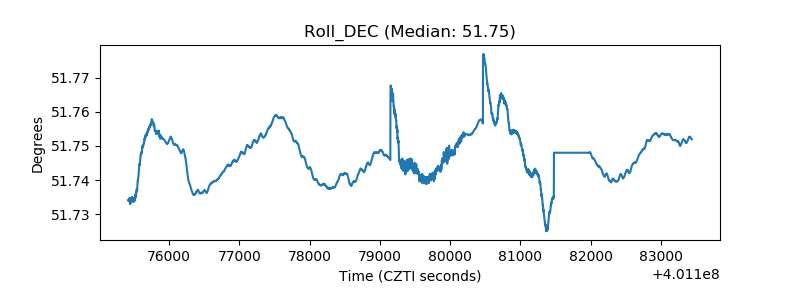 |
| _Roll_RA | 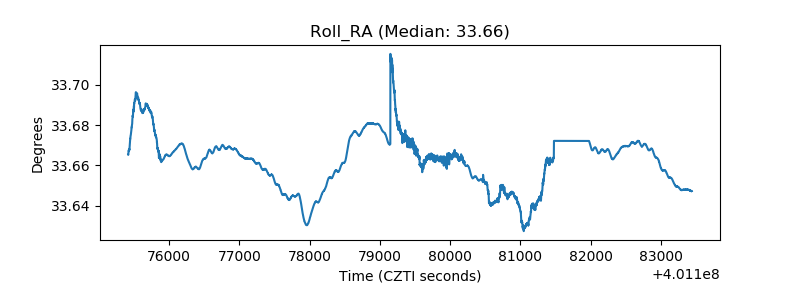 |
| Veto Counter | 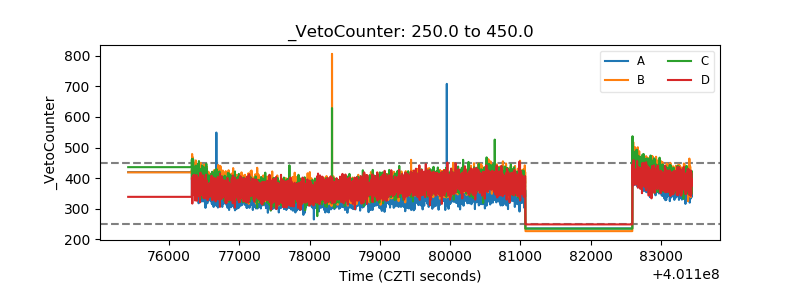 |