| Param | Original file | Final file |
|---|---|---|
| Filename | modeM0/AS1A11_075T01_9000005342_37707cztM0_level2.evt | modeM0/AS1A11_075T01_9000005342_37707cztM0_level2_quad_clean.evt |
| Size (bytes) | 463,377,600 | 63,230,400 |
| Size | 441.9 MB | 60.3 MB |
| Events in quadrant A | 4,272,389 | 385,421 |
| Events in quadrant B | 2,957,961 | 392,215 |
| Events in quadrant C | 3,039,790 | 389,492 |
| Events in quadrant D | 3,401,057 | 373,008 |
| Mode SS | |||
|---|---|---|---|
| Quadrant | BADHDUFLAG | Total packets | Discarded packets |
| A | 0 | 108 | 0 |
| B | 0 | 108 | 0 |
| C | 0 | 108 | 0 |
| D | 0 | 108 | 0 |
| Mode M0 | |||
|---|---|---|---|
| Quadrant | BADHDUFLAG | Total packets | Discarded packets |
| A | 0 | 16386 | 3 |
| B | 0 | 12045 | 2 |
| C | 0 | 12223 | 2 |
| D | 0 | 13656 | 2 |
| Mode M9 | |||
|---|---|---|---|
| Quadrant | BADHDUFLAG | Total packets | Discarded packets |
| A | 0 | 33 | 0 |
| B | 0 | 33 | 0 |
| C | 0 | 33 | 0 |
| D | 0 | 34 | 0 |
| Quadrant | Total seconds | Saturated seconds | Saturation percentage |
|---|---|---|---|
| A | 5348 | 88 | 1.645475% |
| B | 5348 | 75 | 1.402393% |
| C | 5348 | 33 | 0.617053% |
| D | 5348 | 103 | 1.925954% |
Noise dominated data is calculated using 1-second bins in cleaned event files. If a bin has >2000 counts, and if more than 50% of those come from <1% of pixels, then it is considered to be noise-dominated and hence unusable.
| Quadrant | # 1 sec bins | Bins with >0 counts | Bins with >2000 counts | High rate bins dominated by noise | Noise dominated (total time) | Noise dominated (detector-on time) | Marked lightcurve |
|---|---|---|---|---|---|---|---|
| A | 7259 | 5348 | 31 | 31 | 0.43% | 0.58% | 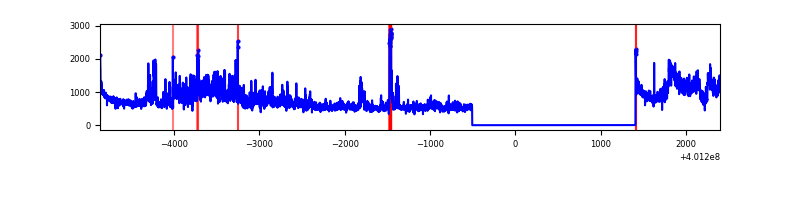 |
| B | 7259 | 5347 | 55 | 55 | 0.76% | 1.03% | 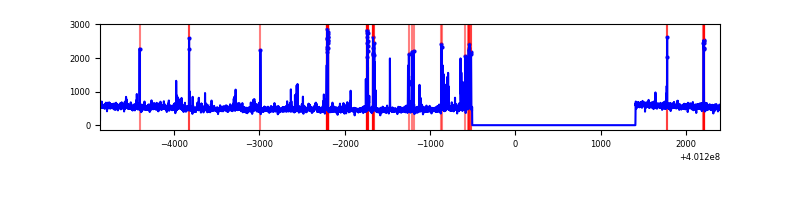 |
| C | 7259 | 5347 | 31 | 31 | 0.43% | 0.58% | 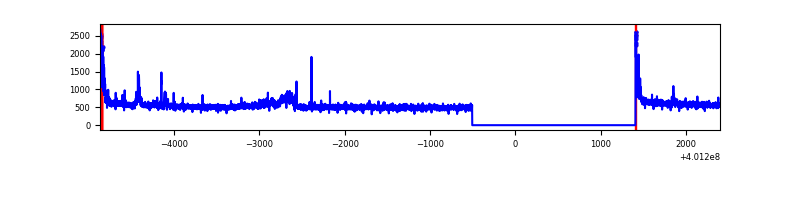 |
| D | 7259 | 5347 | 84 | 84 | 1.16% | 1.57% | 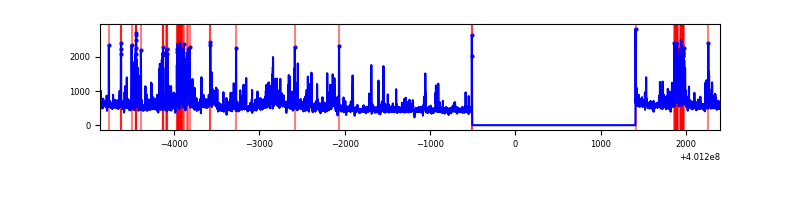 |
Top three noisy pixels from each quadrant. If the there are fewer than three noisy pixels in the level2.evt file, extra rows are filled as -1
| Pixel properties | Quadrant properties | ||||||
|---|---|---|---|---|---|---|---|
| Quadrant | DetID | PixID | Counts | Sigma | Mean | Median | Sigma |
| A | 15 | 222 | 1174163 | 8781.67 | 670 | 659 | 133.6 |
| A | 10 | 83 | 323949 | 2419.27 | 670 | 659 | 133.6 |
| A | 9 | 143 | 93438 | 694.29 | 670 | 659 | 133.6 |
| B | 5 | 172 | 255338 | 2038.1 | 663 | 645 | 125.0 |
| B | 5 | 200 | 41680 | 328.37 | 663 | 645 | 125.0 |
| B | 0 | 230 | 33178 | 260.33 | 663 | 645 | 125.0 |
| C | 15 | 214 | 244400 | 1632.02 | 653 | 656 | 149.4 |
| C | 0 | 10 | 122801 | 817.83 | 653 | 656 | 149.4 |
| C | 14 | 254 | 111004 | 738.85 | 653 | 656 | 149.4 |
| D | 2 | 250 | 334432 | 2099.03 | 652 | 635 | 159.0 |
| D | 12 | 227 | 153571 | 961.71 | 652 | 635 | 159.0 |
| D | 2 | 153 | 101548 | 634.57 | 652 | 635 | 159.0 |
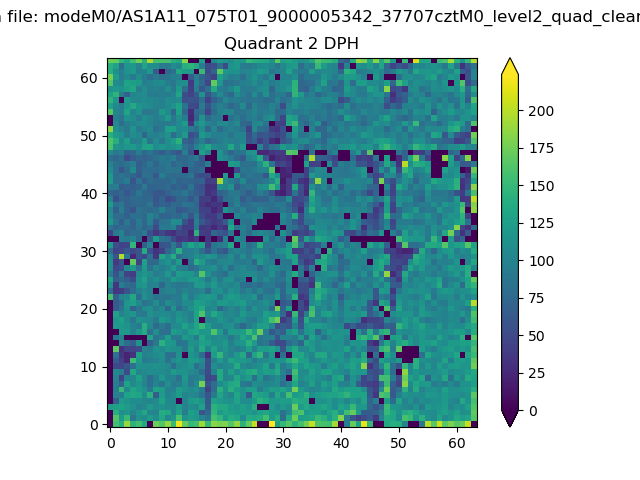
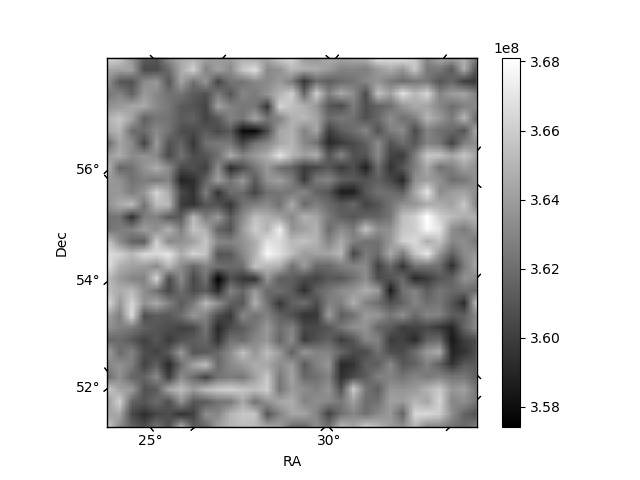
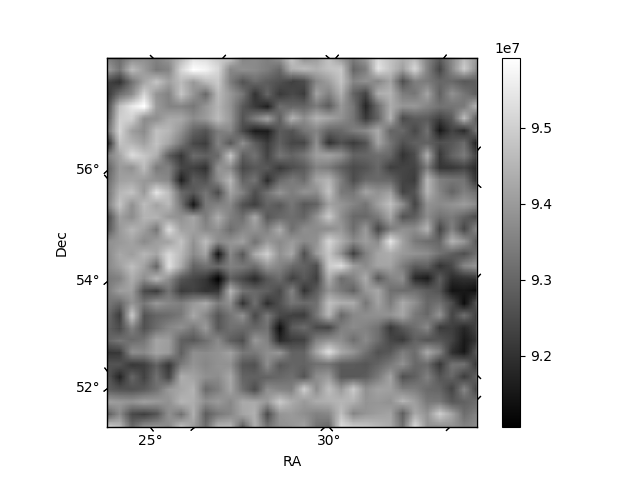
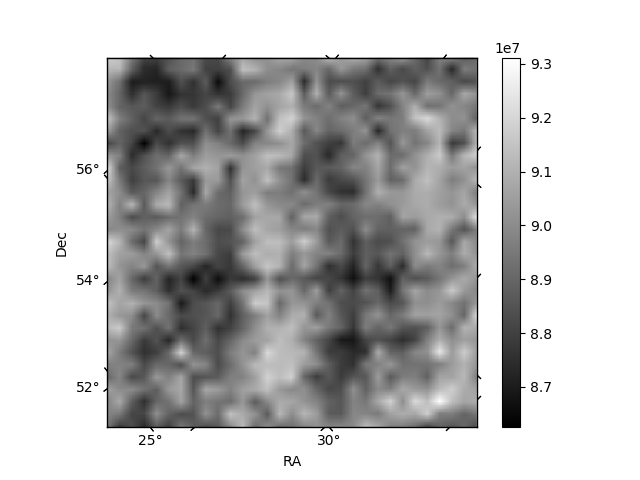
Histogram calculated using DETX and DETY for each event in the final _common_clean file
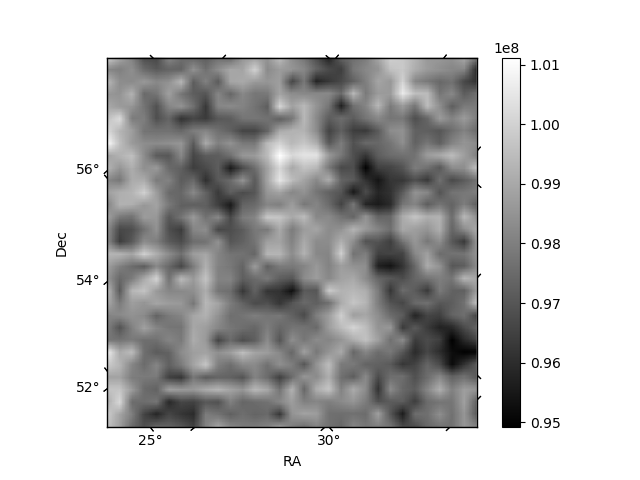
| Quadrant A | 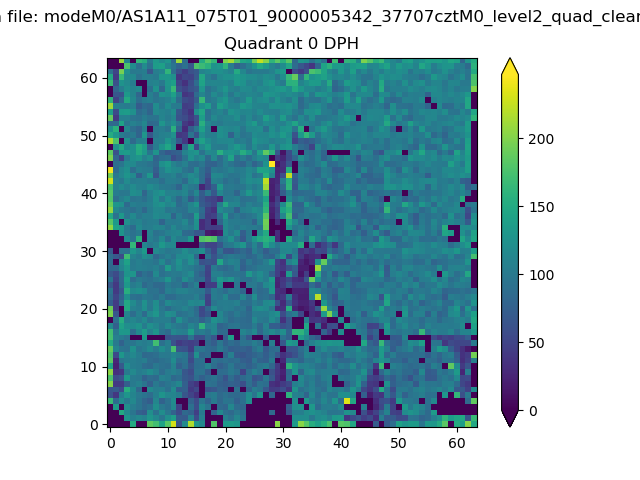 |
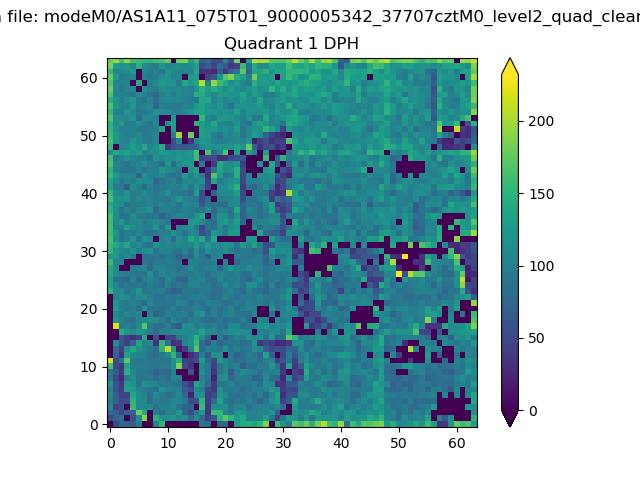 |
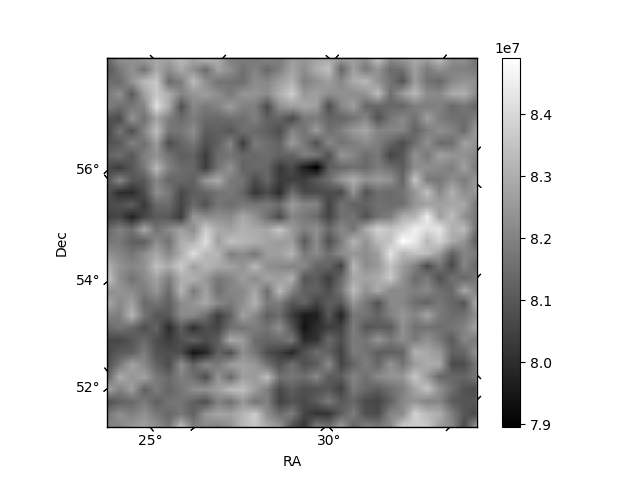
Quadrant B |
|---|---|---|---|
| Quadrant D | 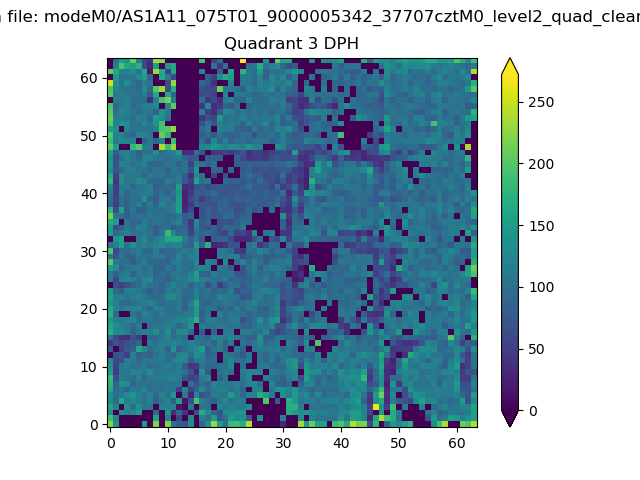 |
 |
Quadrant C |
| Plot type | Count rate plots | Images |
|---|---|---|
| Comparison with Poisson distribution Blue bars denote a histogram of data divided into 1 sec bins. Red curve is a Poisson curve with rate = median count rate of data. |
 |
 |
| Quadrant-wise count rates Data is divided into 100 sec bins |
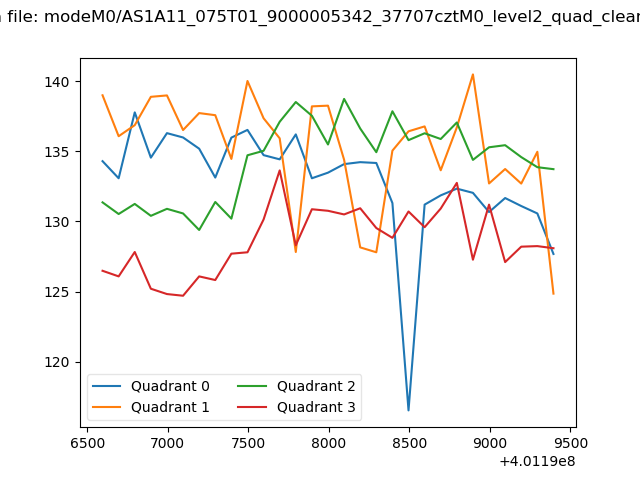 |
|
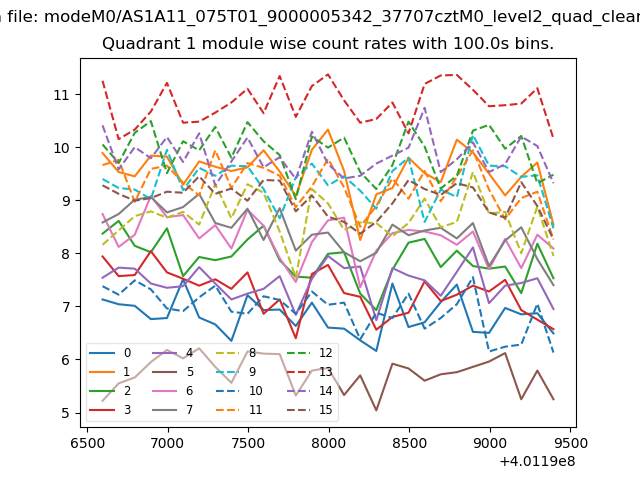
| Module-wise count rates for Quadrant A Data is divided into 100 sec bins |
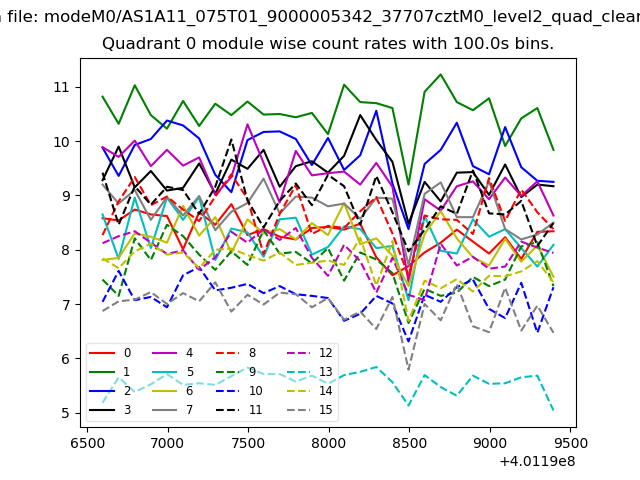 |
 |
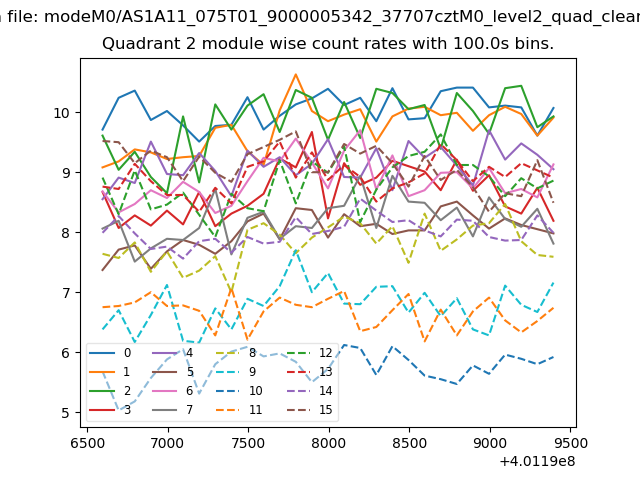
| Module-wise count rates for Quadrant B Data is divided into 100 sec bins |
 |
 |
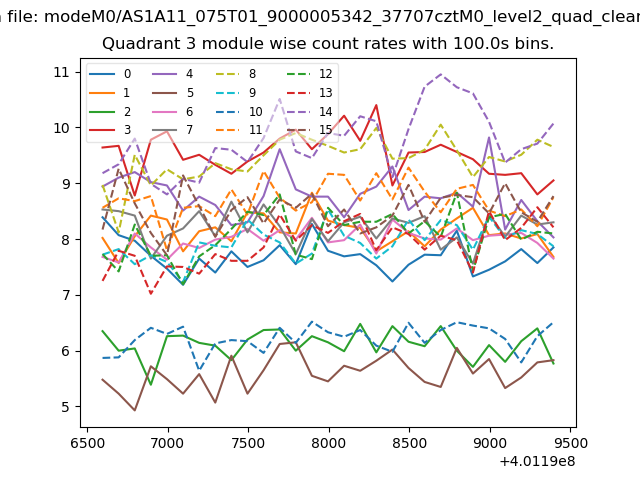
| Module-wise count rates for Quadrant C Data is divided into 100 sec bins |
 |
 |
| Module-wise count rates for Quadrant D Data is divided into 100 sec bins |
 |
 |
| Parameter | Plot |
|---|---|
| CZT HV Monitor | 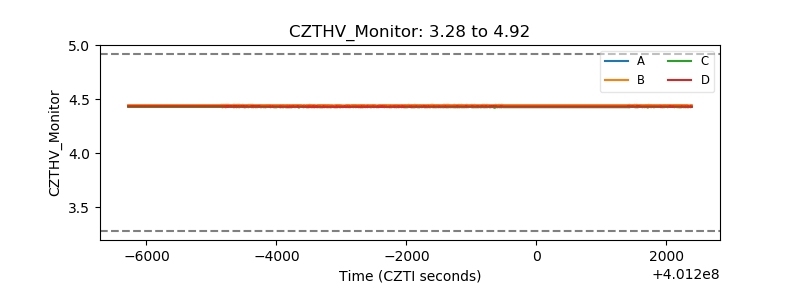 |
| D_VDD | 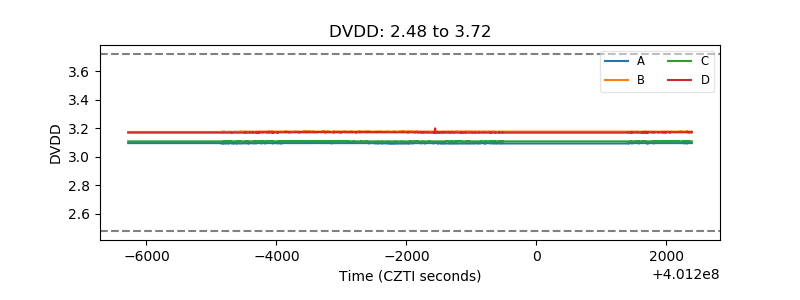 |
| Temperature 1 | 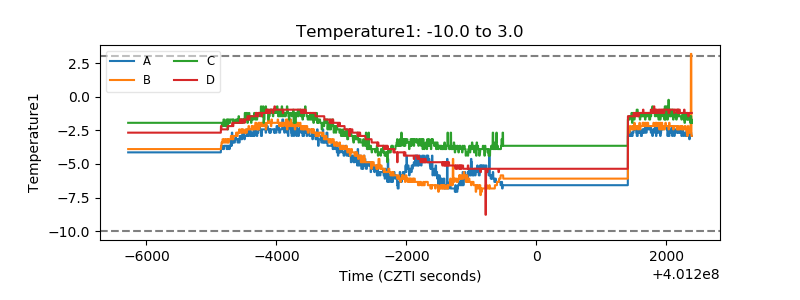 |
| Veto HV Monitor | 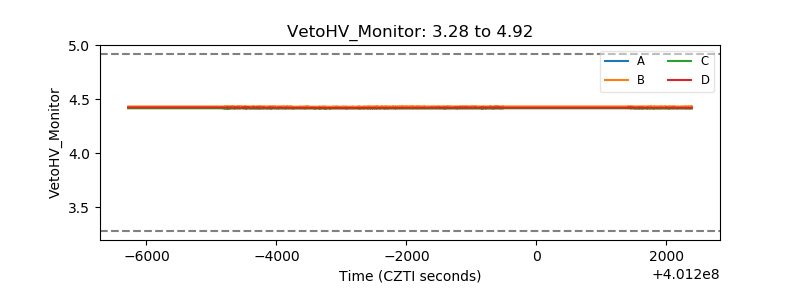 |
| Veto LLD | 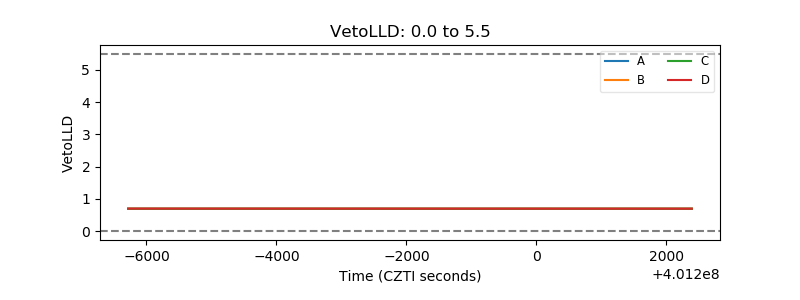 |
| Alpha Counter | 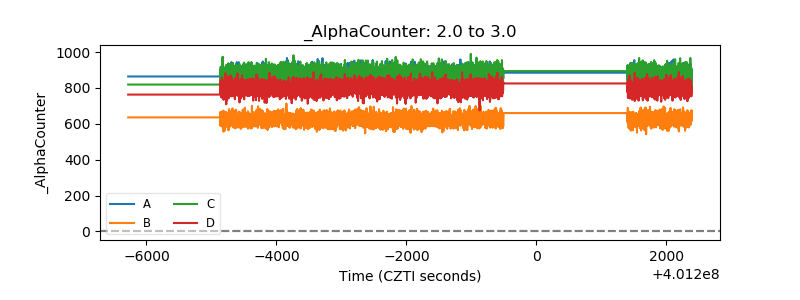 |
| _CPM_Rate | 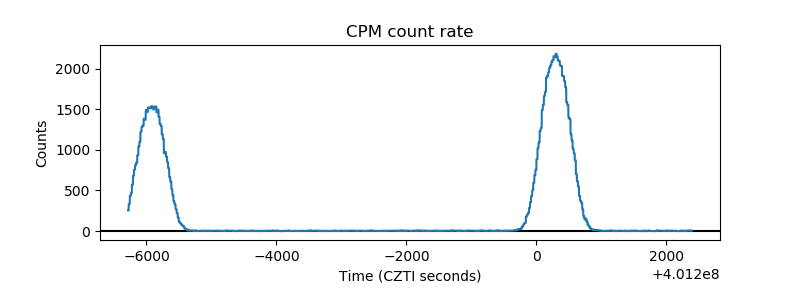 |
| CZT Counter | 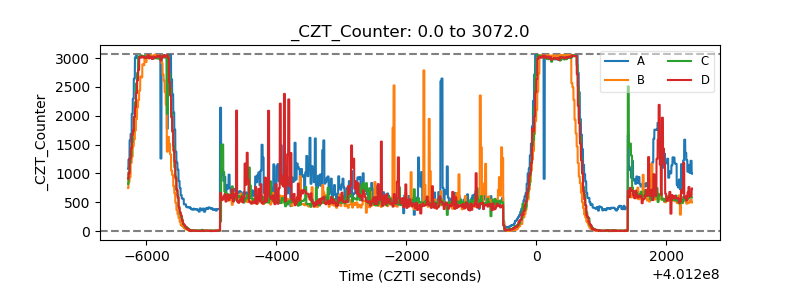 |
| +2.5 Volts monitor | 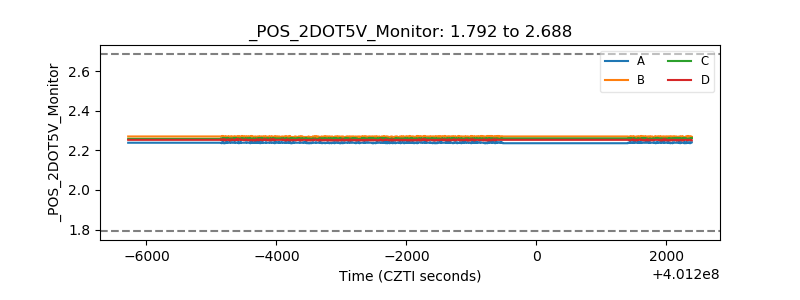 |
| +5 Volts monitor | 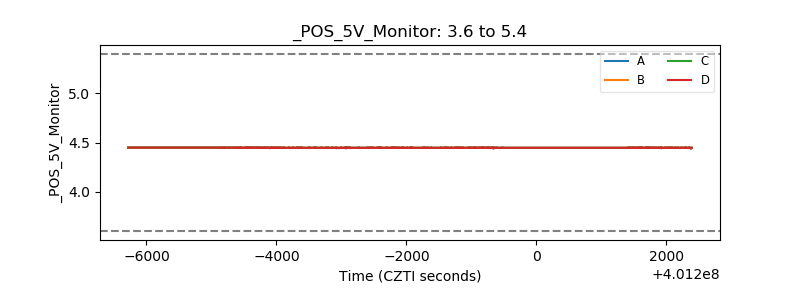 |
| _ROLL_ROT | 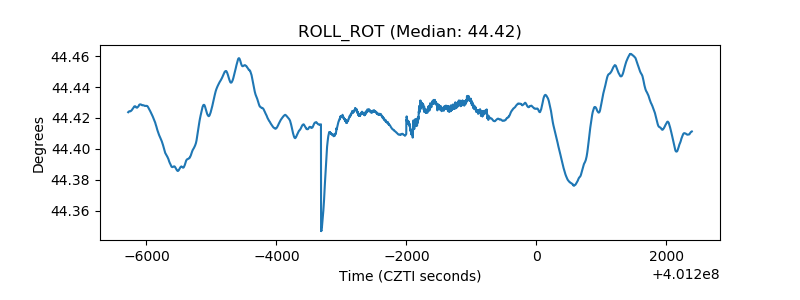 |
| _Roll_DEC | 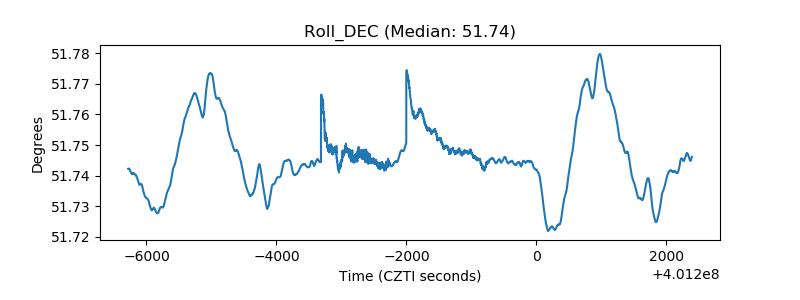 |
| _Roll_RA | 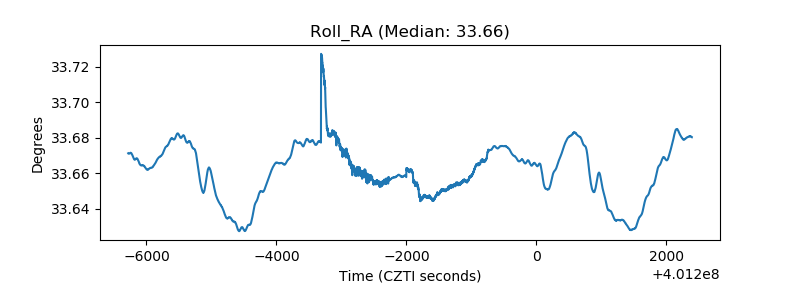 |
| Veto Counter | 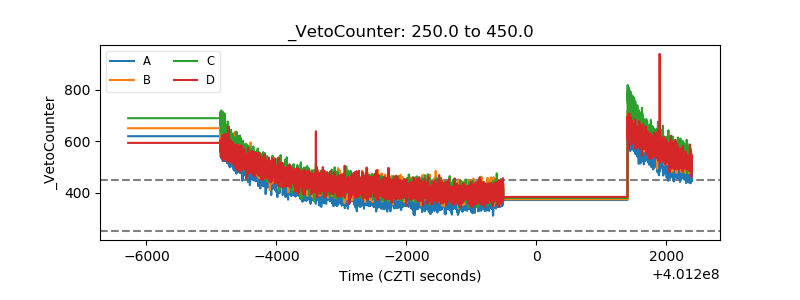 |