| Param | Original file | Final file |
|---|---|---|
| Filename | modeM0/AS1A11_075T01_9000005342_37709cztM0_level2.evt | modeM0/AS1A11_075T01_9000005342_37709cztM0_level2_quad_clean.evt |
| Size (bytes) | 515,528,640 | 90,803,520 |
| Size | 491.6 MB | 86.6 MB |
| Events in quadrant A | 4,875,979 | 595,040 |
| Events in quadrant B | 2,694,177 | 625,420 |
| Events in quadrant C | 2,917,937 | 624,478 |
| Events in quadrant D | 4,788,010 | 555,805 |
| Mode SS | |||
|---|---|---|---|
| Quadrant | BADHDUFLAG | Total packets | Discarded packets |
| A | 0 | 102 | 0 |
| B | 0 | 102 | 0 |
| C | 0 | 102 | 0 |
| D | 0 | 102 | 0 |
| Mode M0 | |||
|---|---|---|---|
| Quadrant | BADHDUFLAG | Total packets | Discarded packets |
| A | 0 | 17654 | 3 |
| B | 0 | 11027 | 2 |
| C | 0 | 11560 | 2 |
| D | 0 | 17560 | 2 |
| Mode M9 | |||
|---|---|---|---|
| Quadrant | BADHDUFLAG | Total packets | Discarded packets |
| A | 0 | 26 | 0 |
| B | 0 | 26 | 0 |
| C | 0 | 26 | 0 |
| D | 0 | 27 | 0 |
| Quadrant | Total seconds | Saturated seconds | Saturation percentage |
|---|---|---|---|
| A | 4971 | 547 | 11.003822% |
| B | 4971 | 29 | 0.583384% |
| C | 4971 | 77 | 1.548984% |
| D | 4971 | 658 | 13.236773% |
Noise dominated data is calculated using 1-second bins in cleaned event files. If a bin has >2000 counts, and if more than 50% of those come from <1% of pixels, then it is considered to be noise-dominated and hence unusable.
| Quadrant | # 1 sec bins | Bins with >0 counts | Bins with >2000 counts | High rate bins dominated by noise | Noise dominated (total time) | Noise dominated (detector-on time) | Marked lightcurve |
|---|---|---|---|---|---|---|---|
| A | 7094 | 4972 | 390 | 390 | 5.50% | 7.84% | 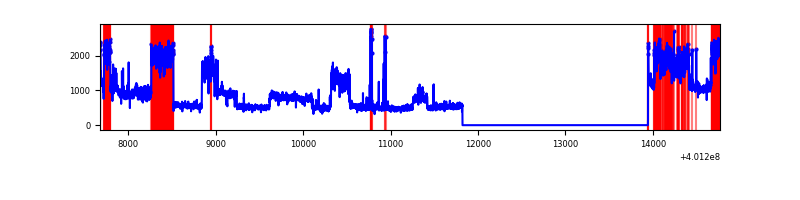 |
| B | 7093 | 4970 | 16 | 16 | 0.23% | 0.32% | 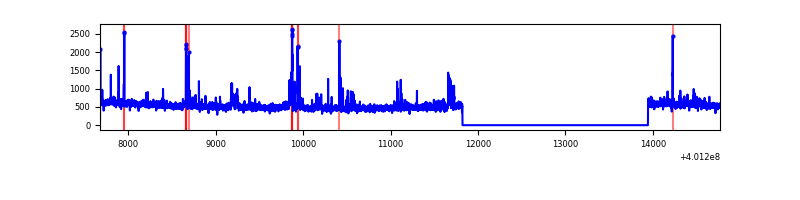 |
| C | 7093 | 4970 | 67 | 67 | 0.94% | 1.35% | 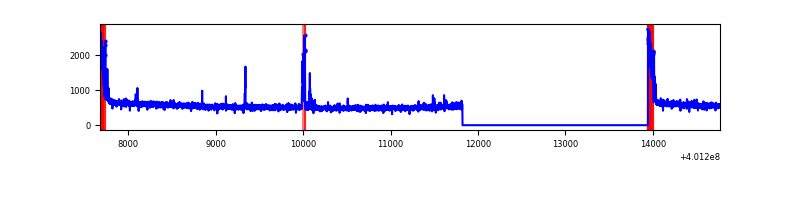 |
| D | 7093 | 4970 | 703 | 703 | 9.91% | 14.14% | 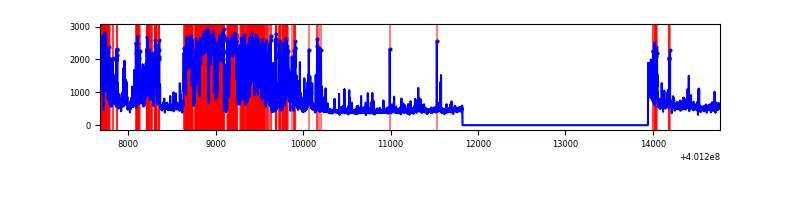 |
Top three noisy pixels from each quadrant. If the there are fewer than three noisy pixels in the level2.evt file, extra rows are filled as -1
| Pixel properties | Quadrant properties | ||||||
|---|---|---|---|---|---|---|---|
| Quadrant | DetID | PixID | Counts | Sigma | Mean | Median | Sigma |
| A | 15 | 222 | 2057784 | 16895.32 | 617 | 609 | 121.8 |
| A | 10 | 83 | 305218 | 2501.71 | 617 | 609 | 121.8 |
| A | 9 | 143 | 89424 | 729.43 | 617 | 609 | 121.8 |
| B | 5 | 172 | 86218 | 731.85 | 629 | 614 | 117.0 |
| B | 0 | 230 | 44411 | 374.43 | 629 | 614 | 117.0 |
| B | 15 | 85 | 35379 | 297.22 | 629 | 614 | 117.0 |
| C | 15 | 214 | 225394 | 1571.09 | 623 | 629 | 143.1 |
| C | 0 | 10 | 205849 | 1434.47 | 623 | 629 | 143.1 |
| C | 14 | 254 | 51692 | 356.93 | 623 | 629 | 143.1 |
| D | 12 | 227 | 1988262 | 13994.96 | 594 | 581 | 142.0 |
| D | 13 | 249 | 184436 | 1294.49 | 594 | 581 | 142.0 |
| D | 2 | 153 | 118830 | 832.57 | 594 | 581 | 142.0 |
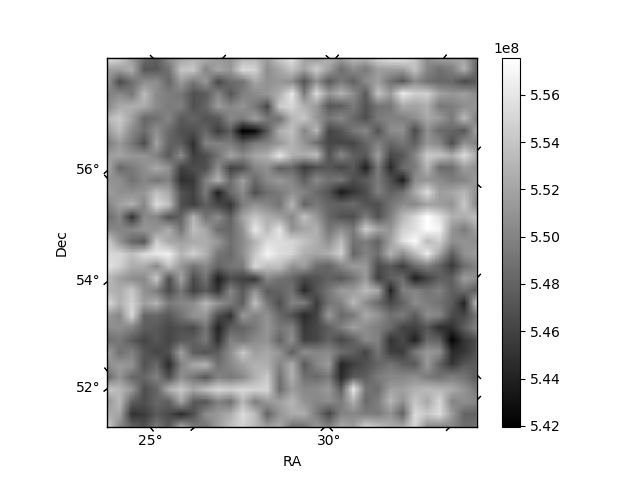
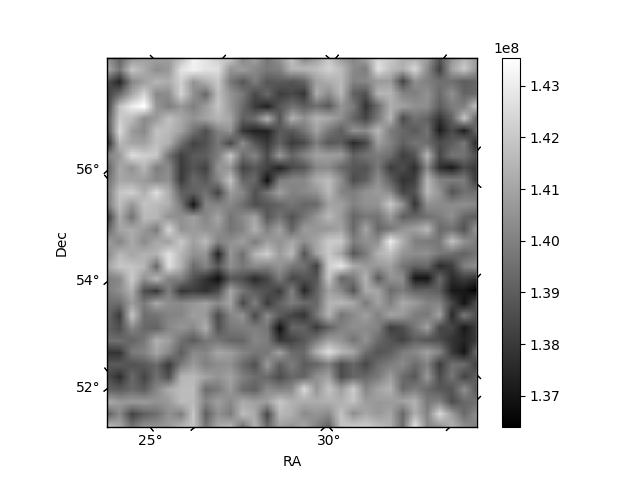
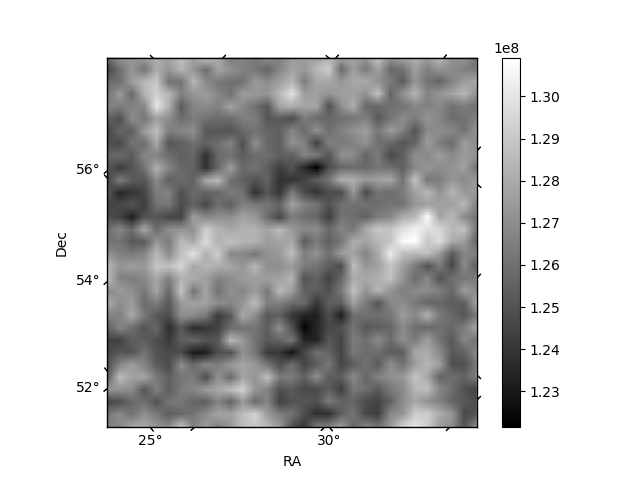
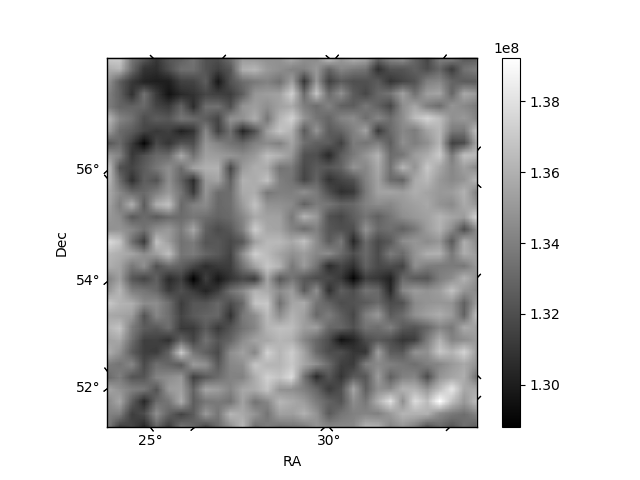
Histogram calculated using DETX and DETY for each event in the final _common_clean file
| Quadrant A | 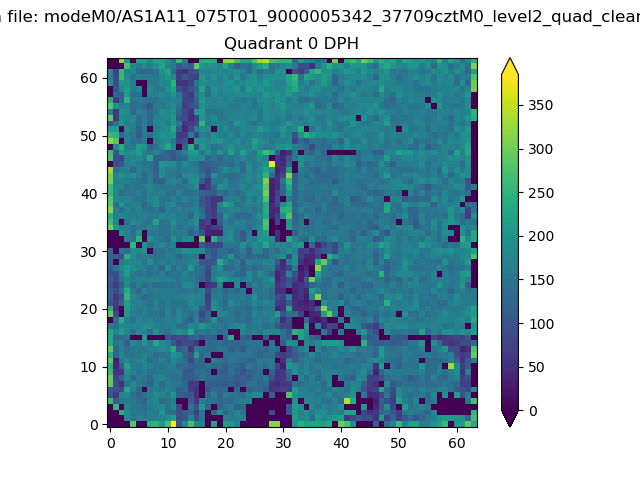 |
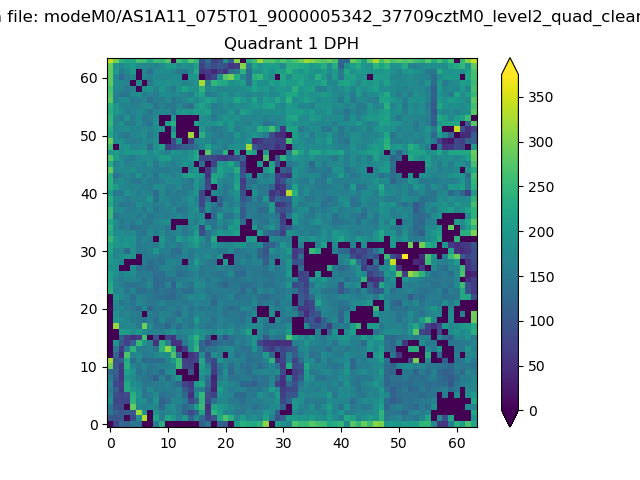 |
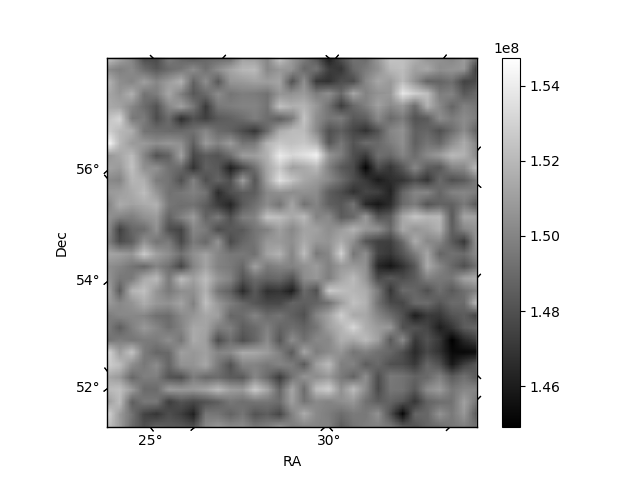
Quadrant B |
|---|---|---|---|
| Quadrant D | 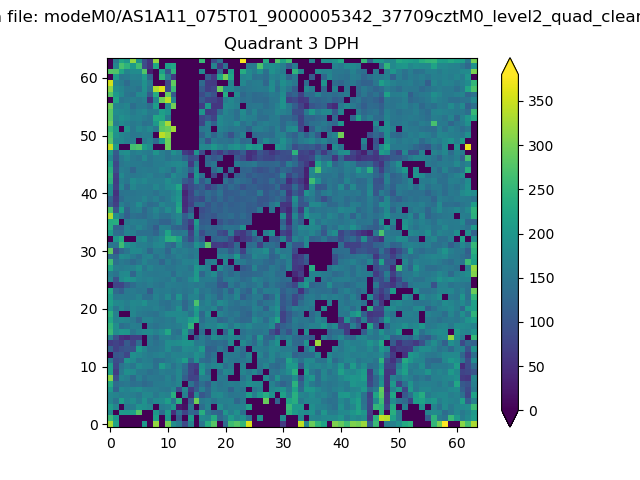 |
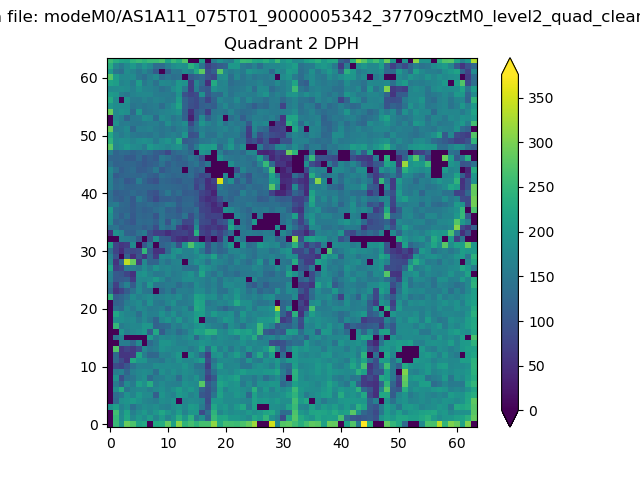 |
Quadrant C |
| Plot type | Count rate plots | Images |
|---|---|---|
| Comparison with Poisson distribution Blue bars denote a histogram of data divided into 1 sec bins. Red curve is a Poisson curve with rate = median count rate of data. |
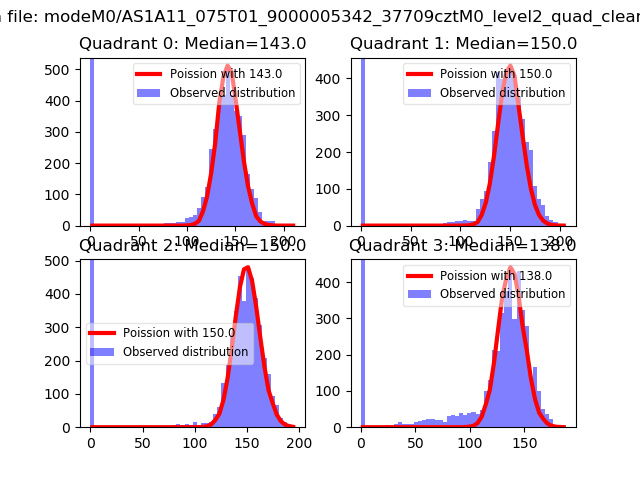 |
 |
| Quadrant-wise count rates Data is divided into 100 sec bins |
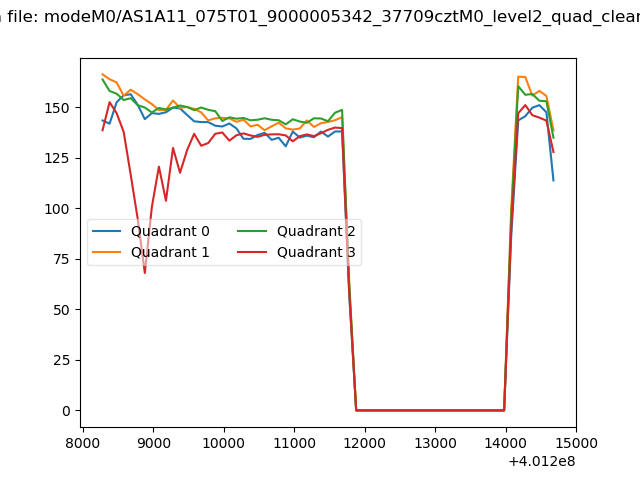 |
|
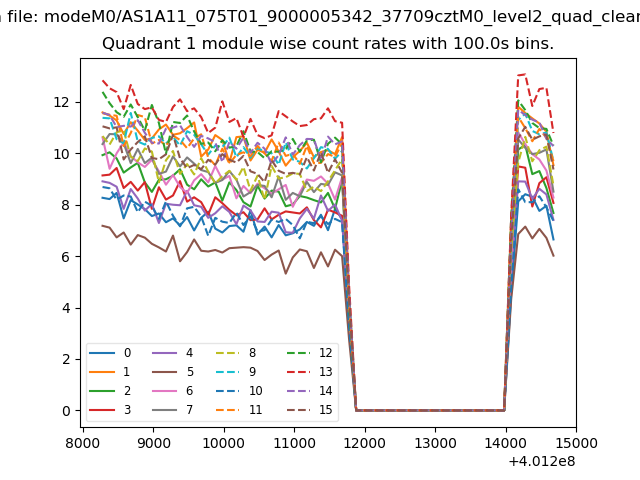
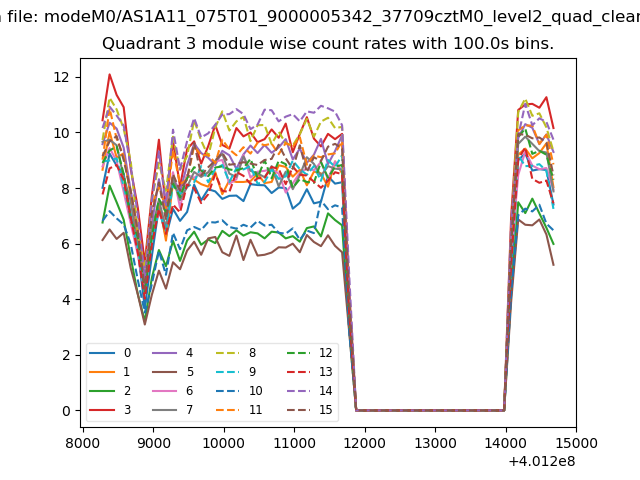
| Module-wise count rates for Quadrant A Data is divided into 100 sec bins |
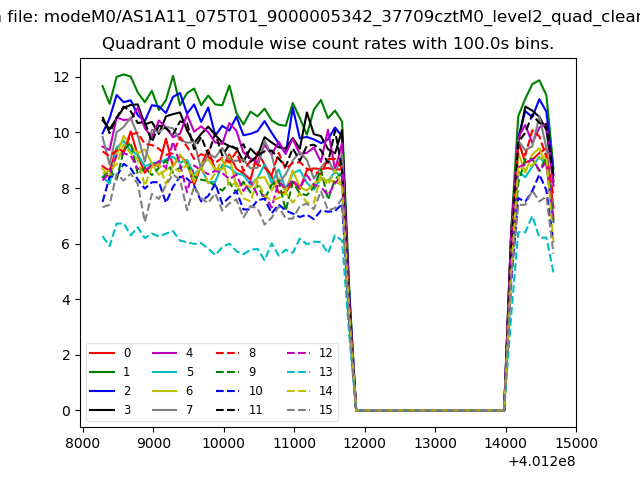 |
 |
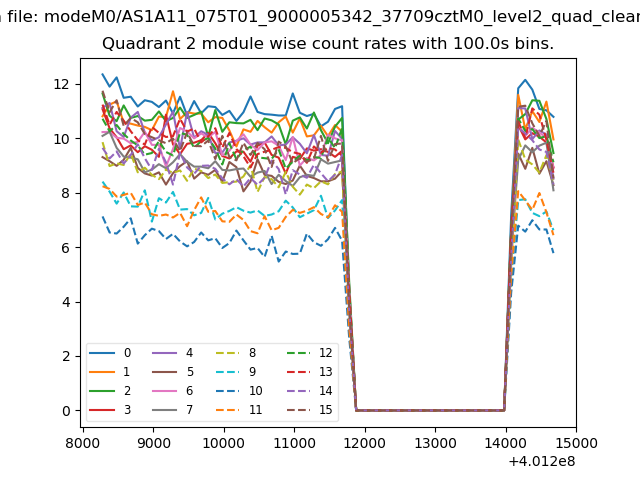
| Module-wise count rates for Quadrant B Data is divided into 100 sec bins |
 |
 |
| Module-wise count rates for Quadrant C Data is divided into 100 sec bins |
 |
 |
| Module-wise count rates for Quadrant D Data is divided into 100 sec bins |
 |
 |
| Parameter | Plot |
|---|---|
| CZT HV Monitor | 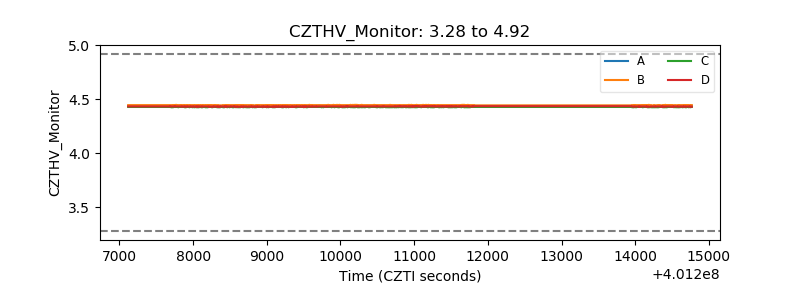 |
| D_VDD | 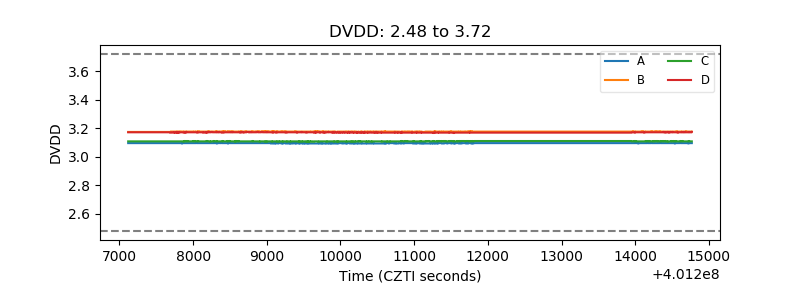 |
| Temperature 1 | 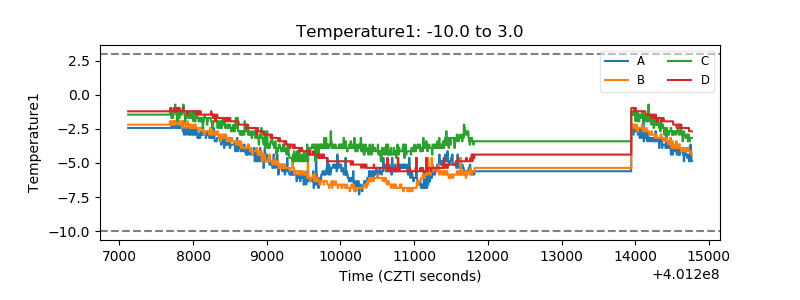 |
| Veto HV Monitor | 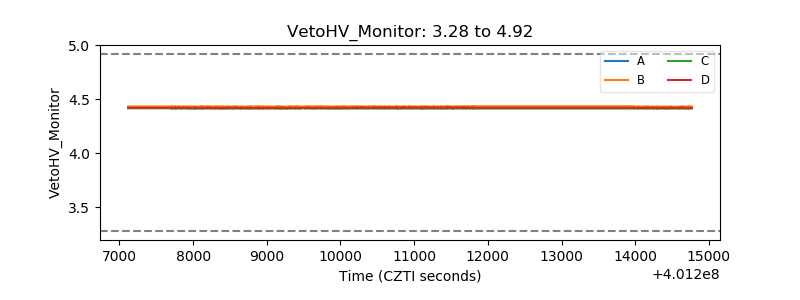 |
| Veto LLD | 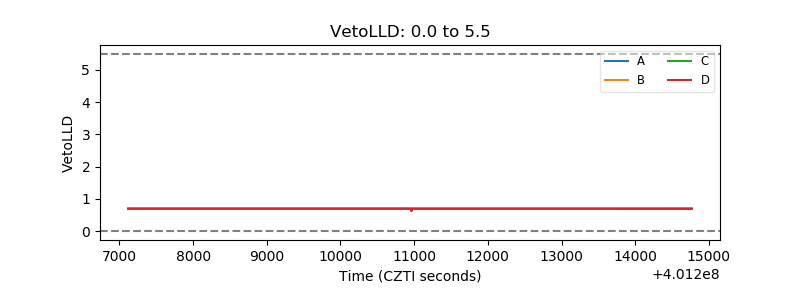 |
| Alpha Counter |  |
| _CPM_Rate | 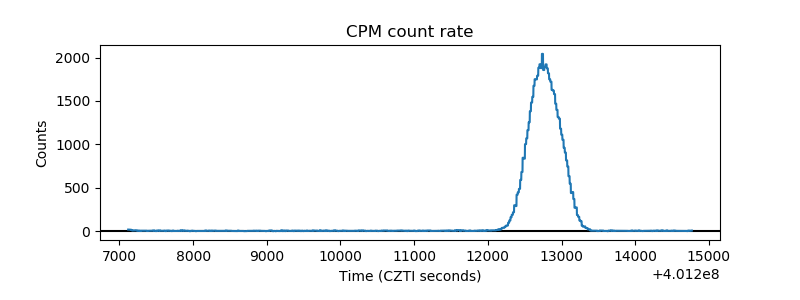 |
| CZT Counter | 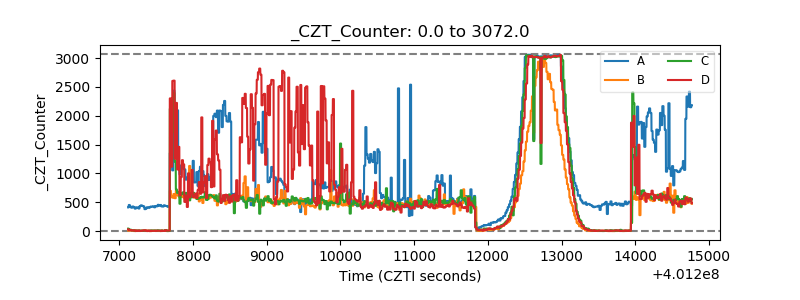 |
| +2.5 Volts monitor | 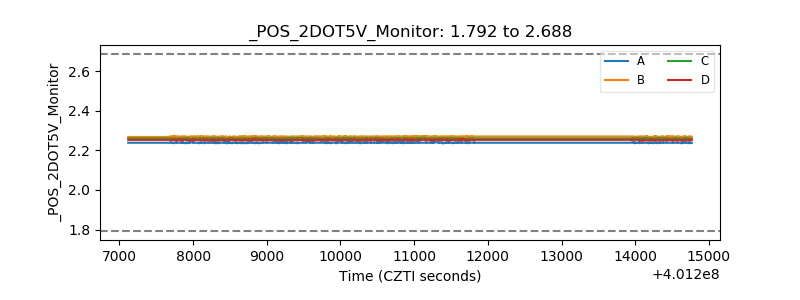 |
| +5 Volts monitor | 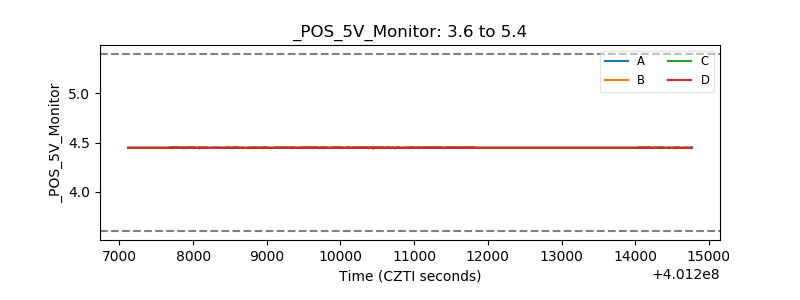 |
| _ROLL_ROT | 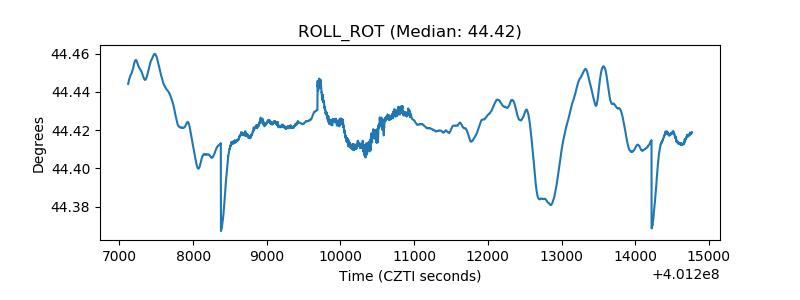 |
| _Roll_DEC | 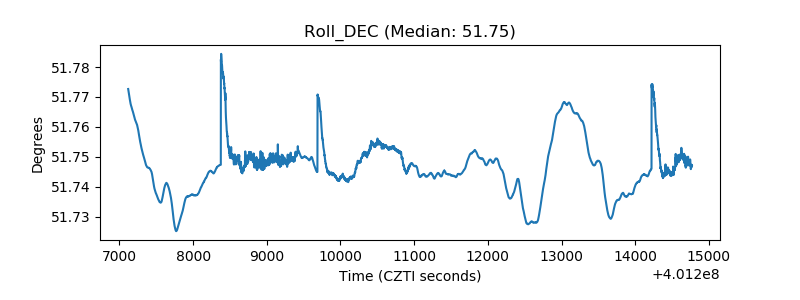 |
| _Roll_RA | 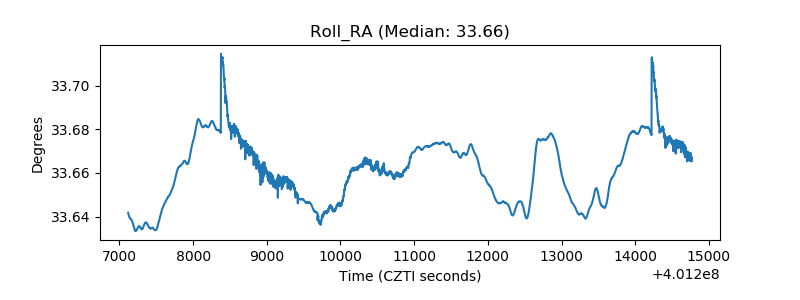 |
| Veto Counter | 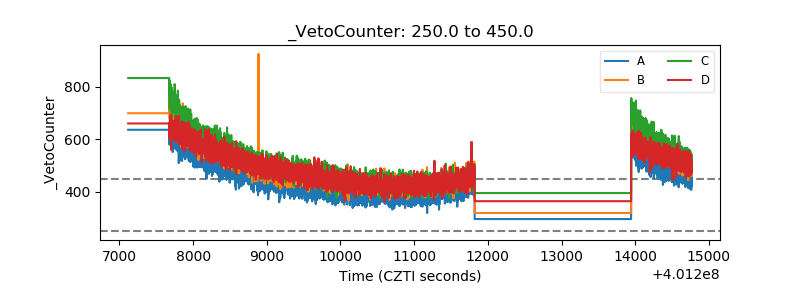 |