| Param | Original file | Final file |
|---|---|---|
| Filename | modeM0/AS1A11_075T01_9000005342_37710cztM0_level2.evt | modeM0/AS1A11_075T01_9000005342_37710cztM0_level2_quad_clean.evt |
| Size (bytes) | 488,445,120 | 96,266,880 |
| Size | 465.8 MB | 91.8 MB |
| Events in quadrant A | 6,192,757 | 612,568 |
| Events in quadrant B | 2,755,068 | 664,573 |
| Events in quadrant C | 2,685,738 | 669,487 |
| Events in quadrant D | 2,831,101 | 628,853 |
| Mode SS | |||
|---|---|---|---|
| Quadrant | BADHDUFLAG | Total packets | Discarded packets |
| A | 0 | 98 | 0 |
| B | 0 | 98 | 0 |
| C | 0 | 98 | 0 |
| D | 0 | 98 | 0 |
| Mode M0 | |||
|---|---|---|---|
| Quadrant | BADHDUFLAG | Total packets | Discarded packets |
| A | 0 | 21684 | 3 |
| B | 0 | 11184 | 2 |
| C | 0 | 10752 | 2 |
| D | 0 | 11627 | 2 |
| Mode M9 | |||
|---|---|---|---|
| Quadrant | BADHDUFLAG | Total packets | Discarded packets |
| A | 0 | 40 | 0 |
| B | 0 | 40 | 0 |
| C | 0 | 40 | 0 |
| D | 0 | 41 | 0 |
| Quadrant | Total seconds | Saturated seconds | Saturation percentage |
|---|---|---|---|
| A | 4844 | 815 | 16.824938% |
| B | 4844 | 92 | 1.899257% |
| C | 4844 | 70 | 1.445087% |
| D | 4844 | 63 | 1.300578% |
Noise dominated data is calculated using 1-second bins in cleaned event files. If a bin has >2000 counts, and if more than 50% of those come from <1% of pixels, then it is considered to be noise-dominated and hence unusable.
| Quadrant | # 1 sec bins | Bins with >0 counts | Bins with >2000 counts | High rate bins dominated by noise | Noise dominated (total time) | Noise dominated (detector-on time) | Marked lightcurve |
|---|---|---|---|---|---|---|---|
| A | 6965 | 4844 | 725 | 725 | 10.41% | 14.97% | 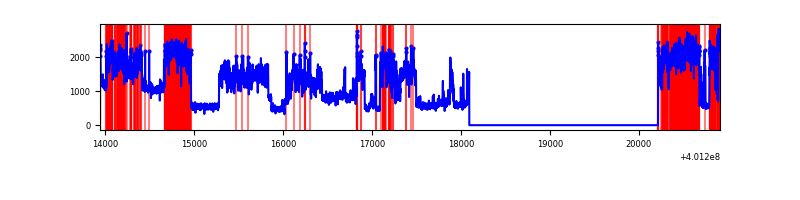 |
| B | 6964 | 4843 | 84 | 84 | 1.21% | 1.73% | 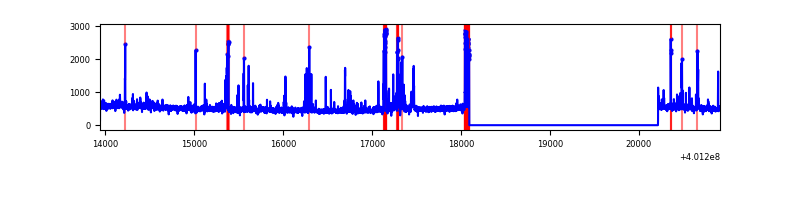 |
| C | 6964 | 4843 | 58 | 58 | 0.83% | 1.20% | 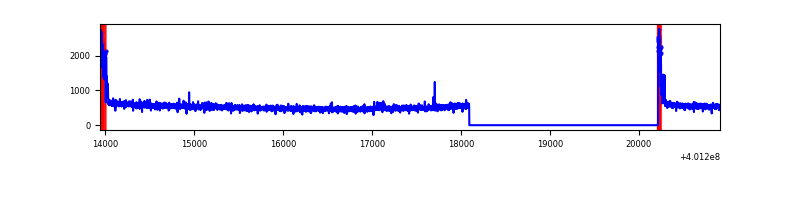 |
| D | 6964 | 4843 | 40 | 40 | 0.57% | 0.83% | 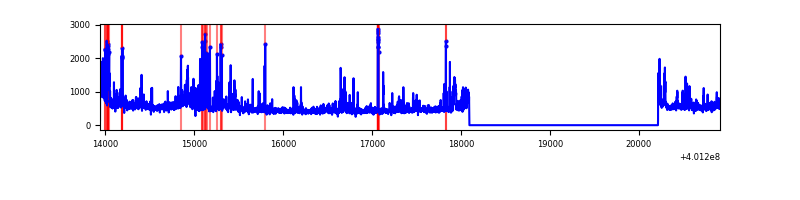 |
Top three noisy pixels from each quadrant. If the there are fewer than three noisy pixels in the level2.evt file, extra rows are filled as -1
| Pixel properties | Quadrant properties | ||||||
|---|---|---|---|---|---|---|---|
| Quadrant | DetID | PixID | Counts | Sigma | Mean | Median | Sigma |
| A | 15 | 222 | 3441619 | 30465.9 | 564 | 554 | 112.9 |
| A | 10 | 83 | 294875 | 2605.81 | 564 | 554 | 112.9 |
| A | 9 | 143 | 226267 | 1998.38 | 564 | 554 | 112.9 |
| B | 5 | 200 | 188003 | 1711.93 | 582 | 568 | 109.5 |
| B | 5 | 172 | 155894 | 1418.66 | 582 | 568 | 109.5 |
| B | 5 | 255 | 39915 | 359.37 | 582 | 568 | 109.5 |
| C | 15 | 214 | 219401 | 1630.34 | 582 | 588 | 134.2 |
| C | 0 | 10 | 183459 | 1362.54 | 582 | 588 | 134.2 |
| C | 3 | 233 | 8327 | 57.66 | 582 | 588 | 134.2 |
| D | 12 | 227 | 182599 | 1309.03 | 577 | 562 | 139.1 |
| D | 13 | 249 | 140280 | 1004.71 | 577 | 562 | 139.1 |
| D | 2 | 153 | 104875 | 750.12 | 577 | 562 | 139.1 |
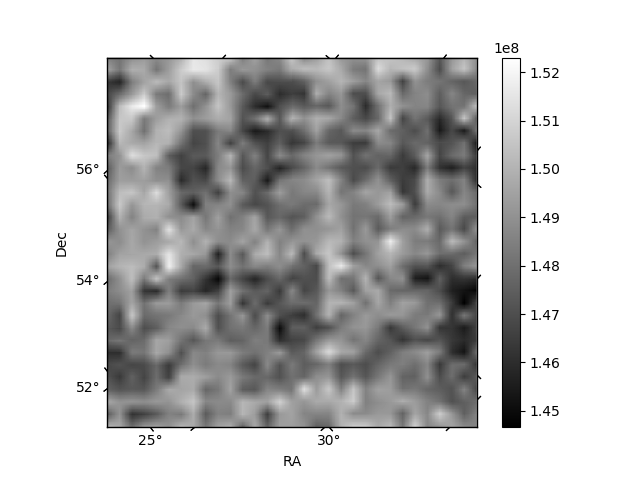
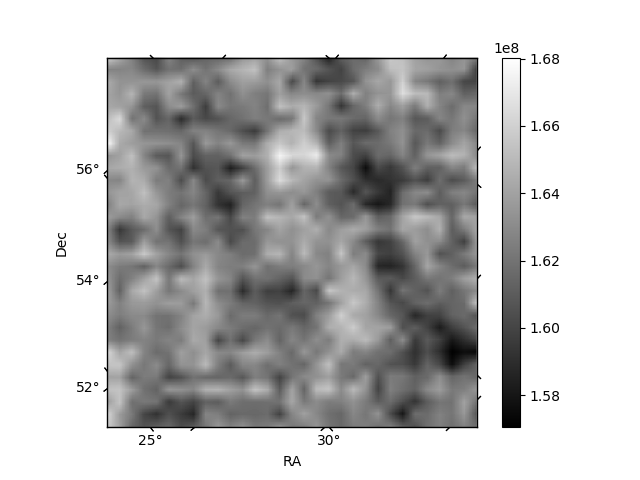
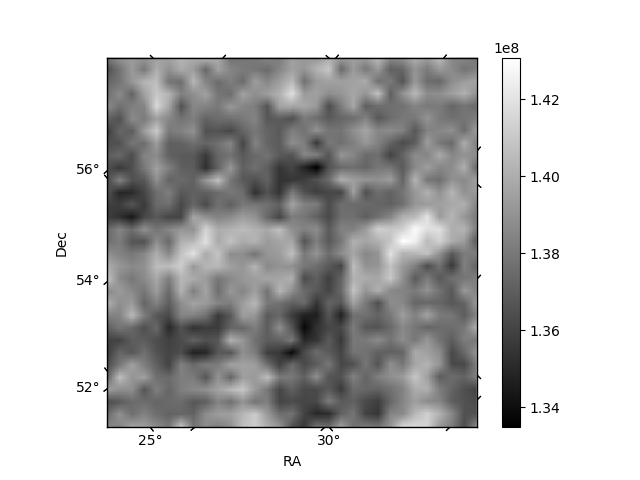
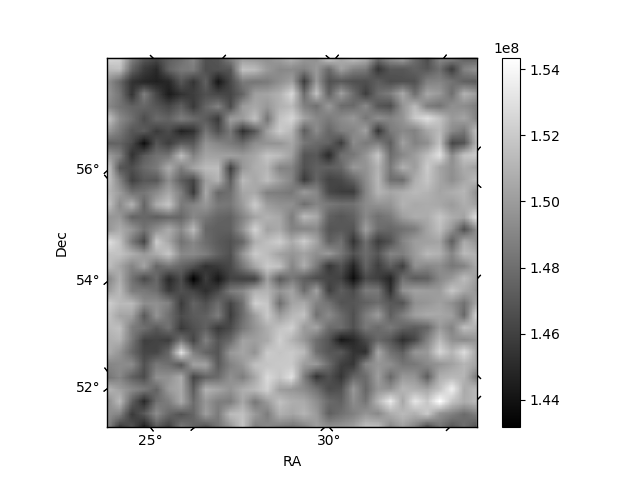
Histogram calculated using DETX and DETY for each event in the final _common_clean file
| Quadrant A | 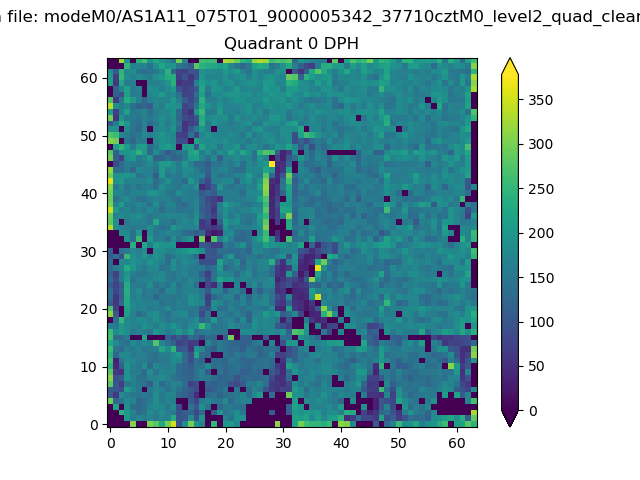 |
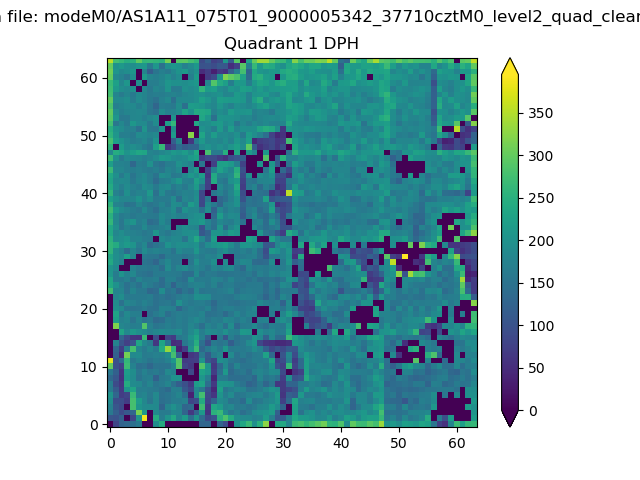 |
Quadrant B |
|---|---|---|---|
| Quadrant D | 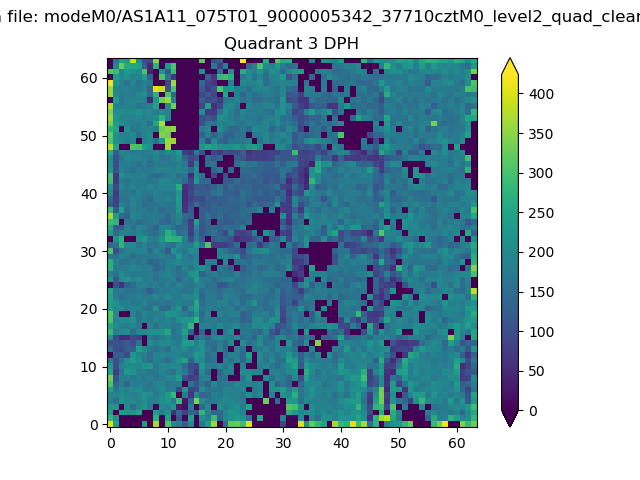 |
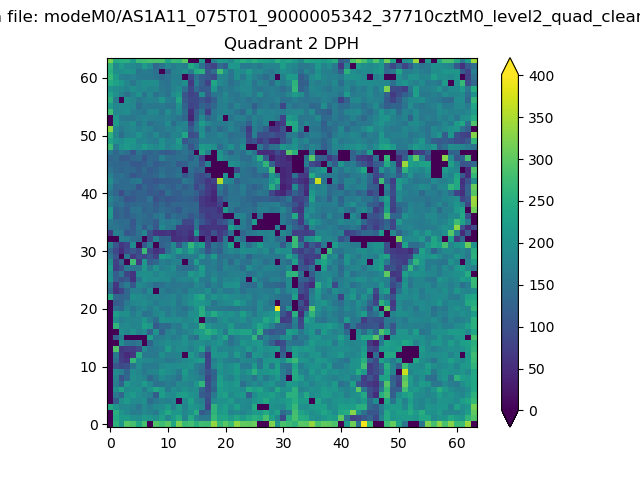 |
Quadrant C |
| Plot type | Count rate plots | Images |
|---|---|---|
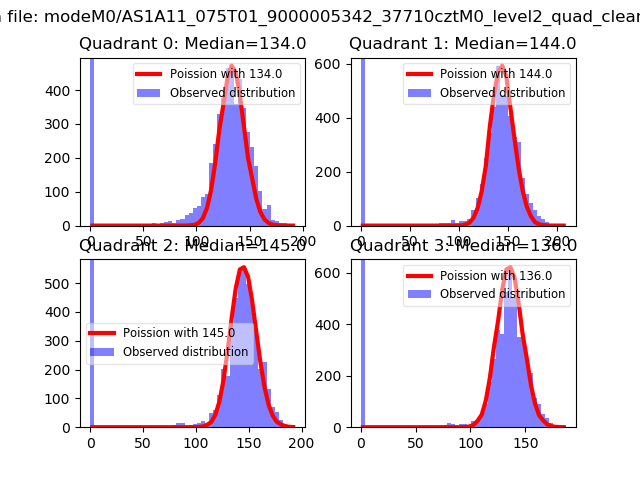
| Comparison with Poisson distribution Blue bars denote a histogram of data divided into 1 sec bins. Red curve is a Poisson curve with rate = median count rate of data. |
 |
 |
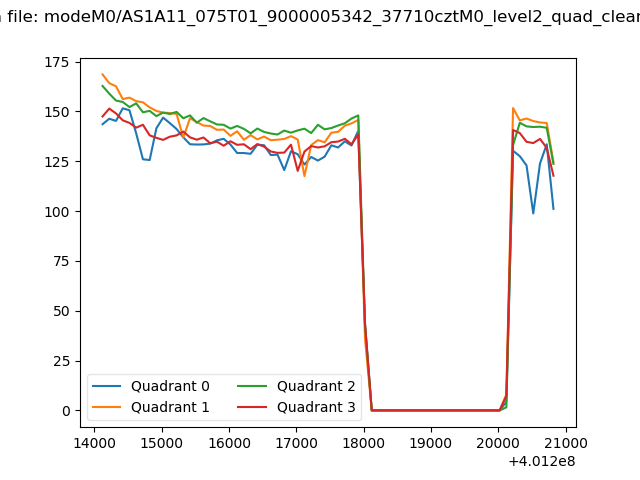
| Quadrant-wise count rates Data is divided into 100 sec bins |
 |
|
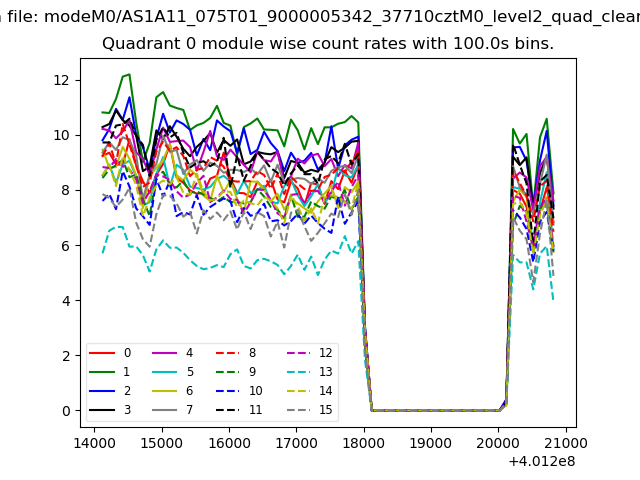
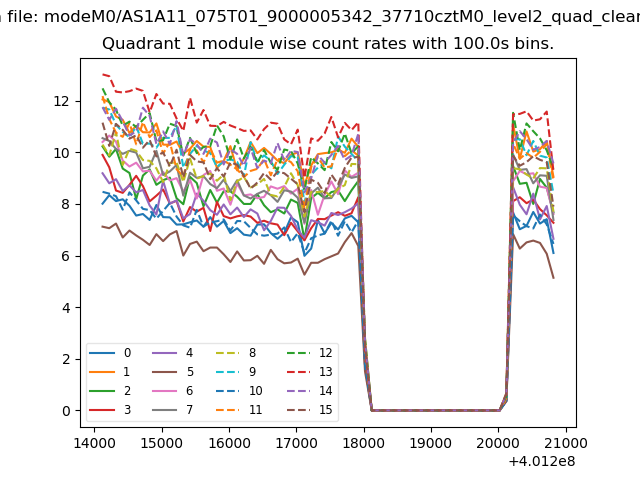
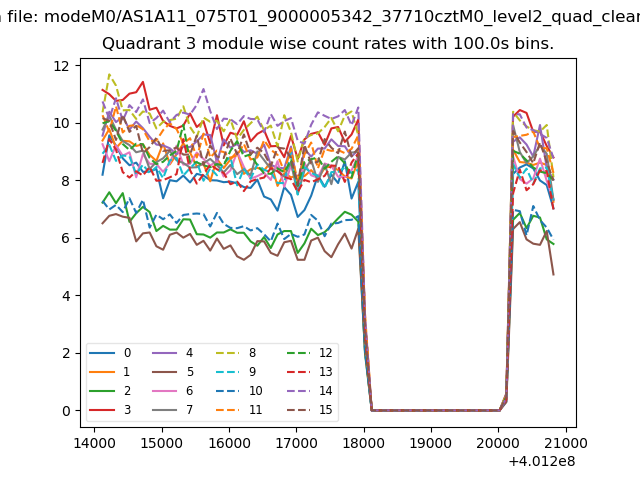
| Module-wise count rates for Quadrant A Data is divided into 100 sec bins |
 |
 |
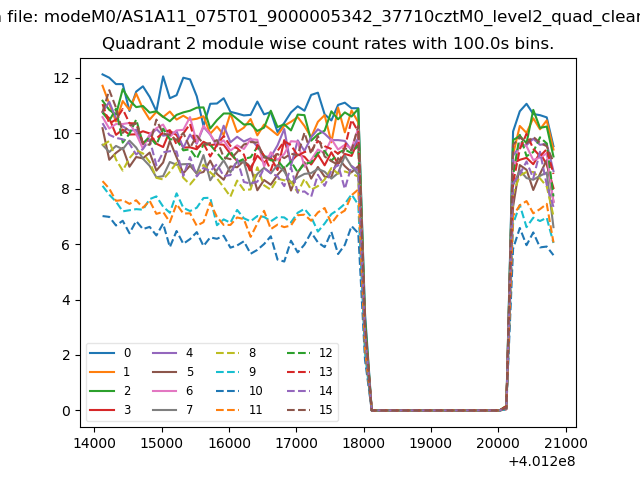
| Module-wise count rates for Quadrant B Data is divided into 100 sec bins |
 |
 |
| Module-wise count rates for Quadrant C Data is divided into 100 sec bins |
 |
 |
| Module-wise count rates for Quadrant D Data is divided into 100 sec bins |
 |
 |
| Parameter | Plot |
|---|---|
| CZT HV Monitor | 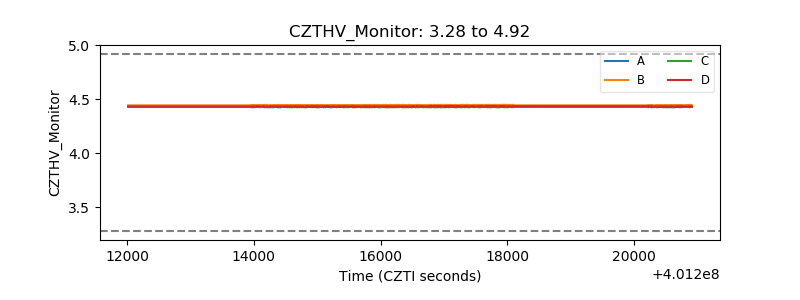 |
| D_VDD | 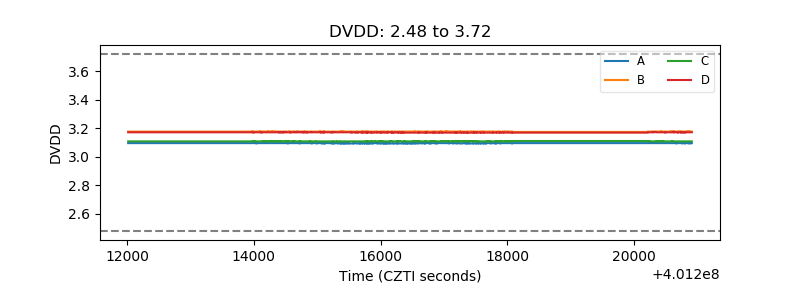 |
| Temperature 1 | 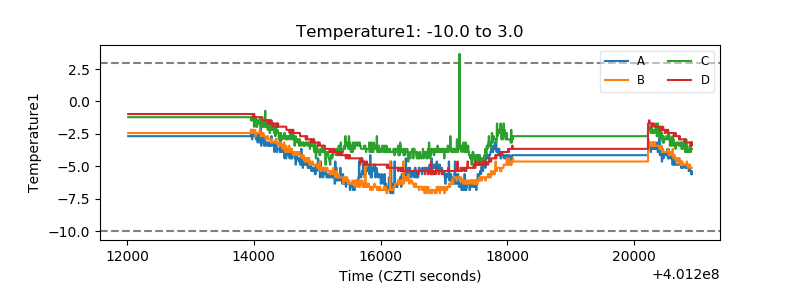 |
| Veto HV Monitor | 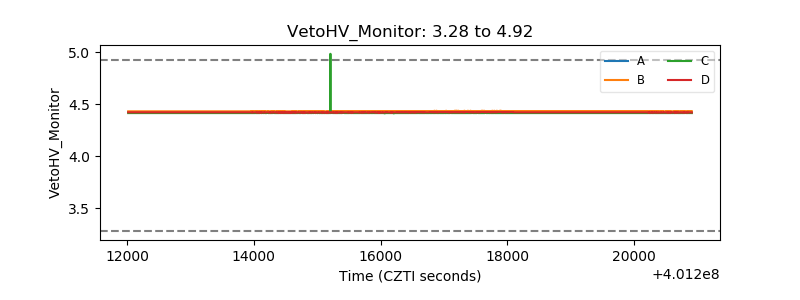 |
| Veto LLD | 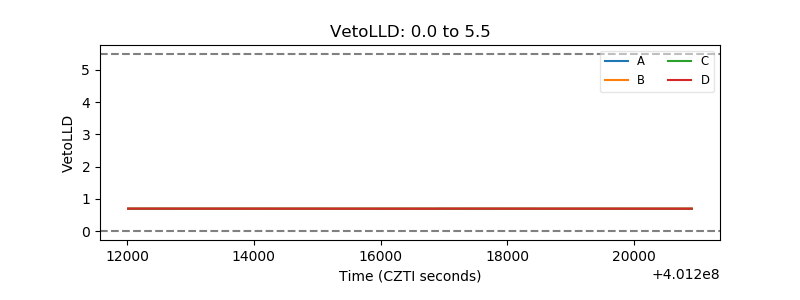 |
| Alpha Counter | 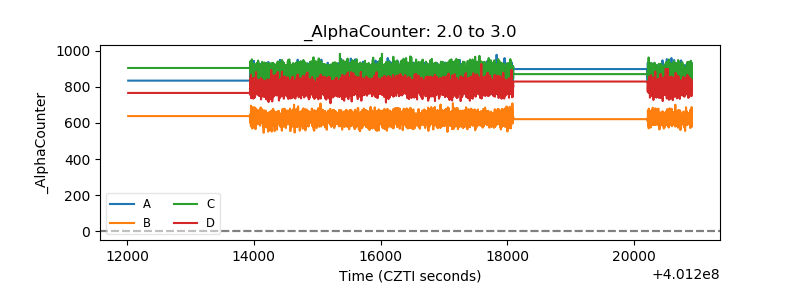 |
| _CPM_Rate | 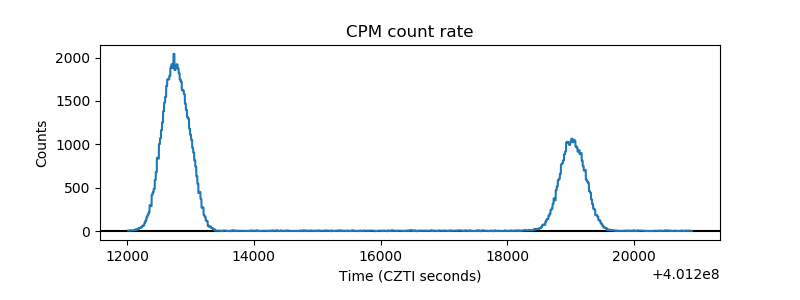 |
| CZT Counter | 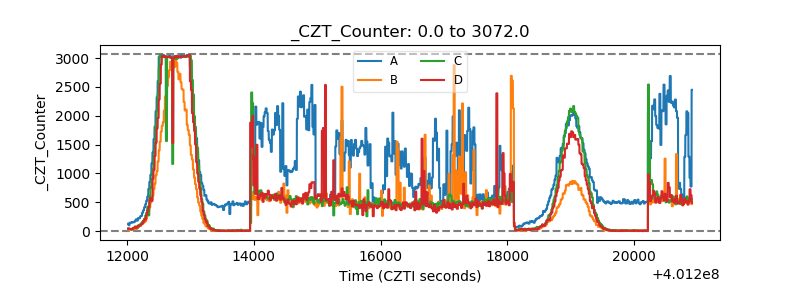 |
| +2.5 Volts monitor |  |
| +5 Volts monitor | 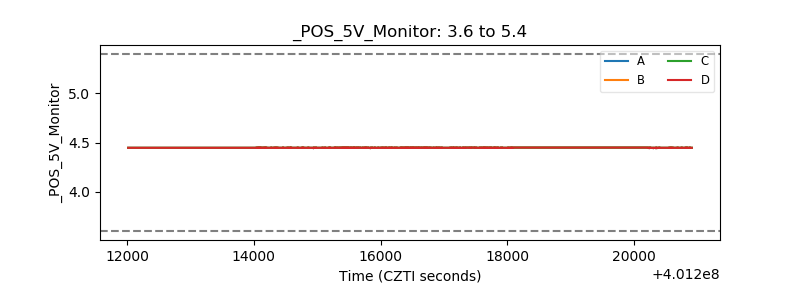 |
| _ROLL_ROT | 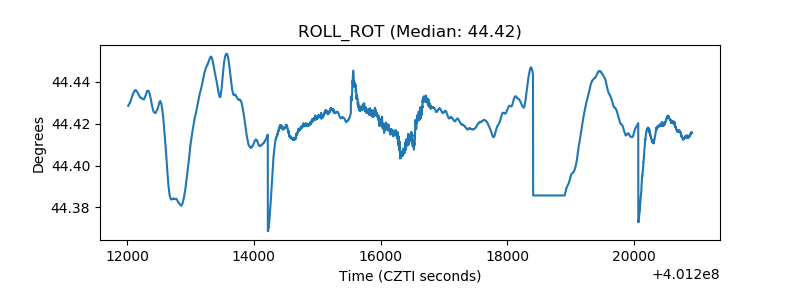 |
| _Roll_DEC | 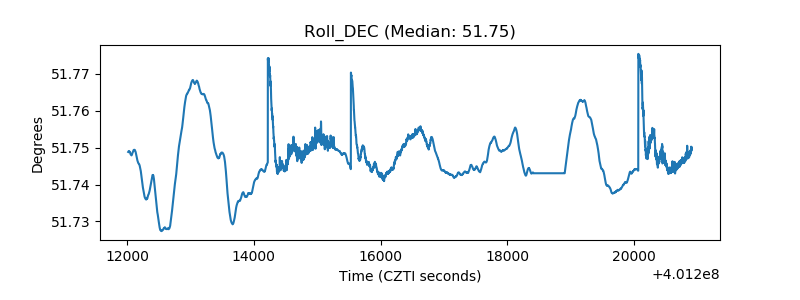 |
| _Roll_RA | 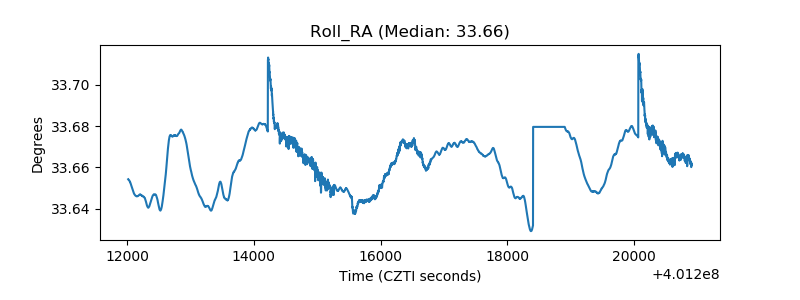 |
| Veto Counter | 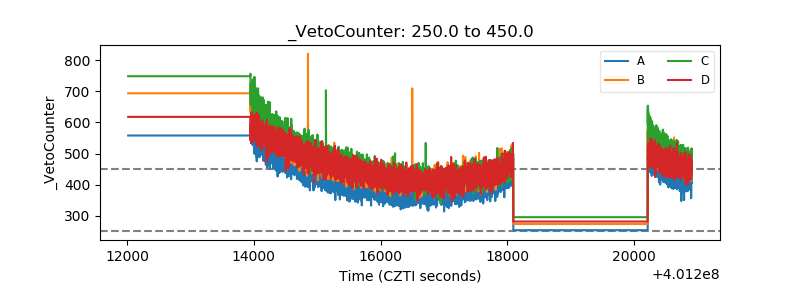 |