| Param | Original file | Final file |
|---|---|---|
| Filename | modeM0/AS1A11_075T01_9000005342_37711cztM0_level2.evt | modeM0/AS1A11_075T01_9000005342_37711cztM0_level2_quad_clean.evt |
| Size (bytes) | 485,092,800 | 87,004,800 |
| Size | 462.6 MB | 83.0 MB |
| Events in quadrant A | 5,619,667 | 542,712 |
| Events in quadrant B | 2,723,919 | 590,236 |
| Events in quadrant C | 2,572,227 | 595,382 |
| Events in quadrant D | 3,440,242 | 559,716 |
| Mode SS | |||
|---|---|---|---|
| Quadrant | BADHDUFLAG | Total packets | Discarded packets |
| A | 0 | 102 | 0 |
| B | 0 | 102 | 0 |
| C | 0 | 102 | 0 |
| D | 0 | 102 | 0 |
| Mode M0 | |||
|---|---|---|---|
| Quadrant | BADHDUFLAG | Total packets | Discarded packets |
| A | 0 | 19937 | 3 |
| B | 0 | 11272 | 2 |
| C | 0 | 10551 | 2 |
| D | 0 | 13731 | 2 |
| Mode M9 | |||
|---|---|---|---|
| Quadrant | BADHDUFLAG | Total packets | Discarded packets |
| A | 0 | 32 | 0 |
| B | 0 | 32 | 0 |
| C | 0 | 32 | 0 |
| D | 0 | 33 | 0 |
| Quadrant | Total seconds | Saturated seconds | Saturation percentage |
|---|---|---|---|
| A | 4935 | 688 | 13.941236% |
| B | 4935 | 89 | 1.803445% |
| C | 4935 | 52 | 1.053698% |
| D | 4935 | 319 | 6.464032% |
Noise dominated data is calculated using 1-second bins in cleaned event files. If a bin has >2000 counts, and if more than 50% of those come from <1% of pixels, then it is considered to be noise-dominated and hence unusable.
| Quadrant | # 1 sec bins | Bins with >0 counts | Bins with >2000 counts | High rate bins dominated by noise | Noise dominated (total time) | Noise dominated (detector-on time) | Marked lightcurve |
|---|---|---|---|---|---|---|---|
| A | 6997 | 4934 | 732 | 732 | 10.46% | 14.84% | 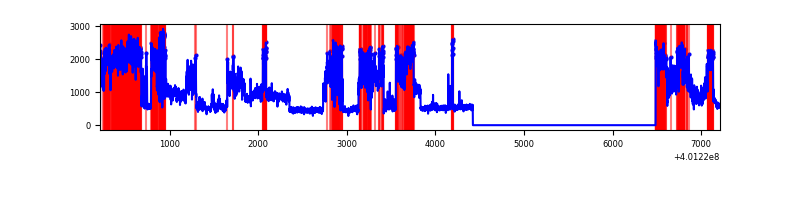 |
| B | 6997 | 4934 | 74 | 74 | 1.06% | 1.50% | 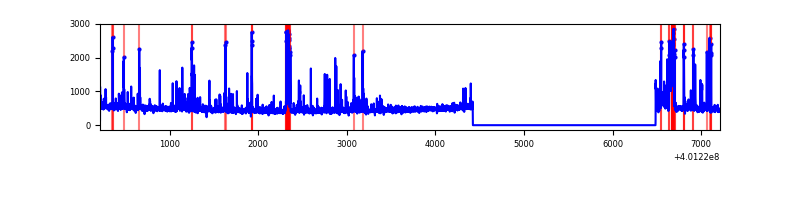 |
| C | 6997 | 4934 | 41 | 41 | 0.59% | 0.83% | 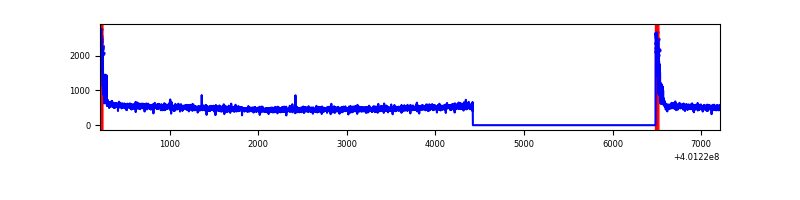 |
| D | 6997 | 4934 | 325 | 325 | 4.64% | 6.59% | 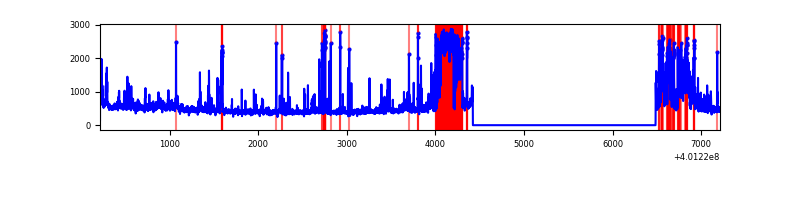 |
Top three noisy pixels from each quadrant. If the there are fewer than three noisy pixels in the level2.evt file, extra rows are filled as -1
| Pixel properties | Quadrant properties | ||||||
|---|---|---|---|---|---|---|---|
| Quadrant | DetID | PixID | Counts | Sigma | Mean | Median | Sigma |
| A | 15 | 222 | 2896641 | 26599.02 | 543 | 535 | 108.9 |
| A | 9 | 143 | 295994 | 2713.62 | 543 | 535 | 108.9 |
| A | 10 | 83 | 287279 | 2633.57 | 543 | 535 | 108.9 |
| B | 5 | 255 | 253592 | 2358.09 | 564 | 550 | 107.3 |
| B | 5 | 172 | 177926 | 1652.96 | 564 | 550 | 107.3 |
| B | 0 | 230 | 27032 | 246.78 | 564 | 550 | 107.3 |
| C | 15 | 214 | 223909 | 1714.32 | 563 | 568 | 130.3 |
| C | 0 | 10 | 152308 | 1164.73 | 563 | 568 | 130.3 |
| C | 13 | 61 | 3718 | 24.18 | 563 | 568 | 130.3 |
| D | 12 | 227 | 787613 | 5988.22 | 543 | 529 | 131.4 |
| D | 13 | 249 | 245527 | 1863.97 | 543 | 529 | 131.4 |
| D | 2 | 153 | 140961 | 1068.42 | 543 | 529 | 131.4 |
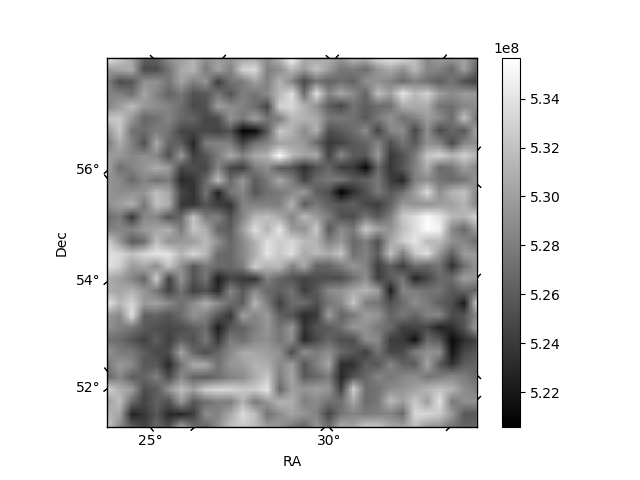
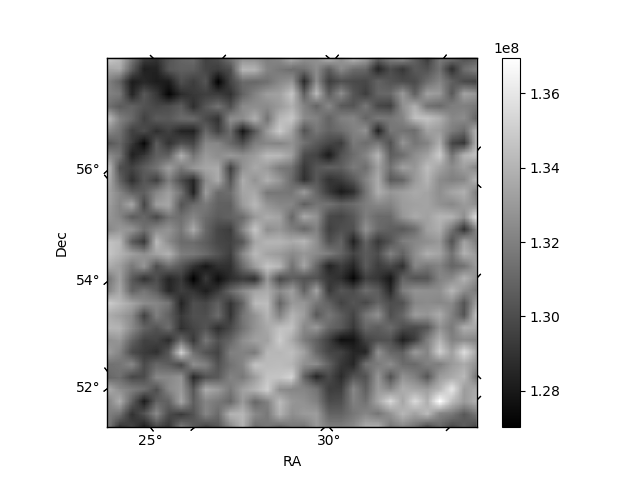
Histogram calculated using DETX and DETY for each event in the final _common_clean file
| Quadrant A | 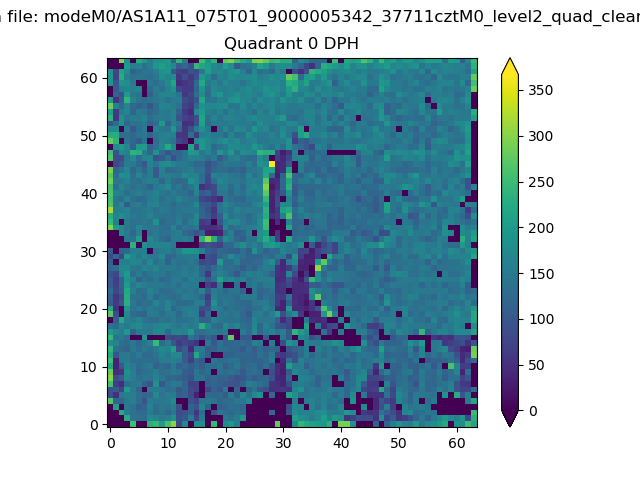 |
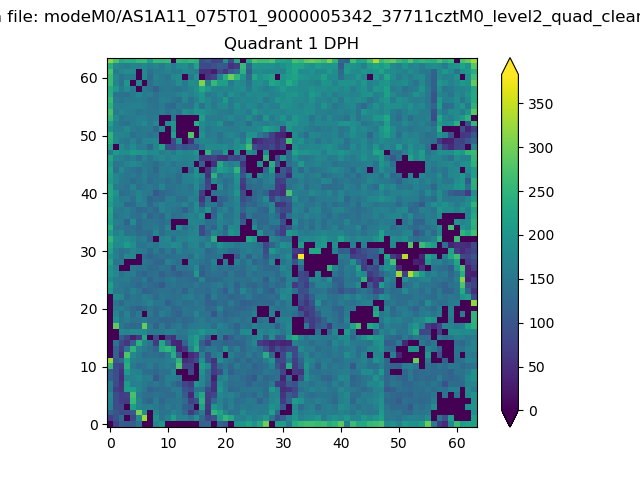 |
Quadrant B |
|---|---|---|---|
| Quadrant D | 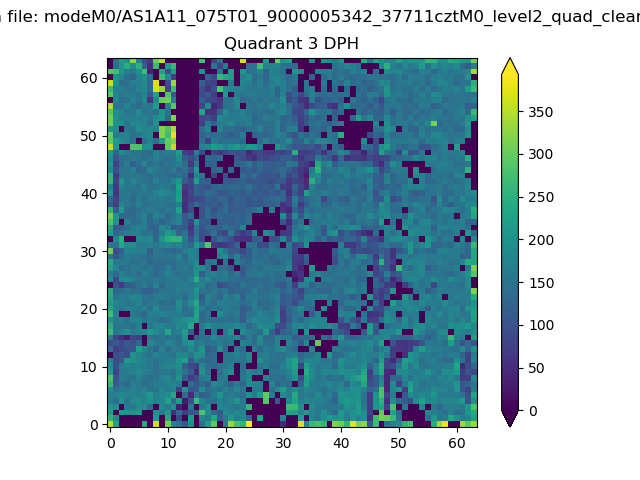 |
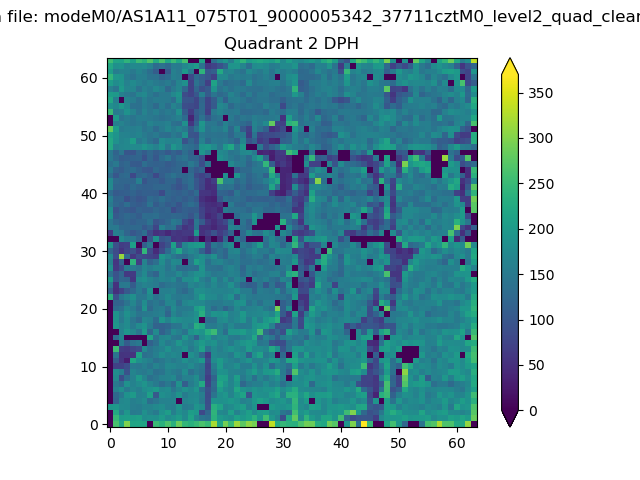 |
Quadrant C |
| Plot type | Count rate plots | Images |
|---|---|---|
| Comparison with Poisson distribution Blue bars denote a histogram of data divided into 1 sec bins. Red curve is a Poisson curve with rate = median count rate of data. |
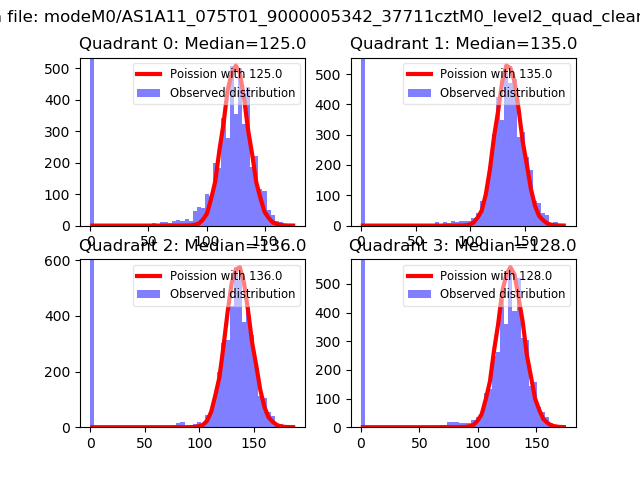 |
 |
| Quadrant-wise count rates Data is divided into 100 sec bins |
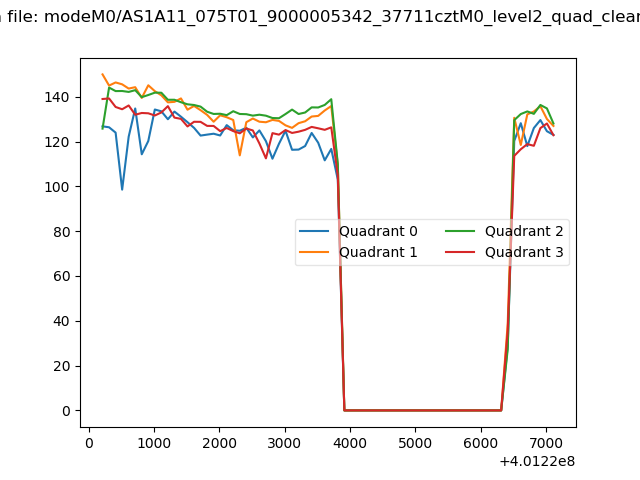 |
|
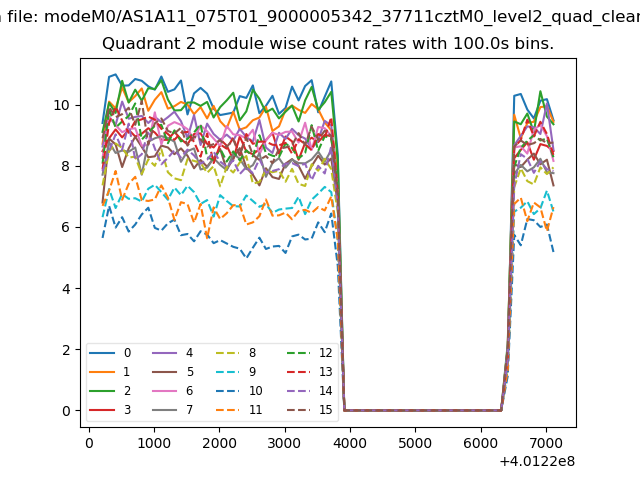
| Module-wise count rates for Quadrant A Data is divided into 100 sec bins |
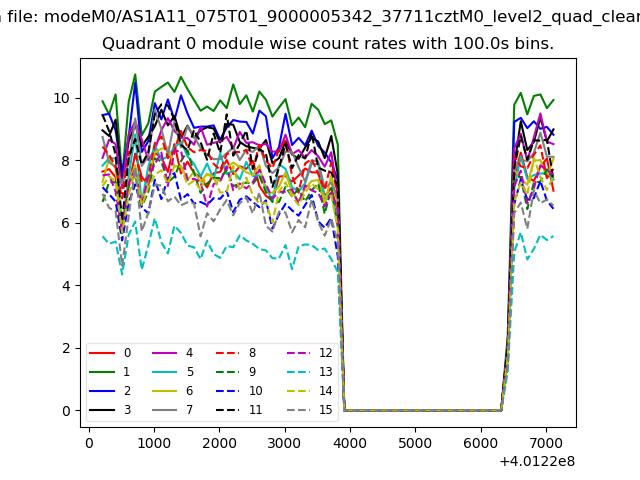 |
 |
| Module-wise count rates for Quadrant B Data is divided into 100 sec bins |
 |
 |
| Module-wise count rates for Quadrant C Data is divided into 100 sec bins |
 |
 |
| Module-wise count rates for Quadrant D Data is divided into 100 sec bins |
 |
 |
| Parameter | Plot |
|---|---|
| CZT HV Monitor | 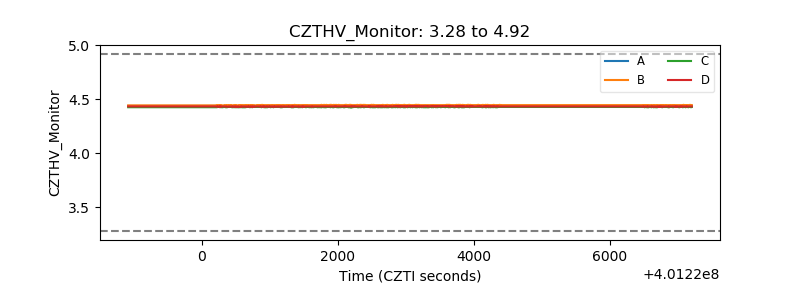 |
| D_VDD | 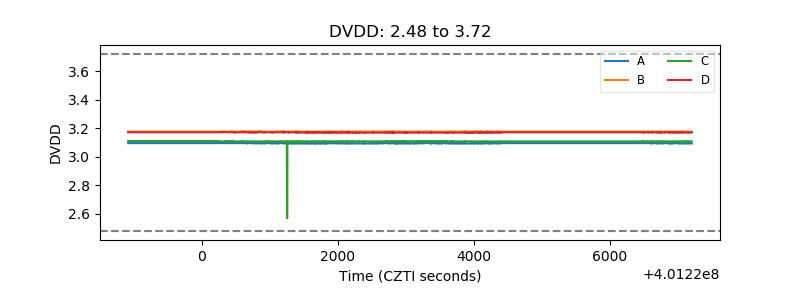 |
| Temperature 1 | 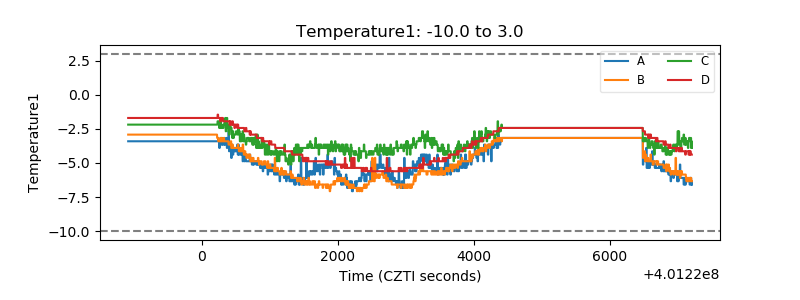 |
| Veto HV Monitor | 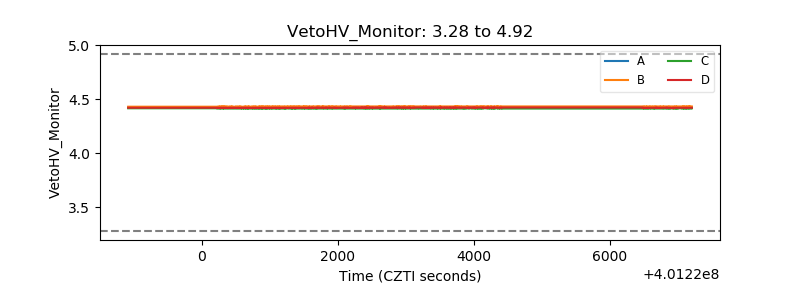 |
| Veto LLD | 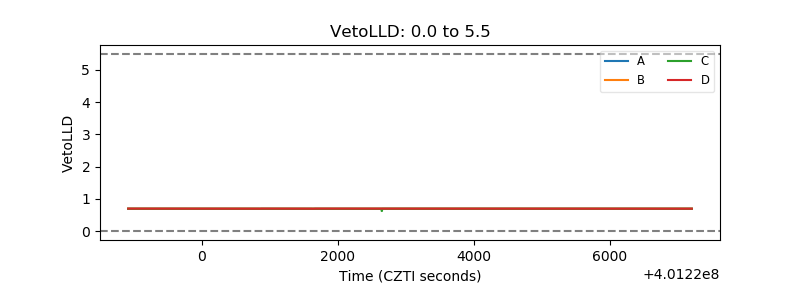 |
| Alpha Counter | 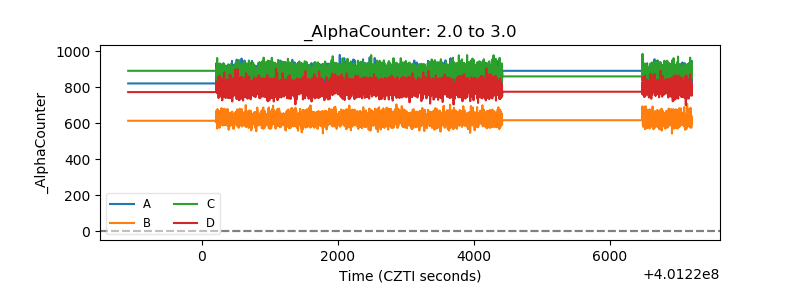 |
| _CPM_Rate | 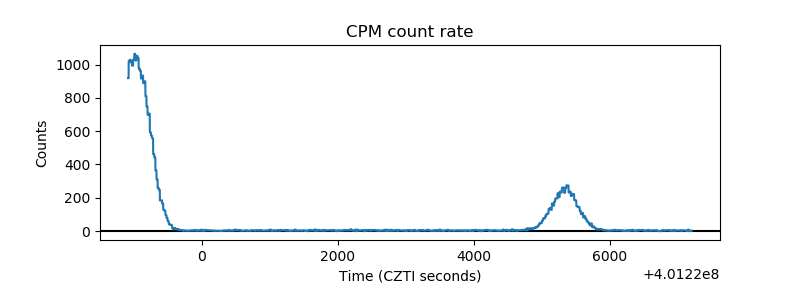 |
| CZT Counter | 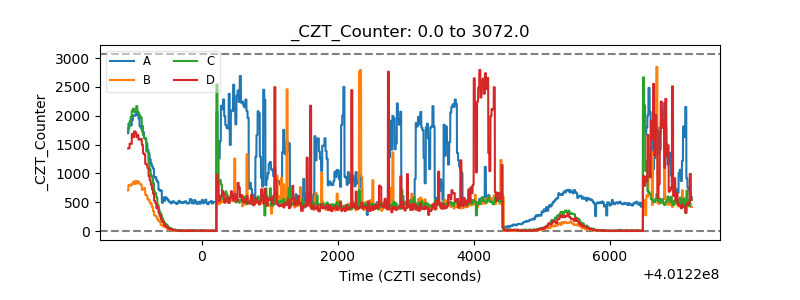 |
| +2.5 Volts monitor | 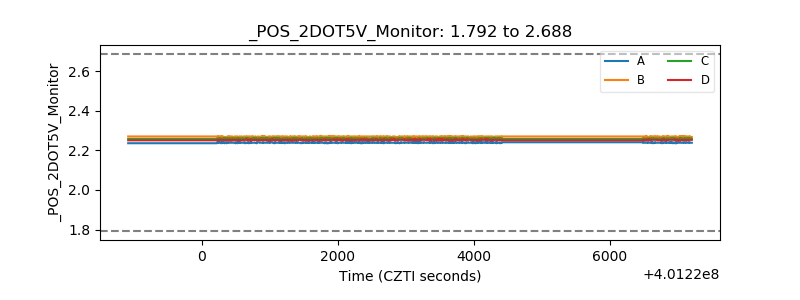 |
| +5 Volts monitor | 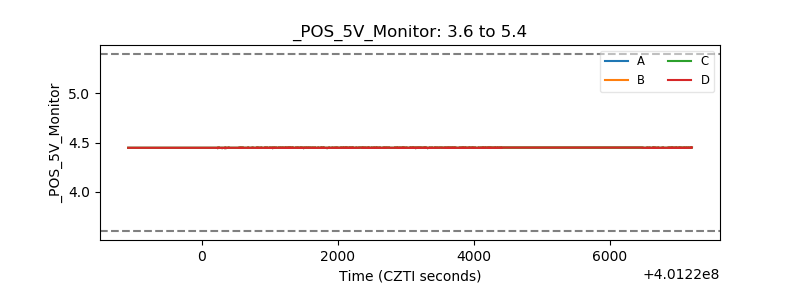 |
| _ROLL_ROT | 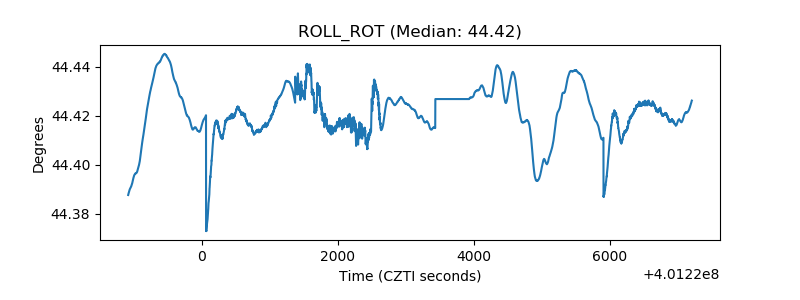 |
| _Roll_DEC | 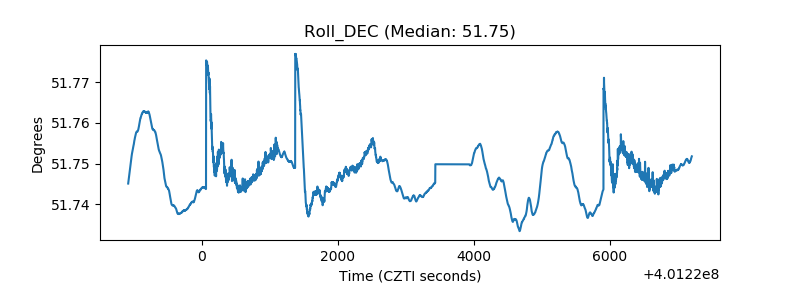 |
| _Roll_RA | 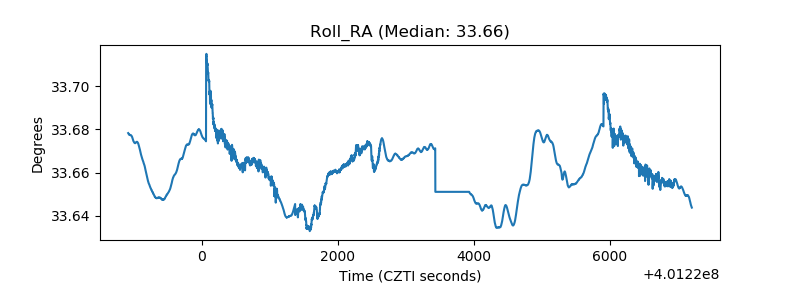 |
| Veto Counter | 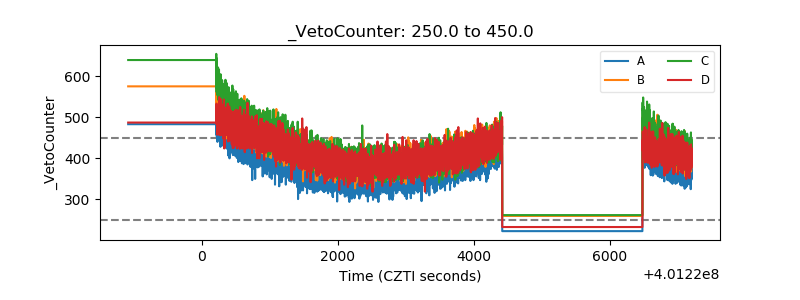 |