| Param | Original file | Final file |
|---|---|---|
| Filename | modeM0/AS1A11_075T01_9000005342_37712cztM0_level2.evt | modeM0/AS1A11_075T01_9000005342_37712cztM0_level2_quad_clean.evt |
| Size (bytes) | 664,225,920 | 76,622,400 |
| Size | 633.5 MB | 73.1 MB |
| Events in quadrant A | 7,835,810 | 456,834 |
| Events in quadrant B | 3,087,807 | 500,104 |
| Events in quadrant C | 2,886,275 | 512,962 |
| Events in quadrant D | 5,921,713 | 451,423 |
| Mode SS | |||
|---|---|---|---|
| Quadrant | BADHDUFLAG | Total packets | Discarded packets |
| A | 0 | 118 | 0 |
| B | 0 | 118 | 0 |
| C | 0 | 118 | 0 |
| D | 0 | 118 | 0 |
| Mode M0 | |||
|---|---|---|---|
| Quadrant | BADHDUFLAG | Total packets | Discarded packets |
| A | 0 | 27057 | 3 |
| B | 0 | 12930 | 2 |
| C | 0 | 12043 | 2 |
| D | 0 | 21492 | 2 |
| Mode M9 | |||
|---|---|---|---|
| Quadrant | BADHDUFLAG | Total packets | Discarded packets |
| A | 0 | 38 | 0 |
| B | 0 | 38 | 0 |
| C | 0 | 38 | 0 |
| D | 0 | 38 | 0 |
| Quadrant | Total seconds | Saturated seconds | Saturation percentage |
|---|---|---|---|
| A | 5696 | 1259 | 22.103230% |
| B | 5696 | 100 | 1.755618% |
| C | 5696 | 37 | 0.649579% |
| D | 5696 | 826 | 14.501404% |
Noise dominated data is calculated using 1-second bins in cleaned event files. If a bin has >2000 counts, and if more than 50% of those come from <1% of pixels, then it is considered to be noise-dominated and hence unusable.
| Quadrant | # 1 sec bins | Bins with >0 counts | Bins with >2000 counts | High rate bins dominated by noise | Noise dominated (total time) | Noise dominated (detector-on time) | Marked lightcurve |
|---|---|---|---|---|---|---|---|
| A | 9551 | 5695 | 1380 | 1380 | 14.45% | 24.23% | 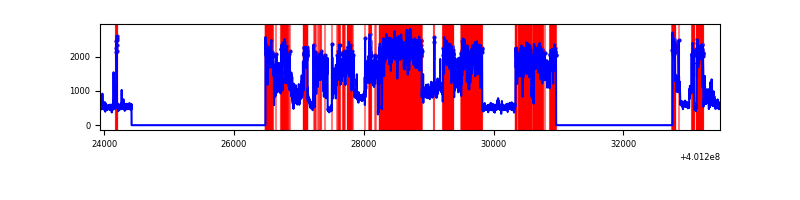 |
| B | 9551 | 5695 | 82 | 82 | 0.86% | 1.44% | 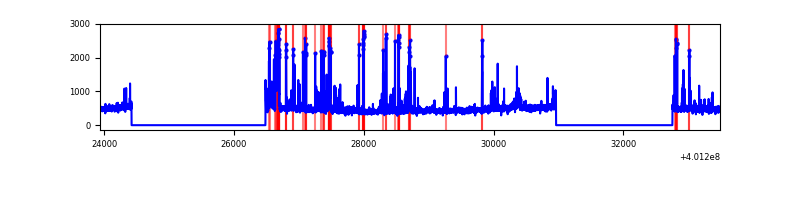 |
| C | 9551 | 5695 | 24 | 24 | 0.25% | 0.42% | 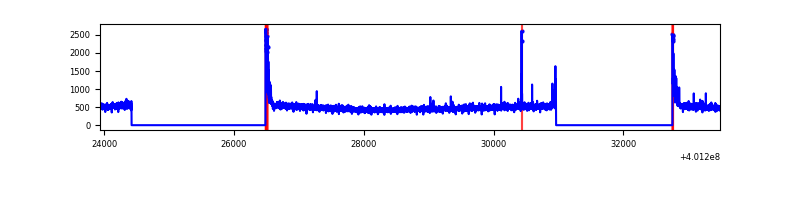 |
| D | 9551 | 5695 | 980 | 980 | 10.26% | 17.21% | 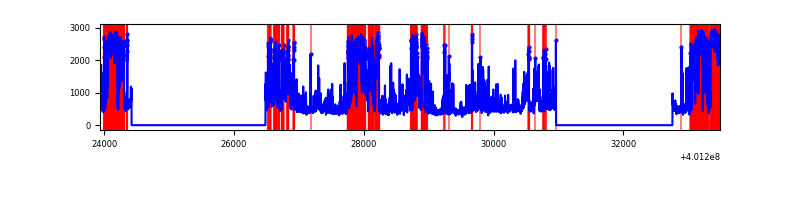 |
Top three noisy pixels from each quadrant. If the there are fewer than three noisy pixels in the level2.evt file, extra rows are filled as -1
| Pixel properties | Quadrant properties | ||||||
|---|---|---|---|---|---|---|---|
| Quadrant | DetID | PixID | Counts | Sigma | Mean | Median | Sigma |
| A | 15 | 222 | 4972885 | 40051.33 | 614 | 602 | 124.1 |
| A | 10 | 83 | 298349 | 2398.33 | 614 | 602 | 124.1 |
| A | 9 | 143 | 148633 | 1192.38 | 614 | 602 | 124.1 |
| B | 5 | 255 | 289900 | 2390.49 | 637 | 620 | 121.0 |
| B | 5 | 172 | 155239 | 1277.71 | 637 | 620 | 121.0 |
| B | 4 | 232 | 38932 | 316.59 | 637 | 620 | 121.0 |
| C | 15 | 214 | 258360 | 1764.18 | 633 | 638 | 146.1 |
| C | 0 | 10 | 132832 | 904.91 | 633 | 638 | 146.1 |
| C | 14 | 254 | 28370 | 189.83 | 633 | 638 | 146.1 |
| D | 12 | 227 | 2714514 | 18712.26 | 597 | 581 | 145.0 |
| D | 2 | 250 | 450797 | 3104.19 | 597 | 581 | 145.0 |
| D | 13 | 249 | 284147 | 1955.16 | 597 | 581 | 145.0 |
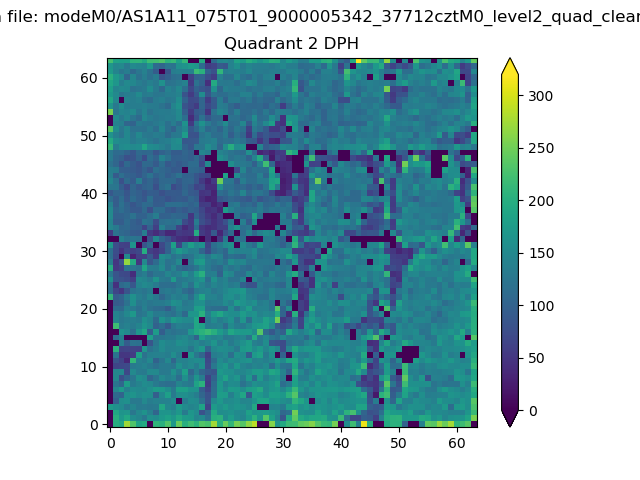
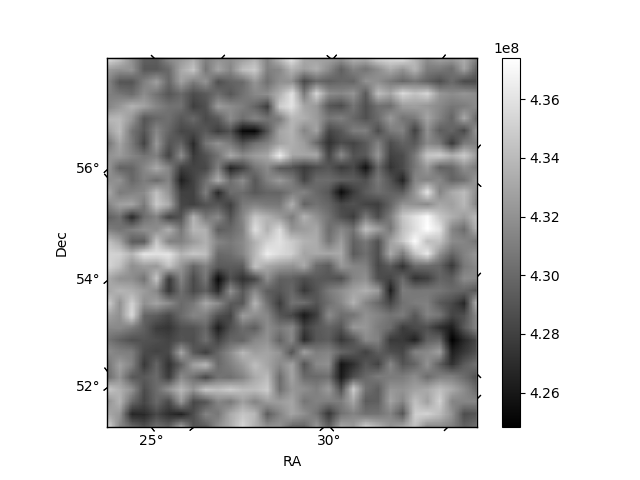
Histogram calculated using DETX and DETY for each event in the final _common_clean file
| Quadrant A | 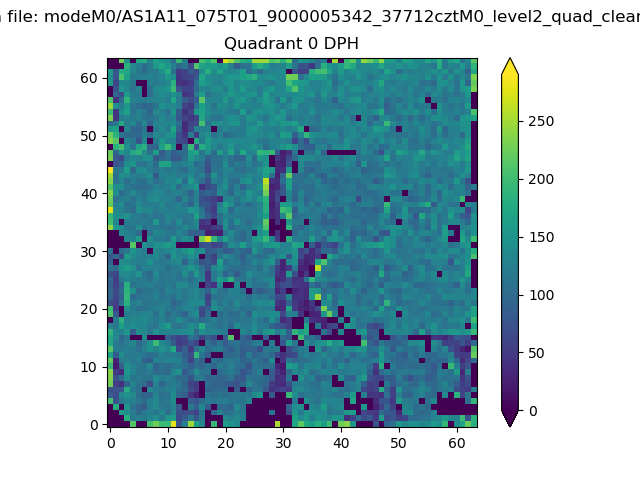 |
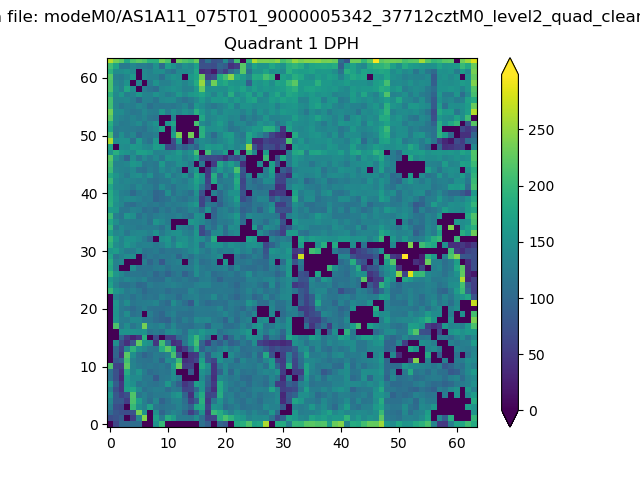 |
Quadrant B |
|---|---|---|---|
| Quadrant D | 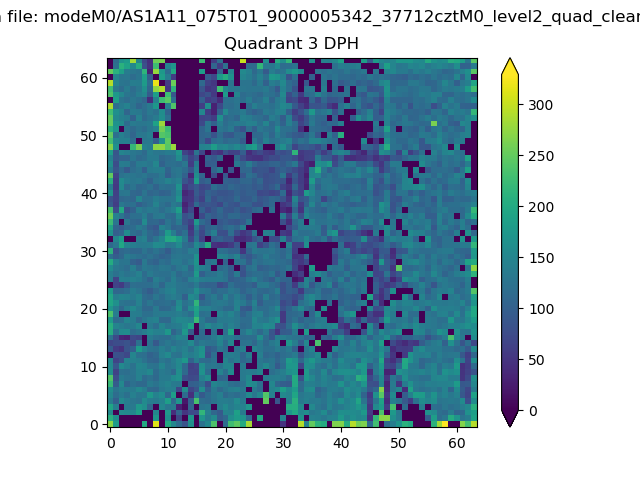 |
 |
Quadrant C |
| Plot type | Count rate plots | Images |
|---|---|---|
| Comparison with Poisson distribution Blue bars denote a histogram of data divided into 1 sec bins. Red curve is a Poisson curve with rate = median count rate of data. |
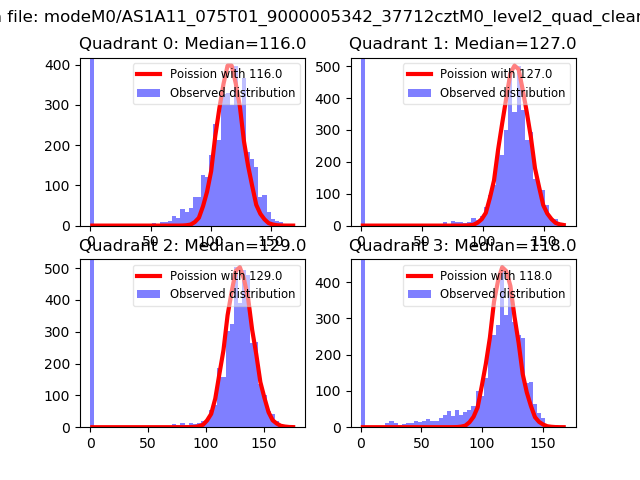 |
 |
| Quadrant-wise count rates Data is divided into 100 sec bins |
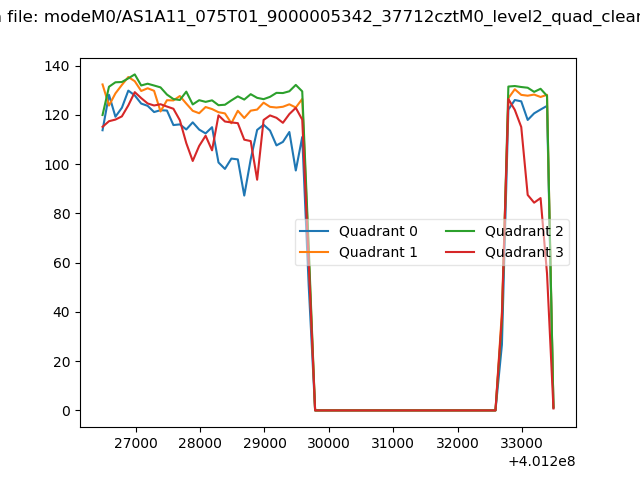 |
|
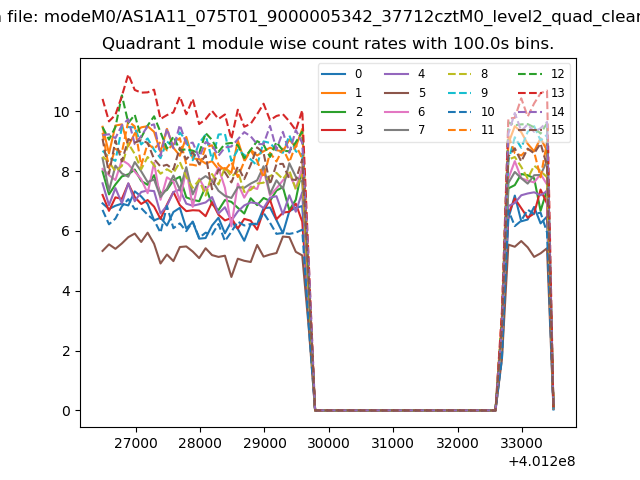
| Module-wise count rates for Quadrant A Data is divided into 100 sec bins |
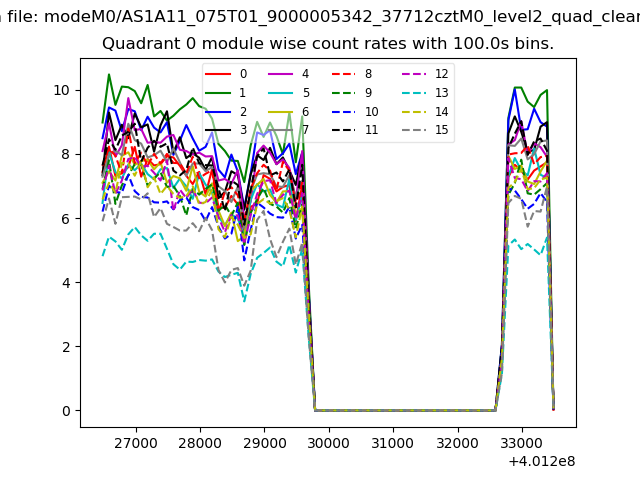 |
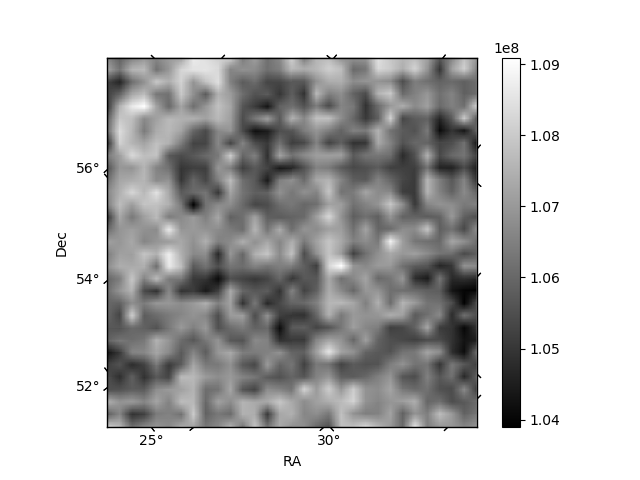 |
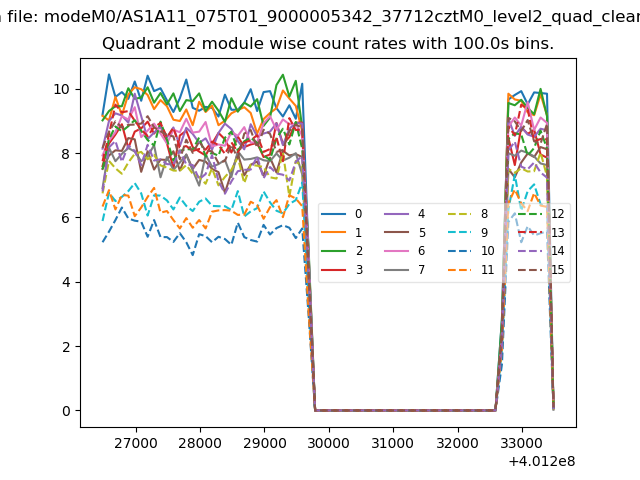
| Module-wise count rates for Quadrant B Data is divided into 100 sec bins |
 |
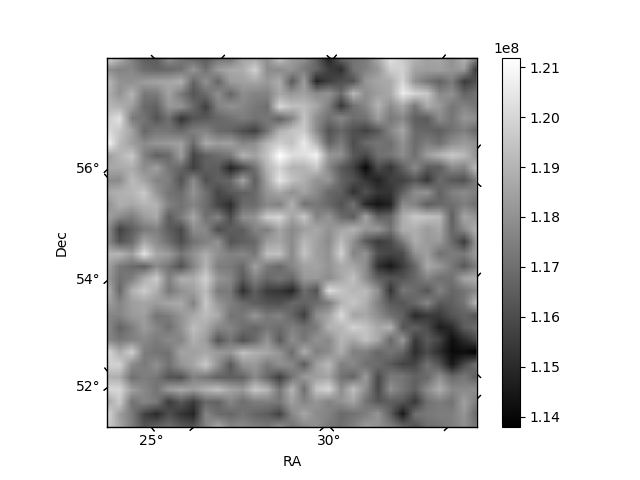 |
| Module-wise count rates for Quadrant C Data is divided into 100 sec bins |
 |
 |
| Module-wise count rates for Quadrant D Data is divided into 100 sec bins |
 |
 |
| Parameter | Plot |
|---|---|
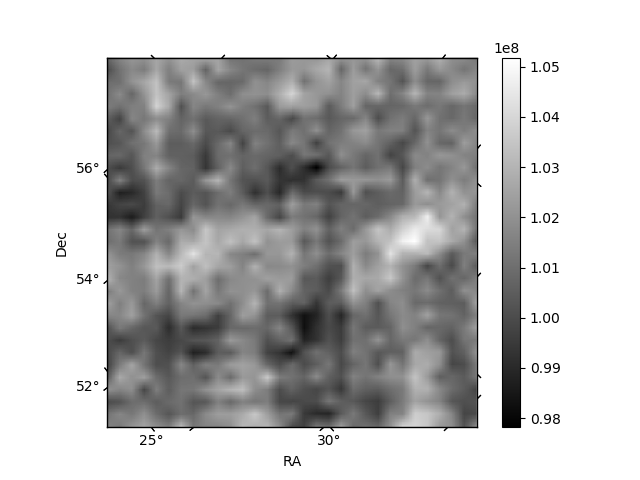
| CZT HV Monitor | 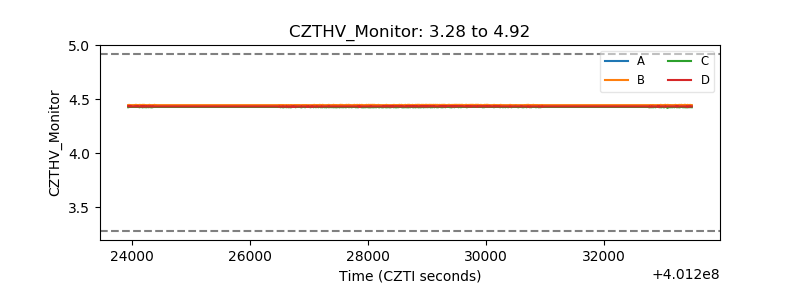 |
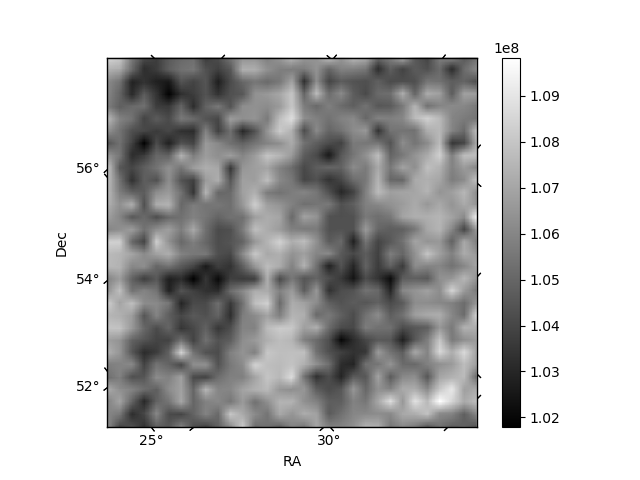
| D_VDD | 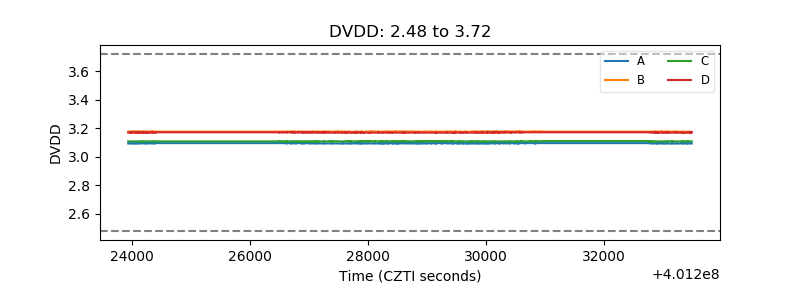 |
| Temperature 1 | 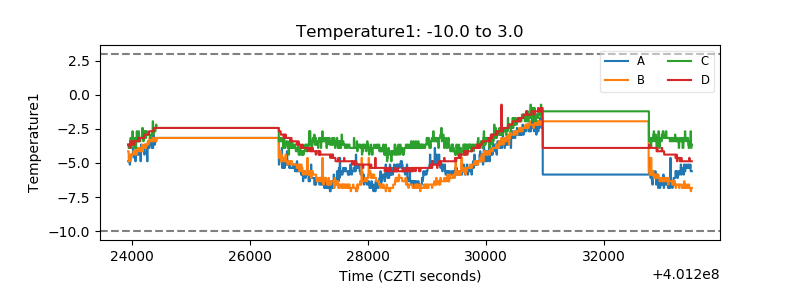 |
| Veto HV Monitor | 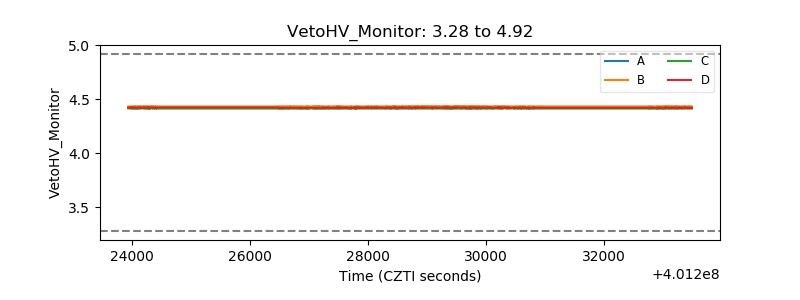 |
| Veto LLD | 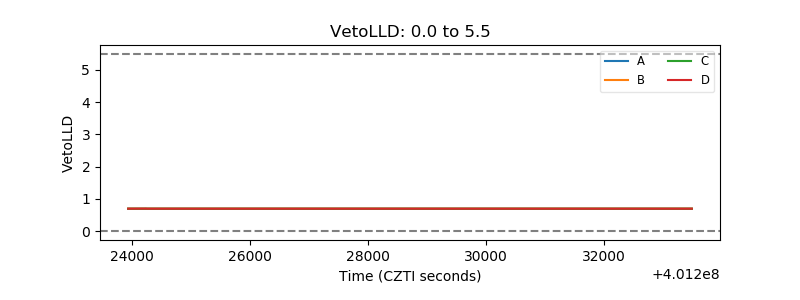 |
| Alpha Counter | 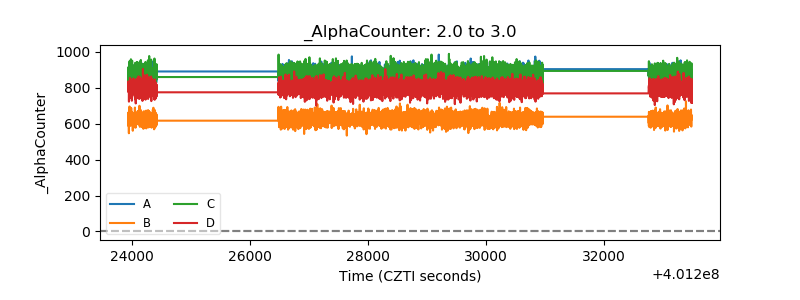 |
| _CPM_Rate | 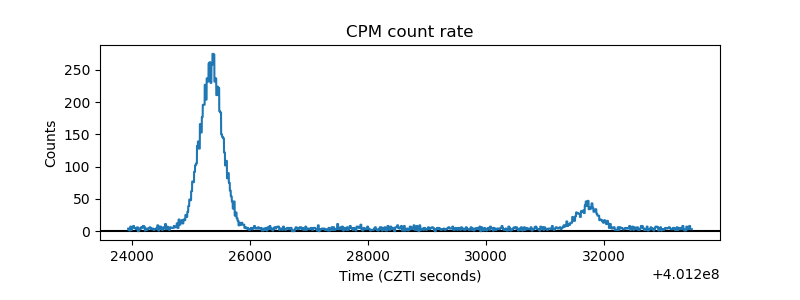 |
| CZT Counter | 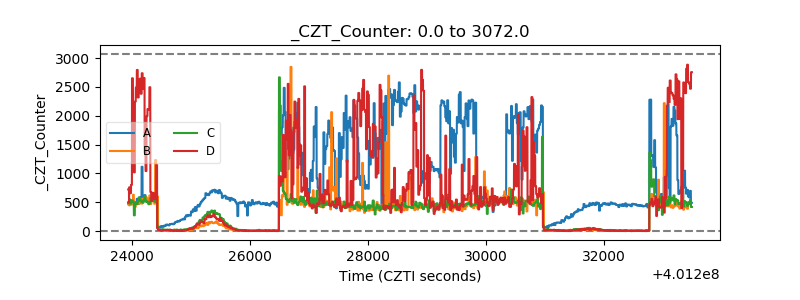 |
| +2.5 Volts monitor | 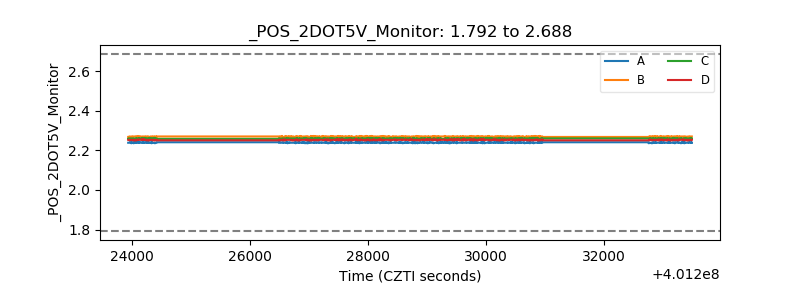 |
| +5 Volts monitor | 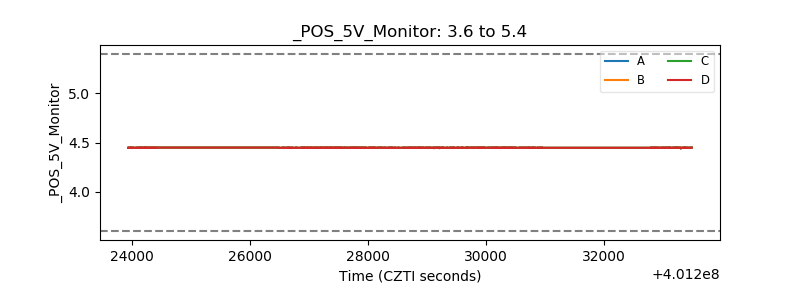 |
| _ROLL_ROT | 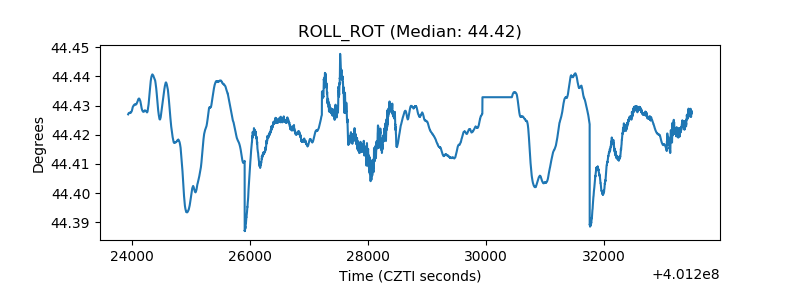 |
| _Roll_DEC | 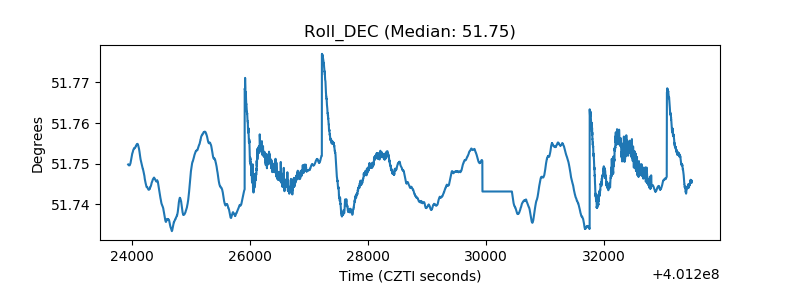 |
| _Roll_RA | 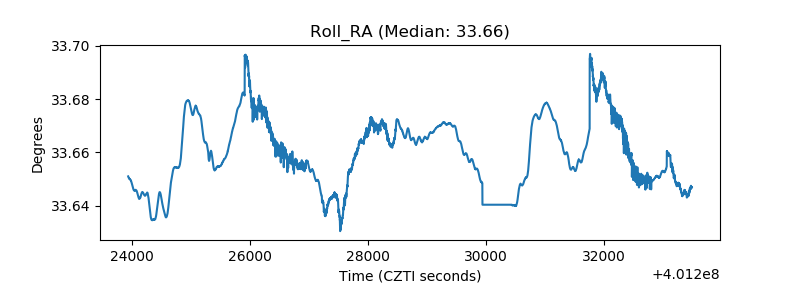 |
| Veto Counter | 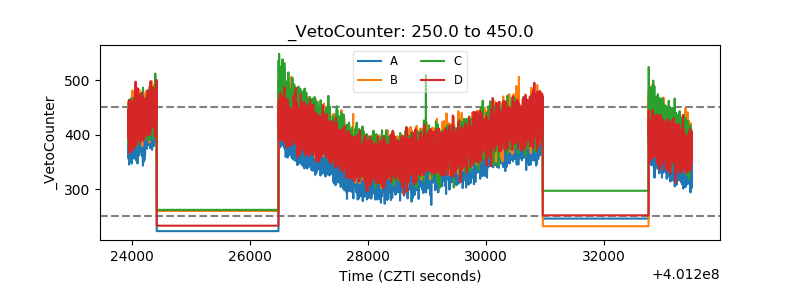 |