| Param | Original file | Final file |
|---|---|---|
| Filename | modeM0/AS1A11_075T01_9000005342_37713cztM0_level2.evt | modeM0/AS1A11_075T01_9000005342_37713cztM0_level2_quad_clean.evt |
| Size (bytes) | 588,300,480 | 56,851,200 |
| Size | 561.0 MB | 54.2 MB |
| Events in quadrant A | 7,104,005 | 324,178 |
| Events in quadrant B | 2,984,591 | 349,128 |
| Events in quadrant C | 3,039,567 | 352,086 |
| Events in quadrant D | 4,327,436 | 322,138 |
| Mode SS | |||
|---|---|---|---|
| Quadrant | BADHDUFLAG | Total packets | Discarded packets |
| A | 0 | 110 | 0 |
| B | 0 | 110 | 0 |
| C | 0 | 110 | 0 |
| D | 0 | 110 | 0 |
| Mode M0 | |||
|---|---|---|---|
| Quadrant | BADHDUFLAG | Total packets | Discarded packets |
| A | 0 | 24938 | 1 |
| B | 0 | 12422 | 1 |
| C | 0 | 12293 | 1 |
| D | 0 | 16772 | 1 |
| Mode M9 | |||
|---|---|---|---|
| Quadrant | BADHDUFLAG | Total packets | Discarded packets |
| A | 0 | 32 | 0 |
| B | 0 | 32 | 0 |
| C | 0 | 32 | 0 |
| D | 0 | 32 | 0 |
| Quadrant | Total seconds | Saturated seconds | Saturation percentage |
|---|---|---|---|
| A | 5330 | 1594 | 29.906191% |
| B | 5330 | 183 | 3.433396% |
| C | 5330 | 141 | 2.645403% |
| D | 5330 | 544 | 10.206379% |
Noise dominated data is calculated using 1-second bins in cleaned event files. If a bin has >2000 counts, and if more than 50% of those come from <1% of pixels, then it is considered to be noise-dominated and hence unusable.
| Quadrant | # 1 sec bins | Bins with >0 counts | Bins with >2000 counts | High rate bins dominated by noise | Noise dominated (total time) | Noise dominated (detector-on time) | Marked lightcurve |
|---|---|---|---|---|---|---|---|
| A | 7123 | 5330 | 1433 | 1433 | 20.12% | 26.89% |  |
| B | 7123 | 5330 | 145 | 145 | 2.04% | 2.72% | 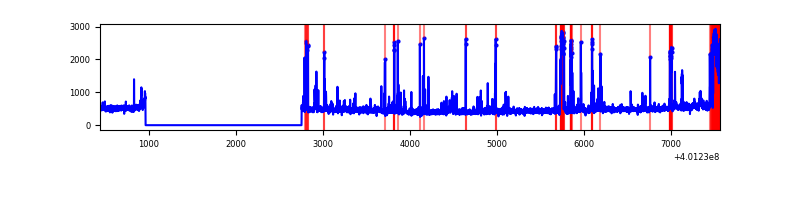 |
| C | 7122 | 5329 | 142 | 142 | 1.99% | 2.66% | 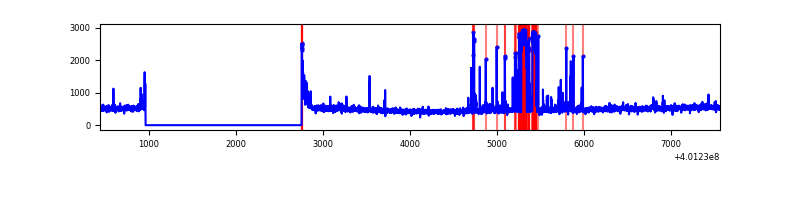 |
| D | 7122 | 5329 | 543 | 543 | 7.62% | 10.19% | 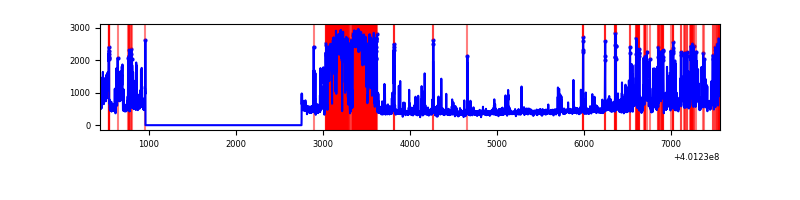 |
Top three noisy pixels from each quadrant. If the there are fewer than three noisy pixels in the level2.evt file, extra rows are filled as -1
| Pixel properties | Quadrant properties | ||||||
|---|---|---|---|---|---|---|---|
| Quadrant | DetID | PixID | Counts | Sigma | Mean | Median | Sigma |
| A | 15 | 222 | 4547018 | 39639.33 | 568 | 557 | 114.7 |
| A | 10 | 83 | 231391 | 2012.58 | 568 | 557 | 114.7 |
| A | 9 | 143 | 76717 | 664.02 | 568 | 557 | 114.7 |
| B | 5 | 255 | 269308 | 2377.42 | 590 | 574 | 113.0 |
| B | 5 | 172 | 256512 | 2264.21 | 590 | 574 | 113.0 |
| B | 5 | 200 | 52941 | 463.27 | 590 | 574 | 113.0 |
| C | 14 | 254 | 484914 | 3622.46 | 580 | 585 | 133.7 |
| C | 15 | 214 | 233729 | 1743.76 | 580 | 585 | 133.7 |
| C | 0 | 10 | 55600 | 411.48 | 580 | 585 | 133.7 |
| D | 12 | 227 | 1512919 | 11036.51 | 567 | 550 | 137.0 |
| D | 2 | 250 | 294066 | 2141.93 | 567 | 550 | 137.0 |
| D | 13 | 249 | 153764 | 1118.08 | 567 | 550 | 137.0 |
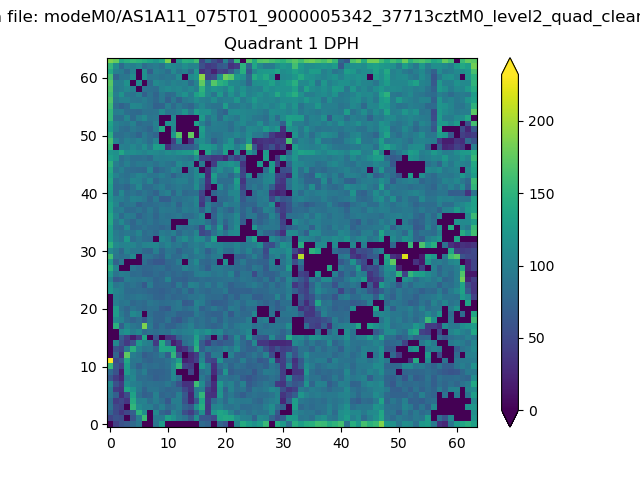
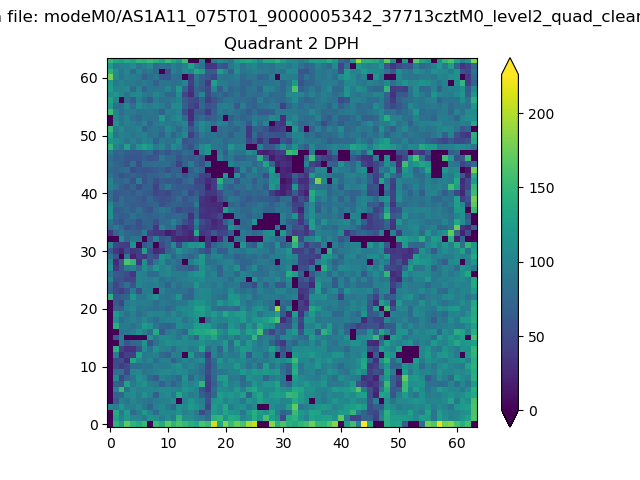
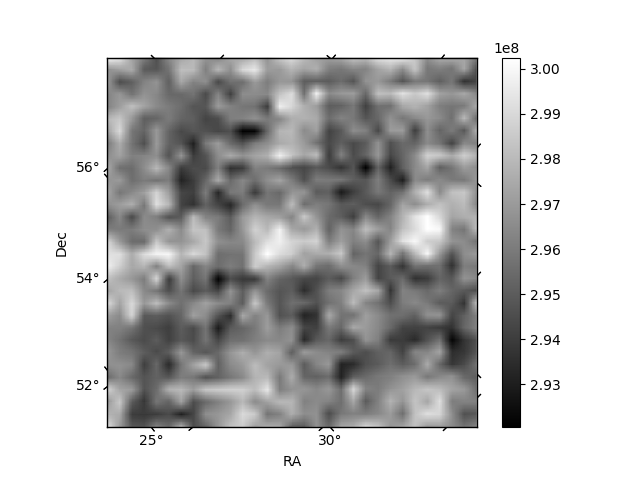
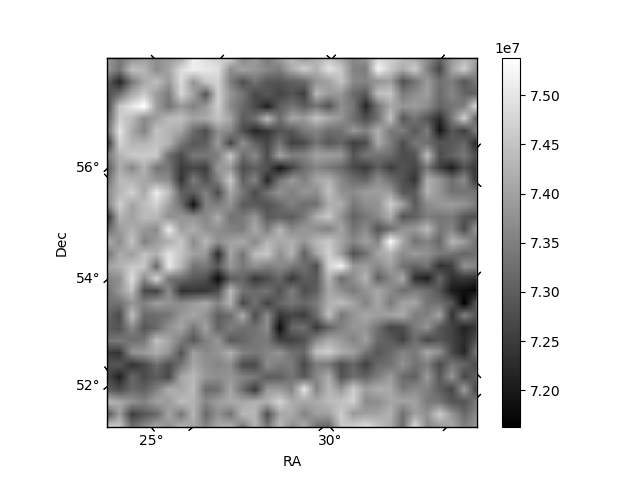
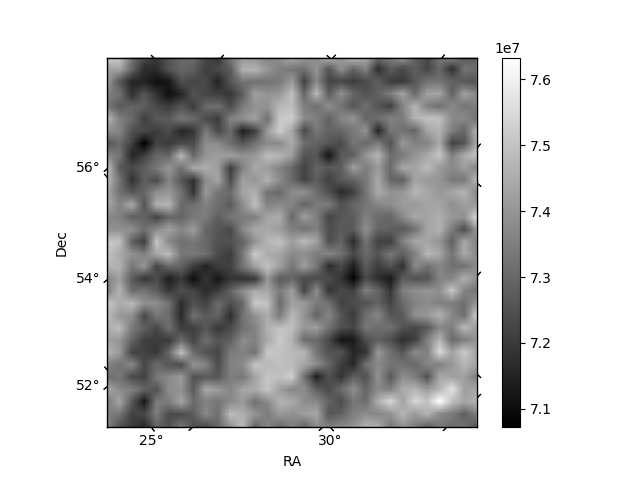
Histogram calculated using DETX and DETY for each event in the final _common_clean file
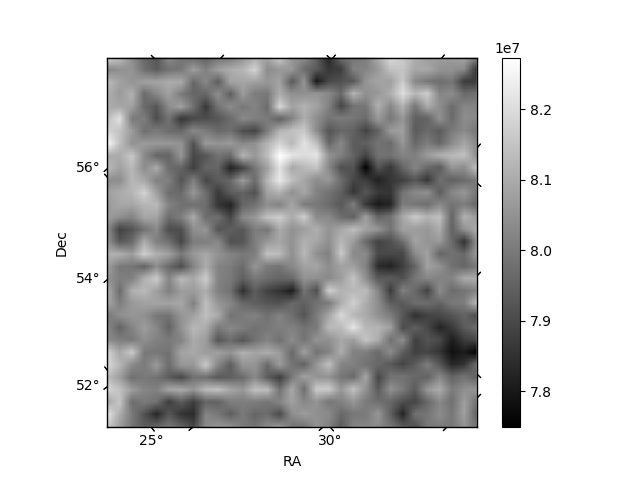
| Quadrant A | 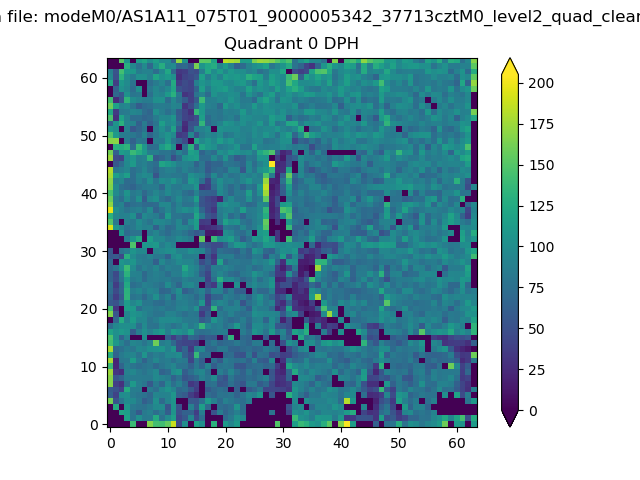 |
 |
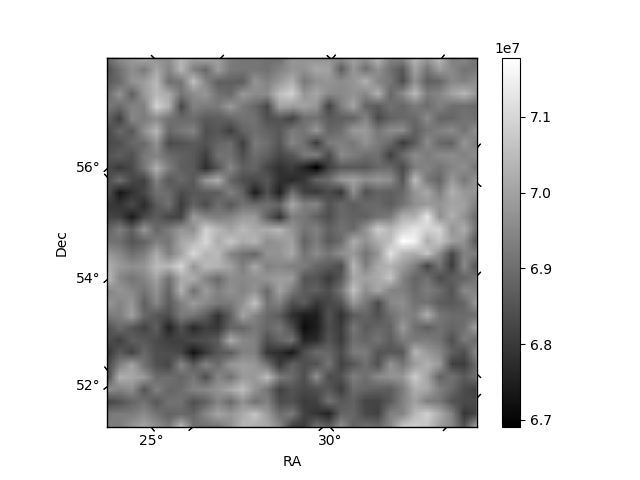
Quadrant B |
|---|---|---|---|
| Quadrant D | 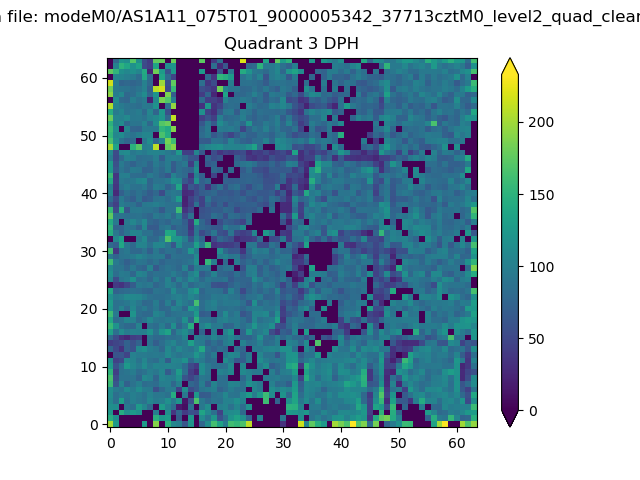 |
 |
Quadrant C |
| Plot type | Count rate plots | Images |
|---|---|---|
| Comparison with Poisson distribution Blue bars denote a histogram of data divided into 1 sec bins. Red curve is a Poisson curve with rate = median count rate of data. |
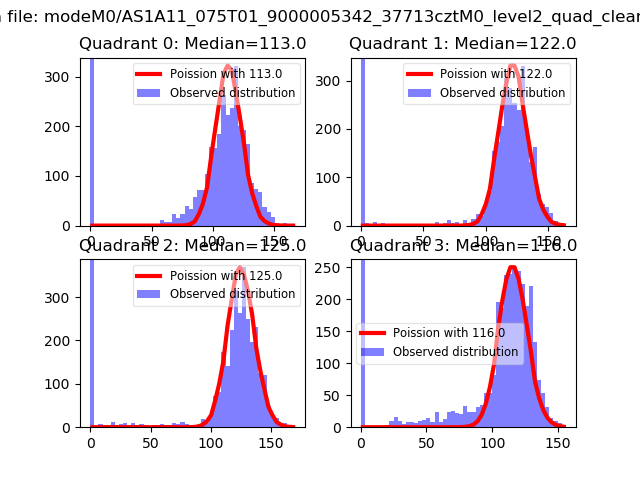 |
 |
| Quadrant-wise count rates Data is divided into 100 sec bins |
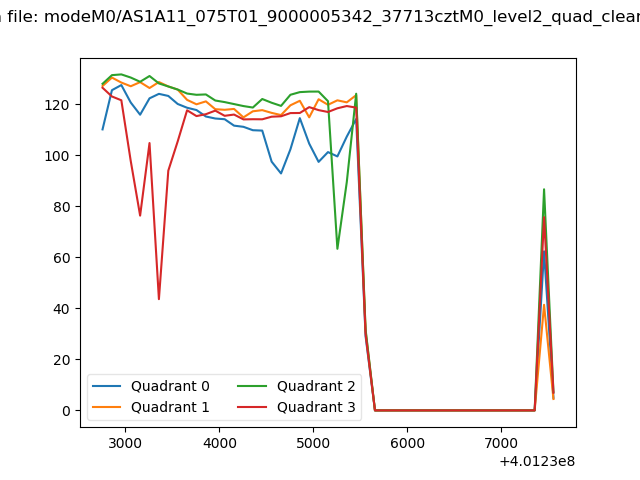 |
|
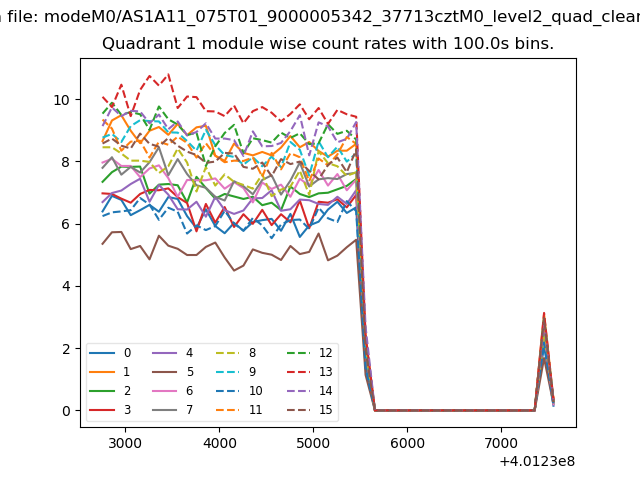
| Module-wise count rates for Quadrant A Data is divided into 100 sec bins |
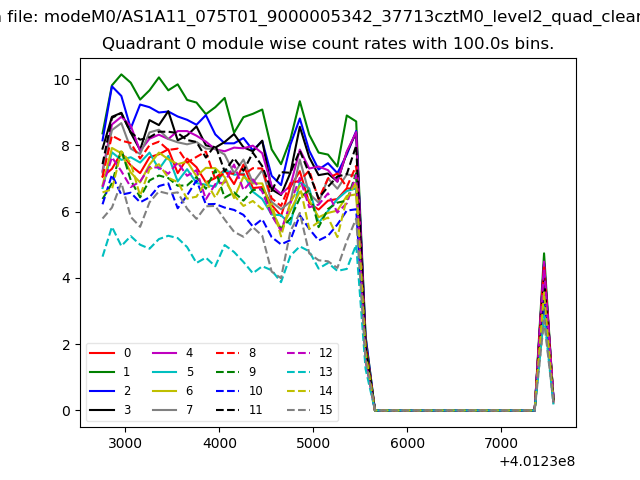 |
 |
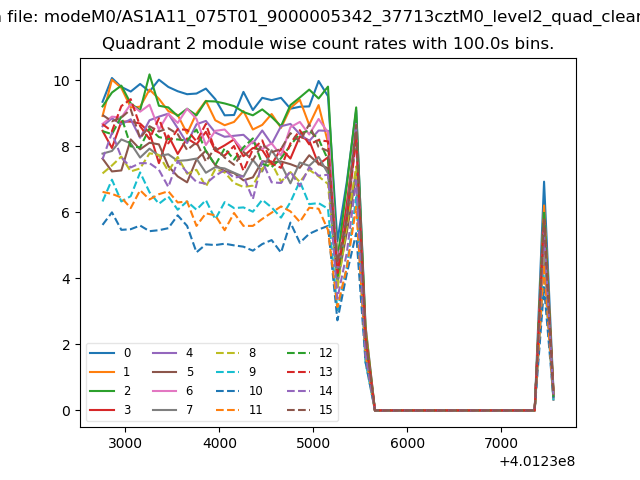
| Module-wise count rates for Quadrant B Data is divided into 100 sec bins |
 |
 |
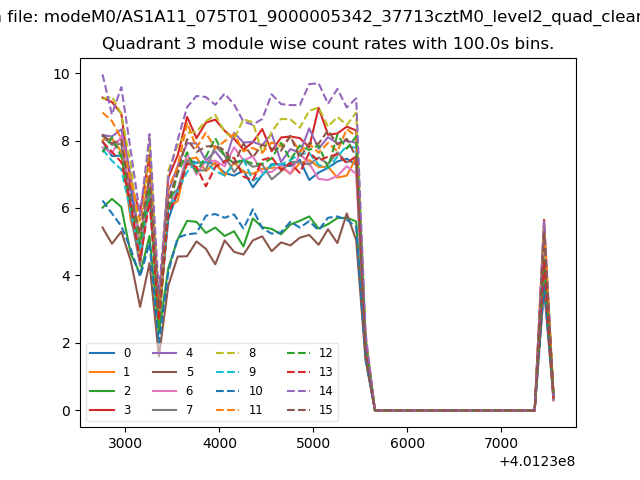
| Module-wise count rates for Quadrant C Data is divided into 100 sec bins |
 |
 |
| Module-wise count rates for Quadrant D Data is divided into 100 sec bins |
 |
 |
| Parameter | Plot |
|---|---|
| CZT HV Monitor |  |
| D_VDD | 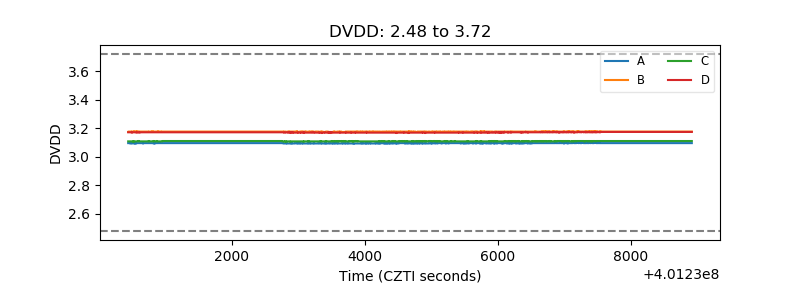 |
| Temperature 1 | 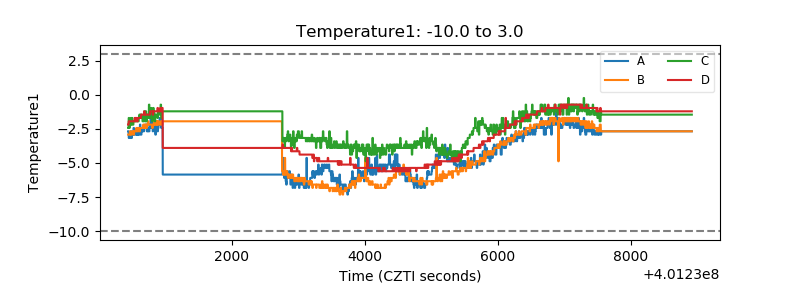 |
| Veto HV Monitor | 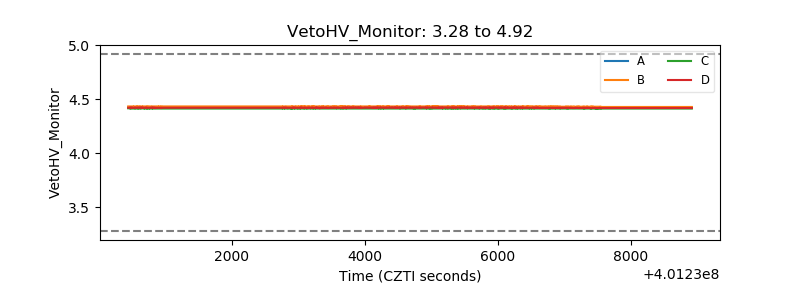 |
| Veto LLD | 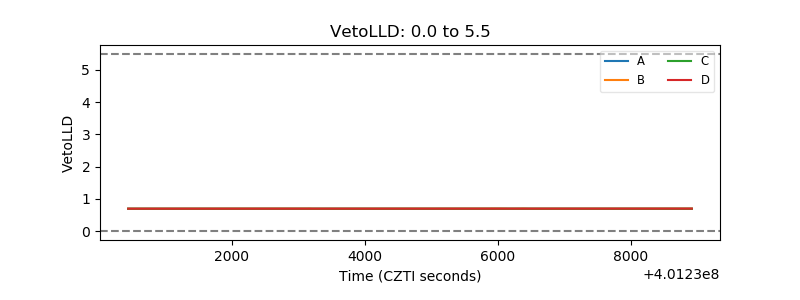 |
| Alpha Counter | 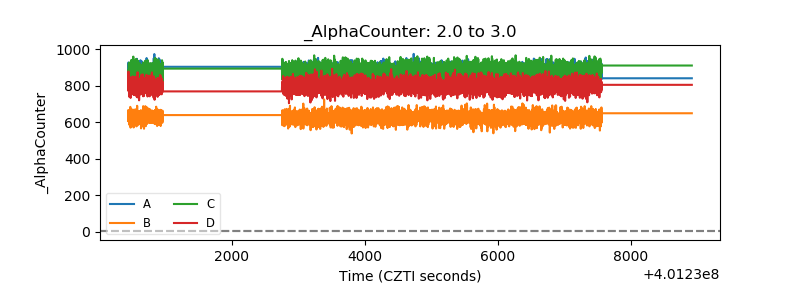 |
| _CPM_Rate | 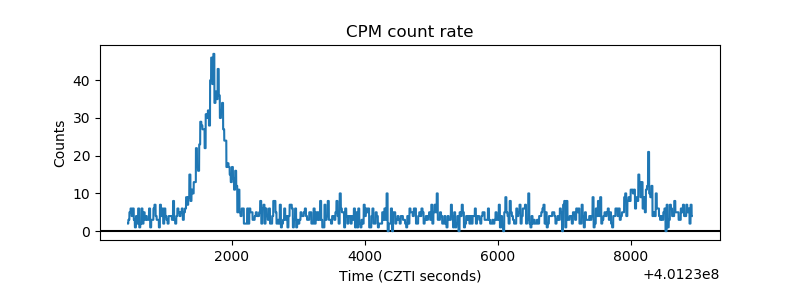 |
| CZT Counter | 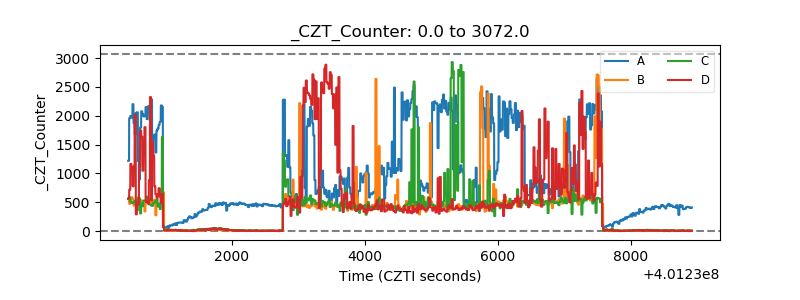 |
| +2.5 Volts monitor | 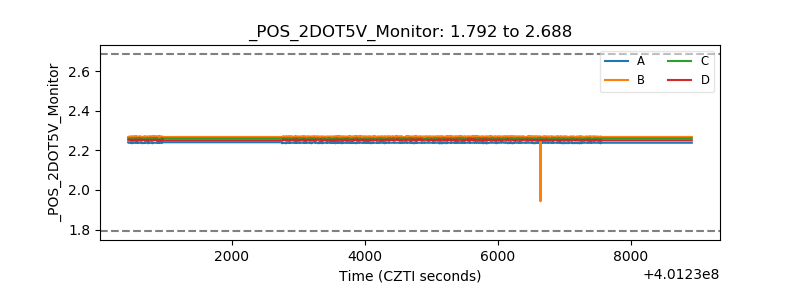 |
| +5 Volts monitor | 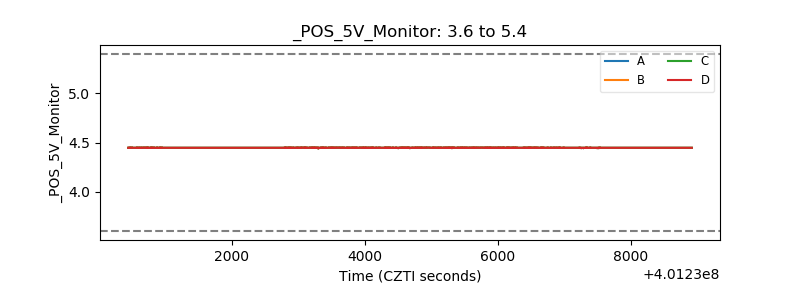 |
| _ROLL_ROT | 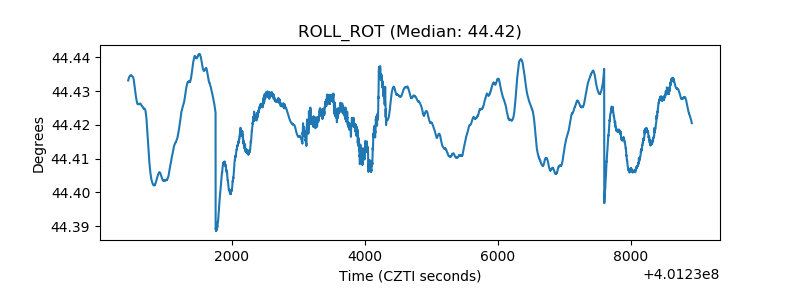 |
| _Roll_DEC | 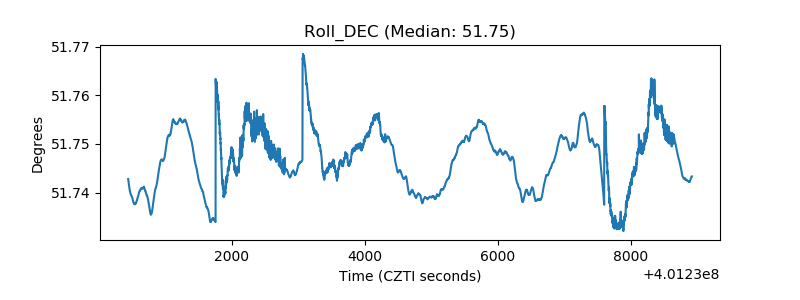 |
| _Roll_RA | 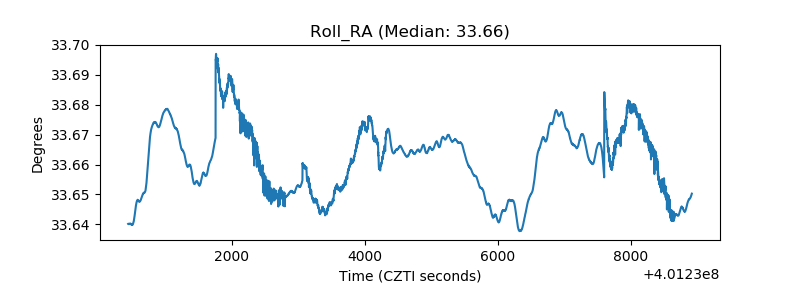 |
| Veto Counter | 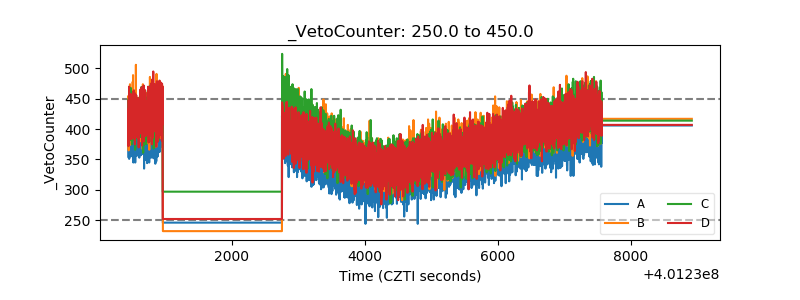 |