| Param | Original file | Final file |
|---|---|---|
| Filename | modeM0/AS1A11_106T02_9000005344_37715cztM0_level2.evt | modeM0/AS1A11_106T02_9000005344_37715cztM0_level2_quad_clean.evt |
| Size (bytes) | 448,156,800 | 83,923,200 |
| Size | 427.4 MB | 80.0 MB |
| Events in quadrant A | 3,677,218 | 521,957 |
| Events in quadrant B | 3,105,249 | 534,476 |
| Events in quadrant C | 3,124,021 | 540,861 |
| Events in quadrant D | 3,251,415 | 517,964 |
| Mode M9 | |||
|---|---|---|---|
| Quadrant | BADHDUFLAG | Total packets | Discarded packets |
| A | 0 | 26 | 0 |
| B | 0 | 26 | 0 |
| C | 0 | 26 | 0 |
| D | 0 | 26 | 0 |
| Mode SS | |||
|---|---|---|---|
| Quadrant | BADHDUFLAG | Total packets | Discarded packets |
| A | 0 | 126 | 0 |
| B | 0 | 126 | 0 |
| C | 0 | 126 | 0 |
| D | 0 | 126 | 0 |
| Mode M0 | |||
|---|---|---|---|
| Quadrant | BADHDUFLAG | Total packets | Discarded packets |
| A | 0 | 14794 | 3 |
| B | 0 | 13499 | 2 |
| C | 0 | 13132 | 6 |
| D | 0 | 14119 | 2 |
| Quadrant | Total seconds | Saturated seconds | Saturation percentage |
|---|---|---|---|
| A | 6102 | 235 | 3.851196% |
| B | 6102 | 52 | 0.852180% |
| C | 6101 | 36 | 0.590067% |
| D | 6102 | 69 | 1.130777% |
Noise dominated data is calculated using 1-second bins in cleaned event files. If a bin has >2000 counts, and if more than 50% of those come from <1% of pixels, then it is considered to be noise-dominated and hence unusable.
| Quadrant | # 1 sec bins | Bins with >0 counts | Bins with >2000 counts | High rate bins dominated by noise | Noise dominated (total time) | Noise dominated (detector-on time) | Marked lightcurve |
|---|---|---|---|---|---|---|---|
| A | 8727 | 6101 | 195 | 195 | 2.23% | 3.20% | 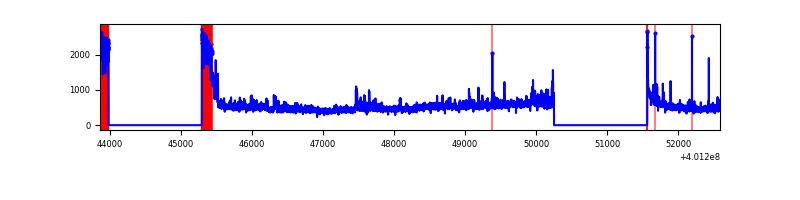 |
| B | 8727 | 6101 | 31 | 31 | 0.36% | 0.51% | 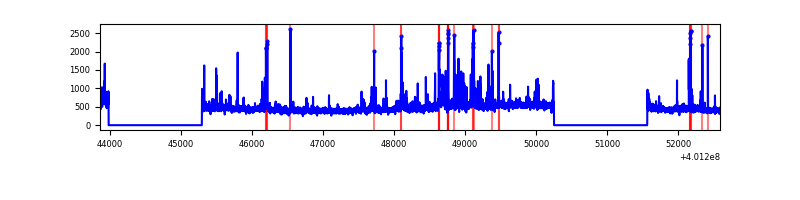 |
| C | 8727 | 6100 | 32 | 32 | 0.37% | 0.52% | 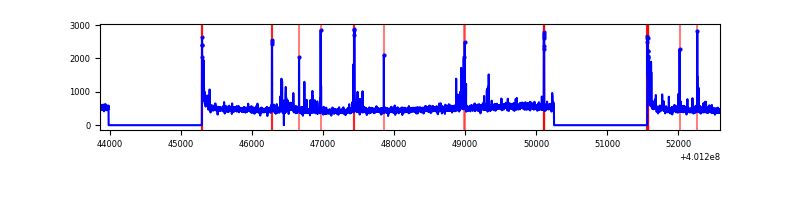 |
| D | 8727 | 6101 | 58 | 58 | 0.66% | 0.95% |  |
Top three noisy pixels from each quadrant. If the there are fewer than three noisy pixels in the level2.evt file, extra rows are filled as -1
| Pixel properties | Quadrant properties | ||||||
|---|---|---|---|---|---|---|---|
| Quadrant | DetID | PixID | Counts | Sigma | Mean | Median | Sigma |
| A | 15 | 222 | 679169 | 5075.82 | 666 | 653 | 133.7 |
| A | 10 | 83 | 344091 | 2569.18 | 666 | 653 | 133.7 |
| A | 9 | 143 | 46027 | 339.43 | 666 | 653 | 133.7 |
| B | 5 | 255 | 116064 | 906.61 | 668 | 650 | 127.3 |
| B | 5 | 172 | 107138 | 836.49 | 668 | 650 | 127.3 |
| B | 5 | 200 | 70027 | 544.98 | 668 | 650 | 127.3 |
| C | 15 | 214 | 278470 | 1823.65 | 658 | 663 | 152.3 |
| C | 14 | 254 | 141291 | 923.15 | 658 | 663 | 152.3 |
| C | 0 | 10 | 98700 | 643.56 | 658 | 663 | 152.3 |
| D | 13 | 249 | 202707 | 1268.19 | 653 | 634 | 159.3 |
| D | 2 | 250 | 191787 | 1199.66 | 653 | 634 | 159.3 |
| D | 7 | 223 | 124350 | 776.43 | 653 | 634 | 159.3 |
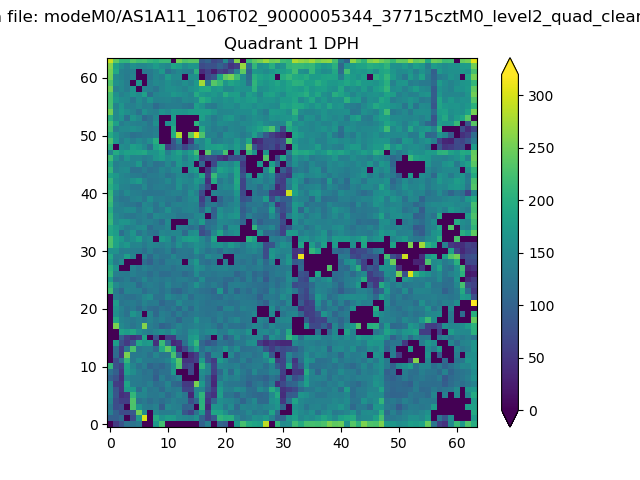
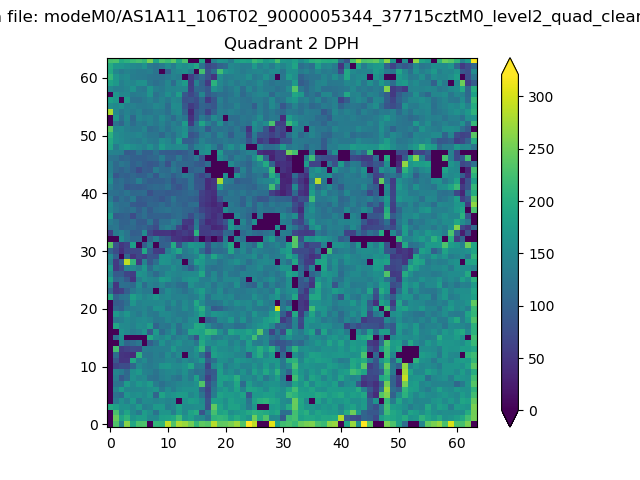
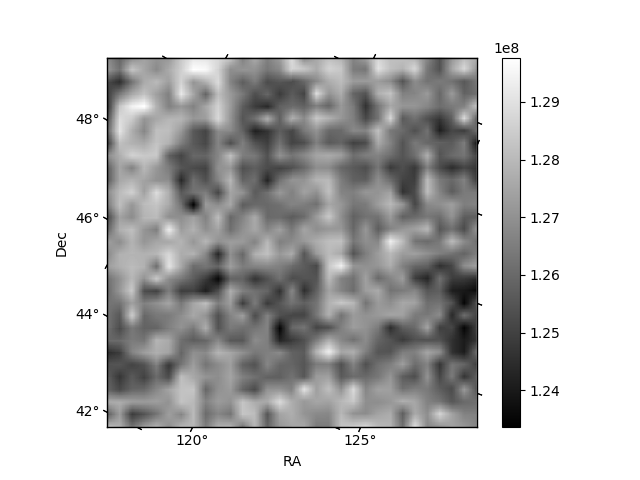
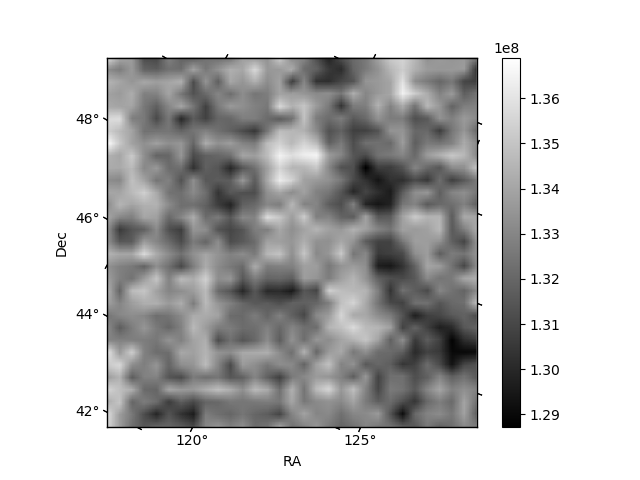
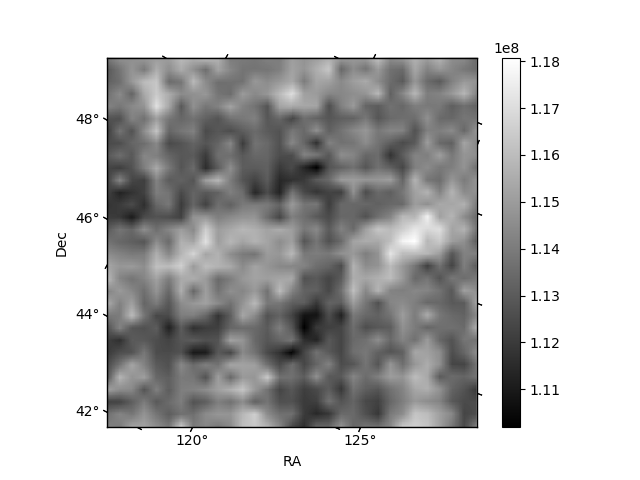
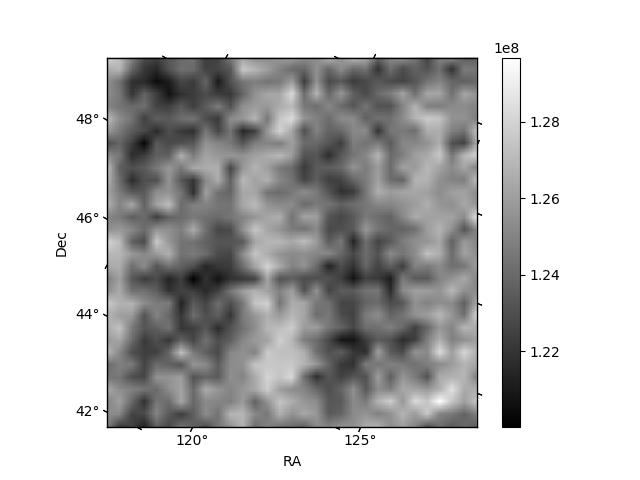
Histogram calculated using DETX and DETY for each event in the final _common_clean file
| Quadrant A | 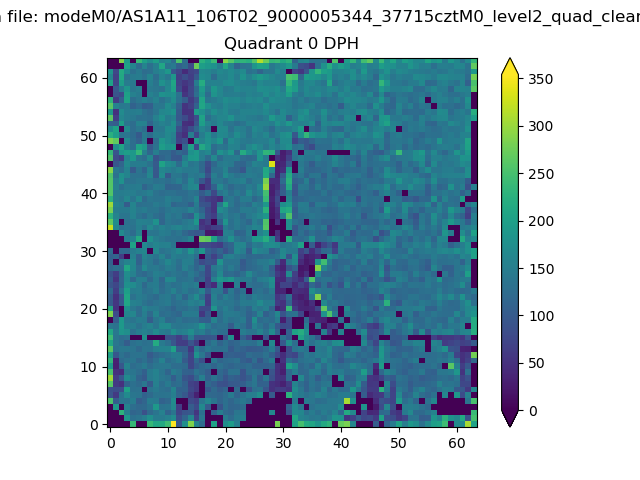 |
 |
Quadrant B |
|---|---|---|---|
| Quadrant D | 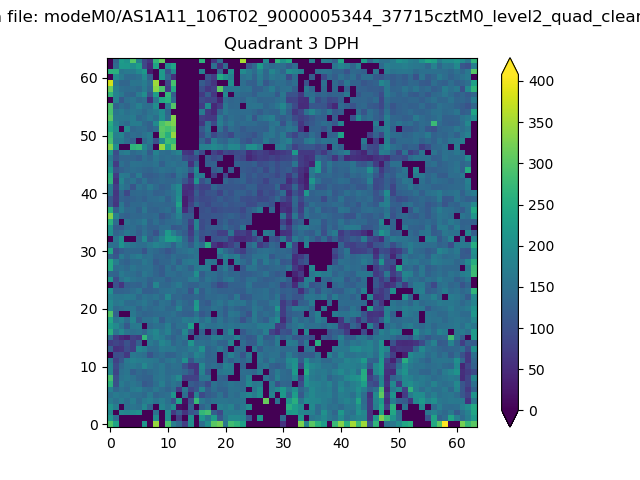 |
 |
Quadrant C |
| Plot type | Count rate plots | Images |
|---|---|---|
| Comparison with Poisson distribution Blue bars denote a histogram of data divided into 1 sec bins. Red curve is a Poisson curve with rate = median count rate of data. |
 |
 |
| Quadrant-wise count rates Data is divided into 100 sec bins |
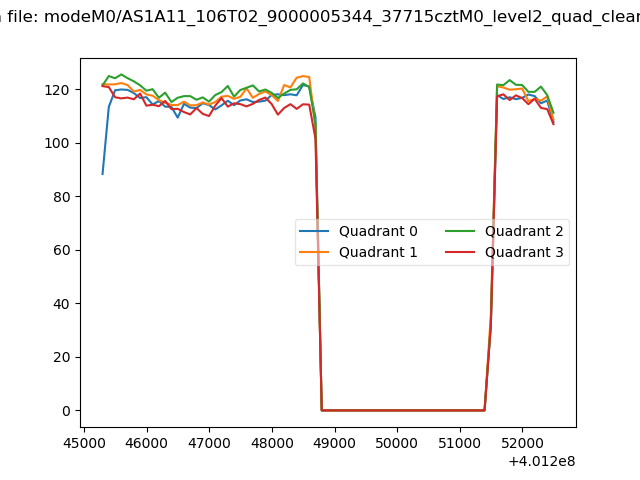 |
|
| Module-wise count rates for Quadrant A Data is divided into 100 sec bins |
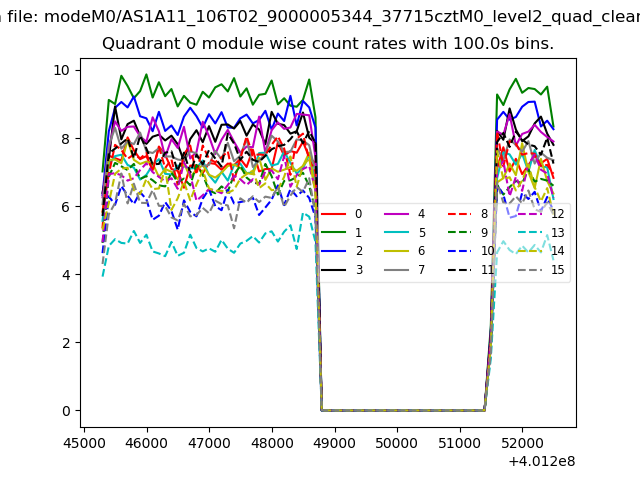 |
 |
| Module-wise count rates for Quadrant B Data is divided into 100 sec bins |
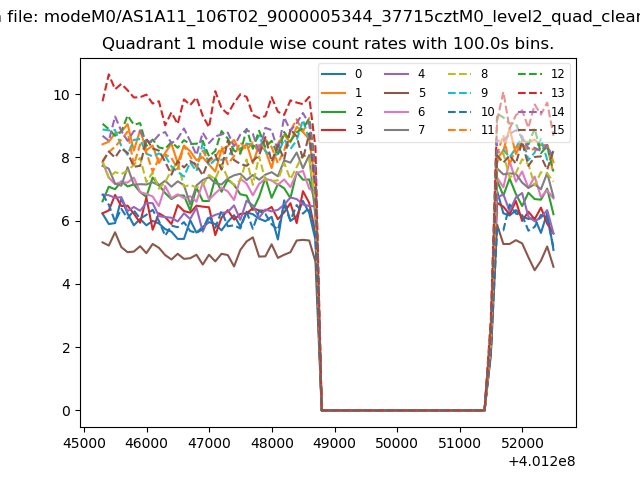 |
 |
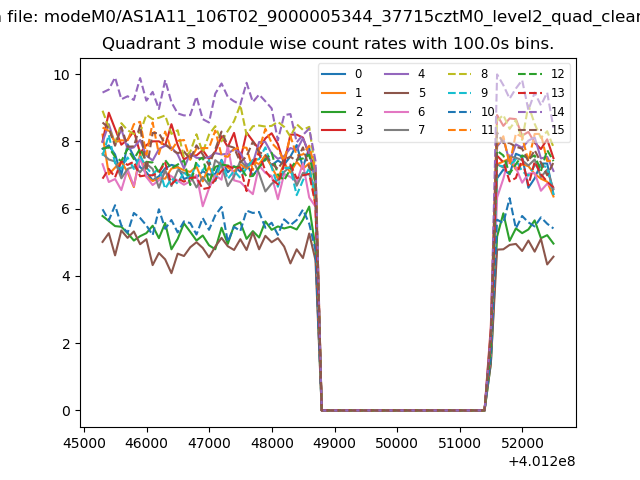
| Module-wise count rates for Quadrant C Data is divided into 100 sec bins |
 |
 |
| Module-wise count rates for Quadrant D Data is divided into 100 sec bins |
 |
 |
| Parameter | Plot |
|---|---|
| CZT HV Monitor | 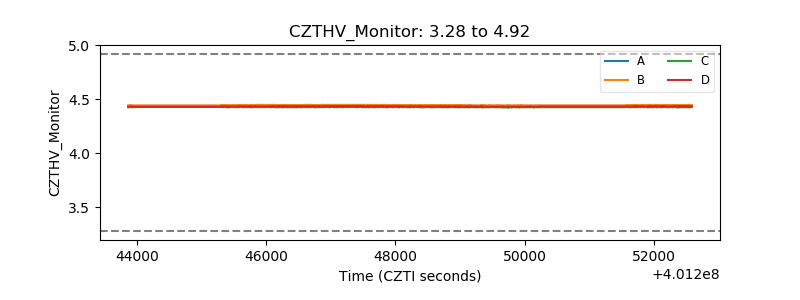 |
| D_VDD | 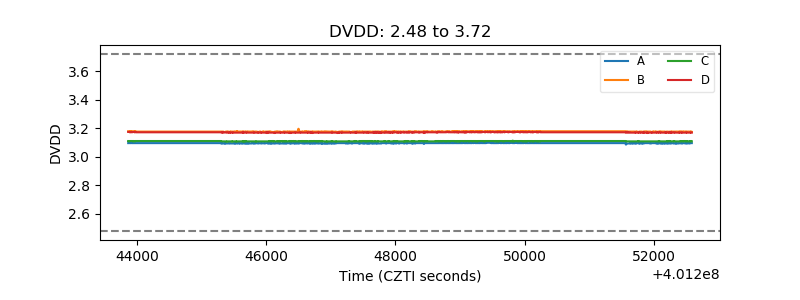 |
| Temperature 1 | 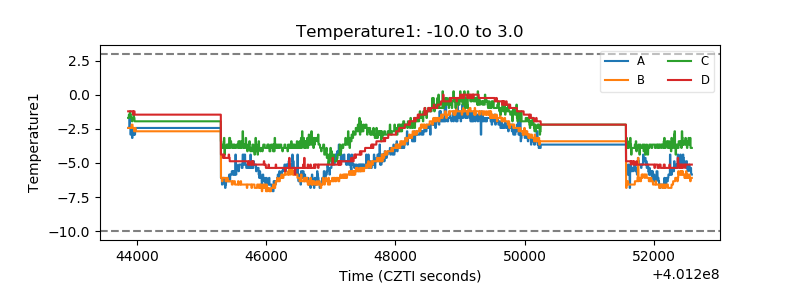 |
| Veto HV Monitor | 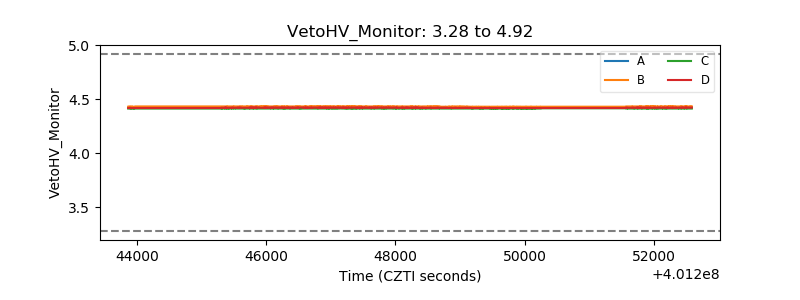 |
| Veto LLD | 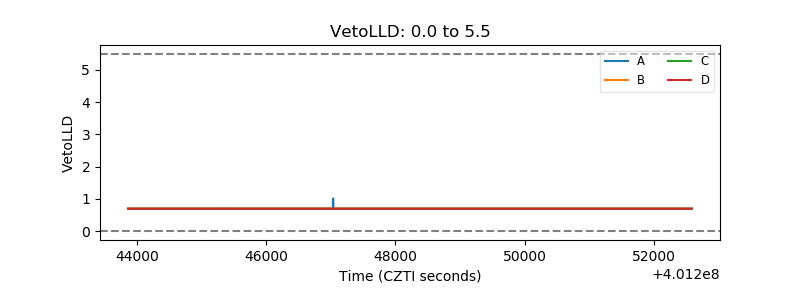 |
| Alpha Counter |  |
| _CPM_Rate | 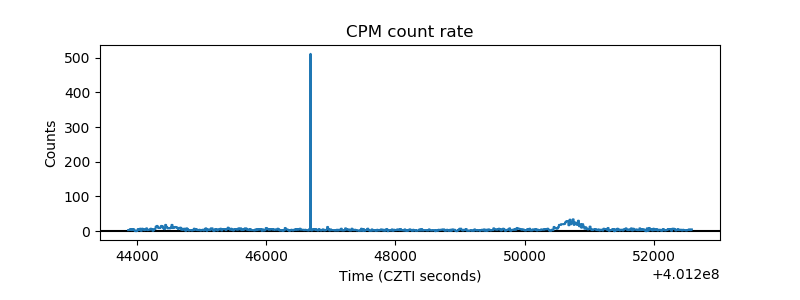 |
| CZT Counter | 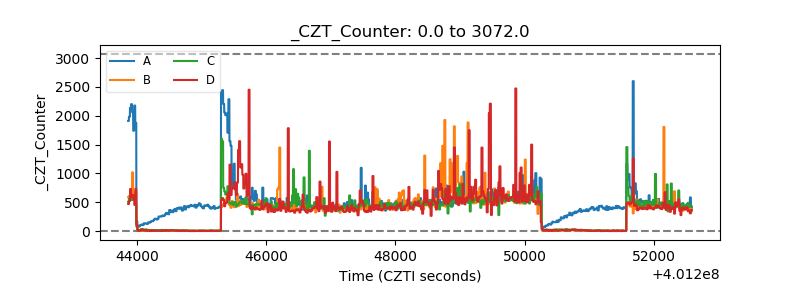 |
| +2.5 Volts monitor | 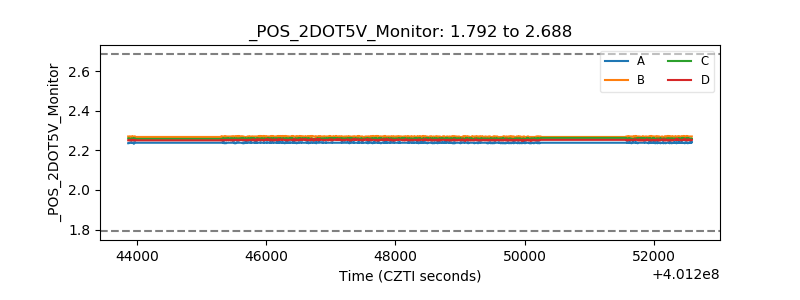 |
| +5 Volts monitor |  |
| _ROLL_ROT | 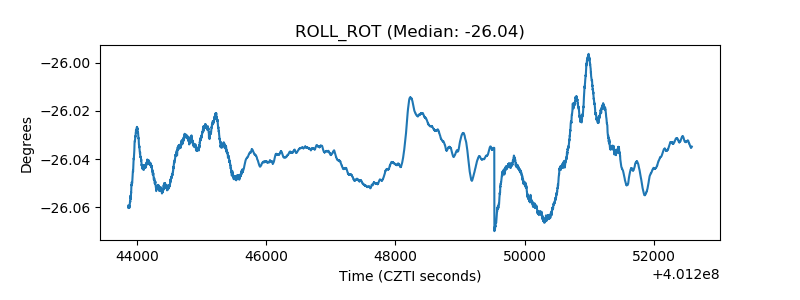 |
| _Roll_DEC | 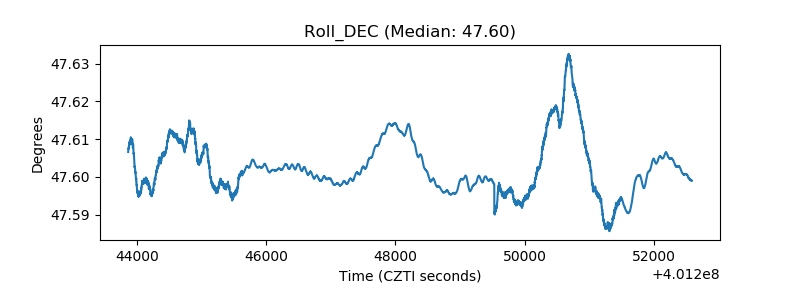 |
| _Roll_RA |  |
| Veto Counter | 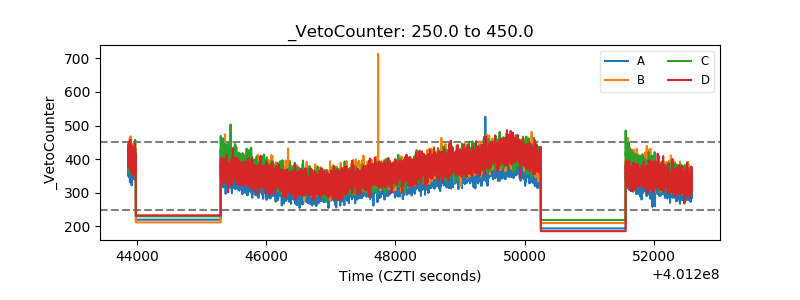 |