| Param | Original file | Final file |
|---|---|---|
| Filename | modeM0/AS1A11_106T02_9000005344_37721cztM0_level2.evt | modeM0/AS1A11_106T02_9000005344_37721cztM0_level2_quad_clean.evt |
| Size (bytes) | 603,253,440 | 72,207,360 |
| Size | 575.3 MB | 68.9 MB |
| Events in quadrant A | 7,989,352 | 432,613 |
| Events in quadrant B | 2,929,160 | 476,377 |
| Events in quadrant C | 2,911,833 | 471,408 |
| Events in quadrant D | 4,082,275 | 435,868 |
| Mode M9 | |||
|---|---|---|---|
| Quadrant | BADHDUFLAG | Total packets | Discarded packets |
| A | 0 | 18 | 0 |
| B | 0 | 18 | 0 |
| C | 0 | 18 | 0 |
| D | 0 | 18 | 0 |
| Mode SS | |||
|---|---|---|---|
| Quadrant | BADHDUFLAG | Total packets | Discarded packets |
| A | 0 | 110 | 0 |
| B | 0 | 110 | 0 |
| C | 0 | 110 | 0 |
| D | 0 | 110 | 0 |
| Mode M0 | |||
|---|---|---|---|
| Quadrant | BADHDUFLAG | Total packets | Discarded packets |
| A | 0 | 27185 | 3 |
| B | 0 | 11910 | 2 |
| C | 0 | 11658 | 2 |
| D | 0 | 15568 | 2 |
| Quadrant | Total seconds | Saturated seconds | Saturation percentage |
|---|---|---|---|
| A | 5266 | 1812 | 34.409419% |
| B | 5266 | 60 | 1.139385% |
| C | 5266 | 51 | 0.968477% |
| D | 5267 | 304 | 5.771787% |
Noise dominated data is calculated using 1-second bins in cleaned event files. If a bin has >2000 counts, and if more than 50% of those come from <1% of pixels, then it is considered to be noise-dominated and hence unusable.
| Quadrant | # 1 sec bins | Bins with >0 counts | Bins with >2000 counts | High rate bins dominated by noise | Noise dominated (total time) | Noise dominated (detector-on time) | Marked lightcurve |
|---|---|---|---|---|---|---|---|
| A | 7119 | 5267 | 1813 | 1813 | 25.47% | 34.42% | 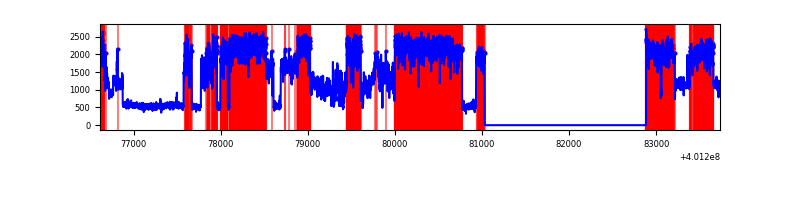 |
| B | 7119 | 5266 | 43 | 43 | 0.60% | 0.82% | 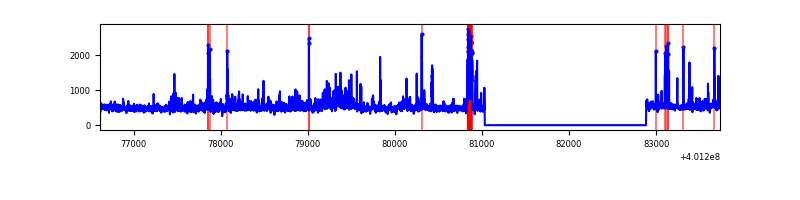 |
| C | 7119 | 5266 | 48 | 48 | 0.67% | 0.91% | 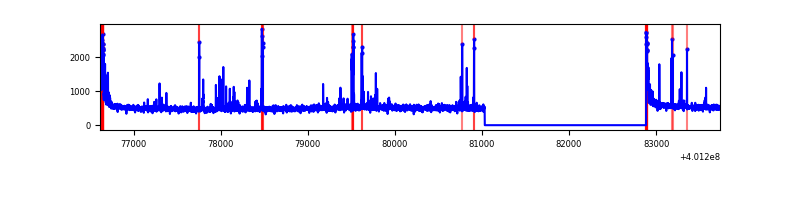 |
| D | 7119 | 5266 | 390 | 390 | 5.48% | 7.41% | 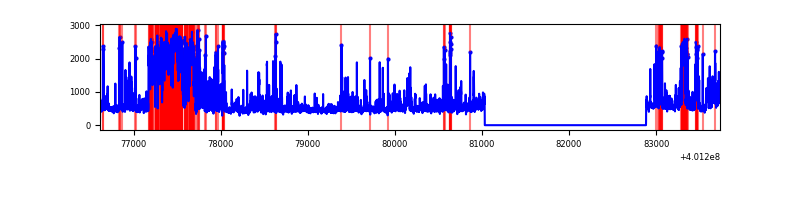 |
Top three noisy pixels from each quadrant. If the there are fewer than three noisy pixels in the level2.evt file, extra rows are filled as -1
| Pixel properties | Quadrant properties | ||||||
|---|---|---|---|---|---|---|---|
| Quadrant | DetID | PixID | Counts | Sigma | Mean | Median | Sigma |
| A | 15 | 222 | 5332221 | 44988.94 | 587 | 576 | 118.5 |
| A | 10 | 83 | 315182 | 2654.68 | 587 | 576 | 118.5 |
| A | 9 | 143 | 22385 | 184.03 | 587 | 576 | 118.5 |
| B | 0 | 189 | 107130 | 920.8 | 615 | 599 | 115.7 |
| B | 4 | 81 | 101008 | 867.88 | 615 | 599 | 115.7 |
| B | 5 | 172 | 92877 | 797.6 | 615 | 599 | 115.7 |
| C | 15 | 214 | 239592 | 1718.19 | 604 | 608 | 139.1 |
| C | 1 | 23 | 143927 | 1030.4 | 604 | 608 | 139.1 |
| C | 0 | 10 | 136833 | 979.4 | 604 | 608 | 139.1 |
| D | 12 | 227 | 866953 | 5879.67 | 602 | 584 | 147.3 |
| D | 2 | 249 | 328120 | 2222.85 | 602 | 584 | 147.3 |
| D | 2 | 250 | 290995 | 1970.89 | 602 | 584 | 147.3 |
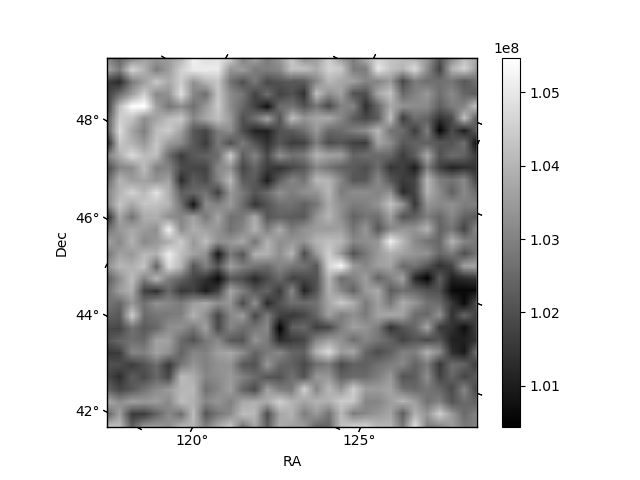
Histogram calculated using DETX and DETY for each event in the final _common_clean file
| Quadrant A | 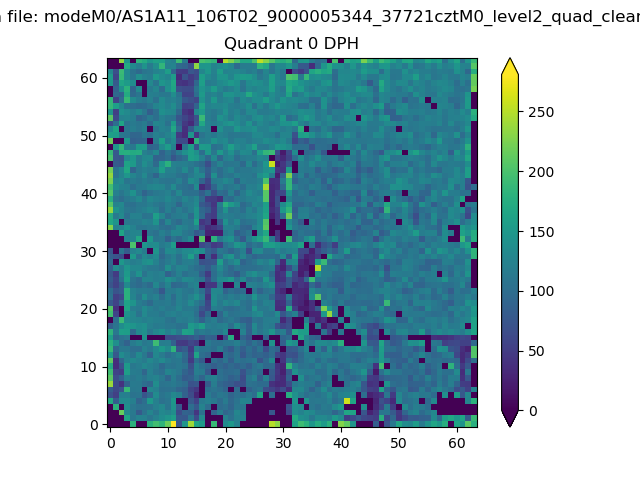 |
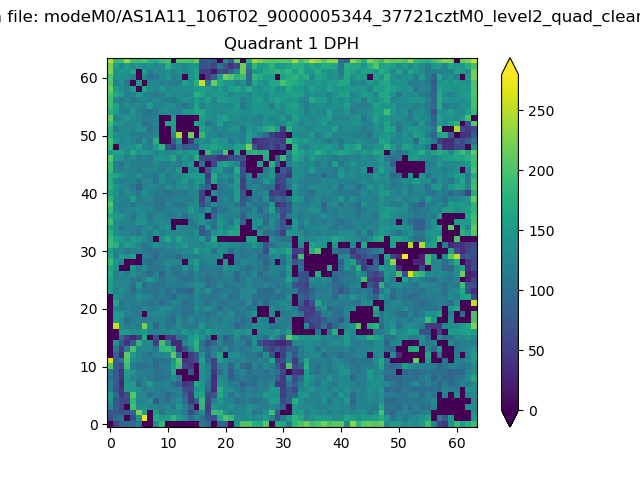 |
Quadrant B |
|---|---|---|---|
| Quadrant D | 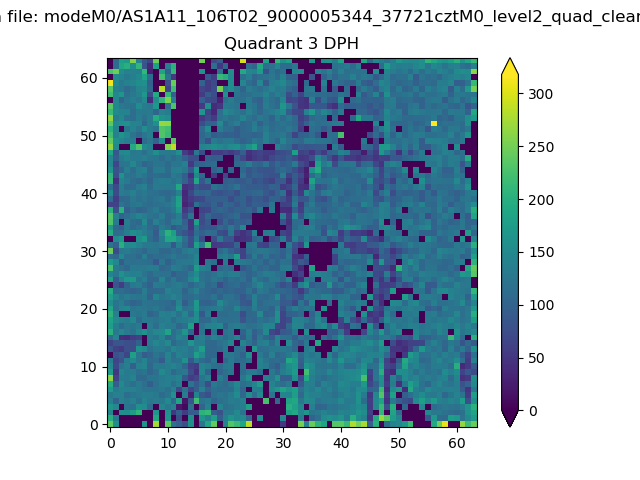 |
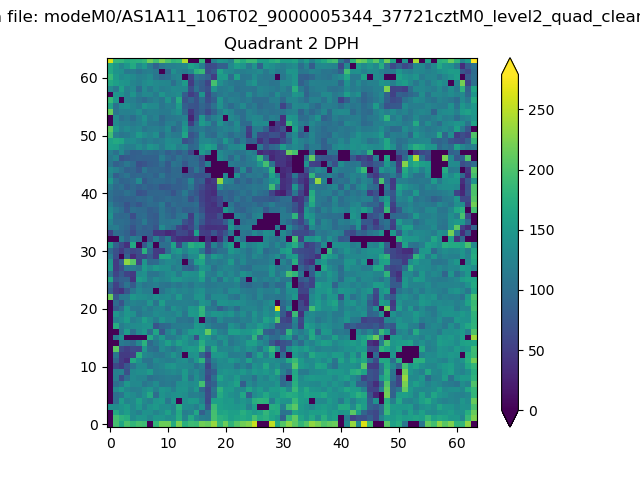 |
Quadrant C |
| Plot type | Count rate plots | Images |
|---|---|---|
| Comparison with Poisson distribution Blue bars denote a histogram of data divided into 1 sec bins. Red curve is a Poisson curve with rate = median count rate of data. |
 |
 |
| Quadrant-wise count rates Data is divided into 100 sec bins |
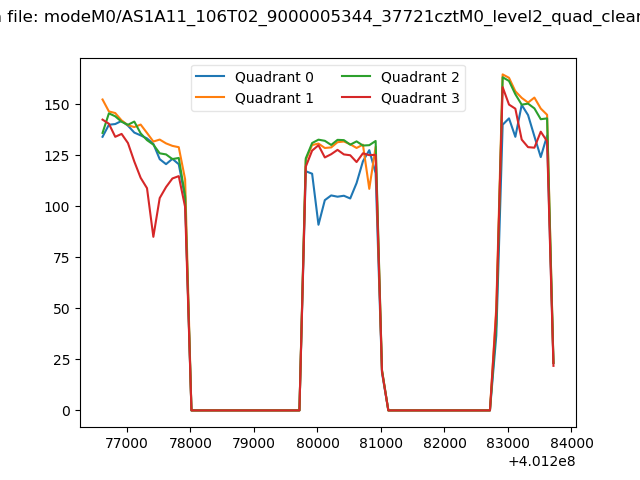 |
|
| Module-wise count rates for Quadrant A Data is divided into 100 sec bins |
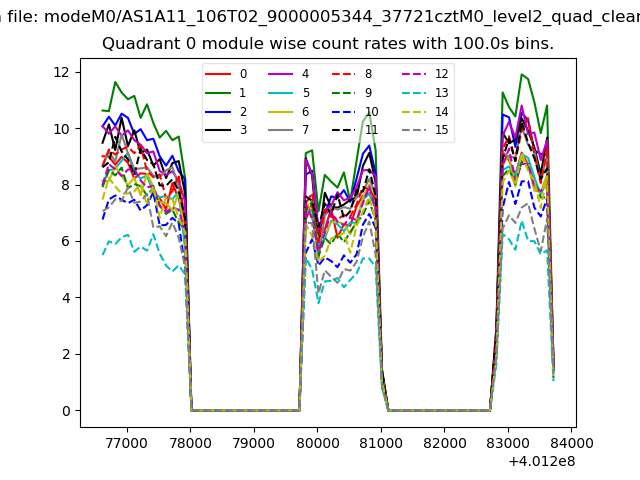 |
 |
| Module-wise count rates for Quadrant B Data is divided into 100 sec bins |
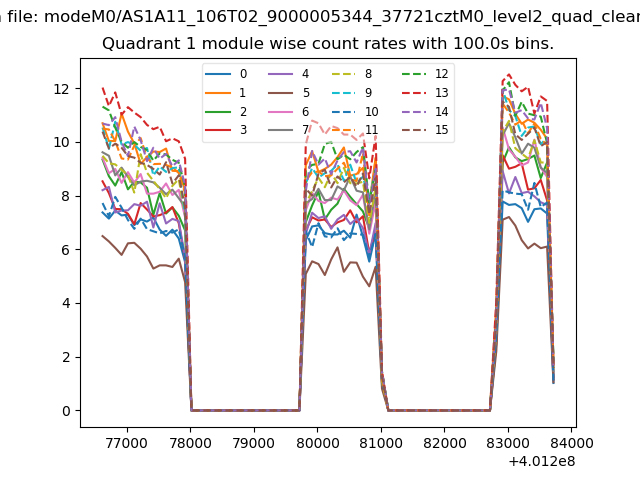 |
 |
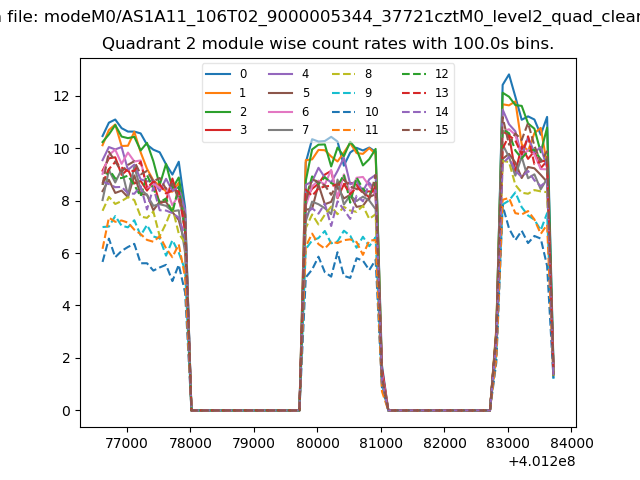
| Module-wise count rates for Quadrant C Data is divided into 100 sec bins |
 |
 |
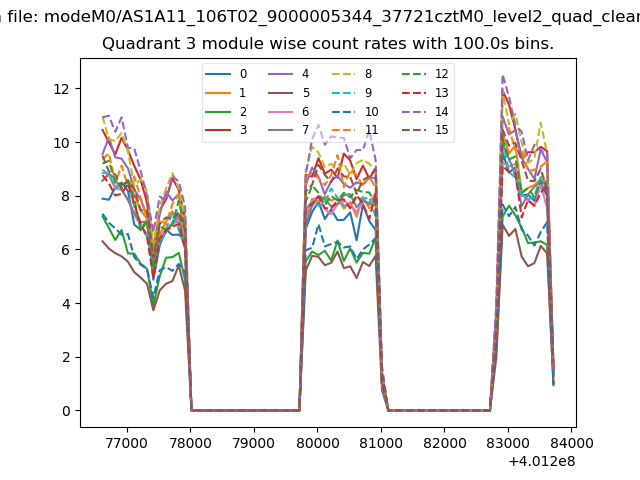
| Module-wise count rates for Quadrant D Data is divided into 100 sec bins |
 |
 |
| Parameter | Plot |
|---|---|
| CZT HV Monitor | 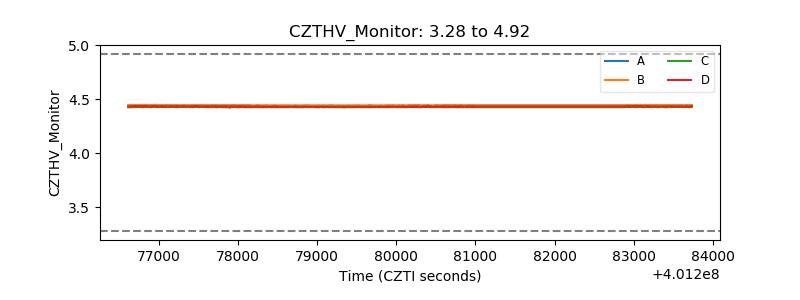 |
| D_VDD | 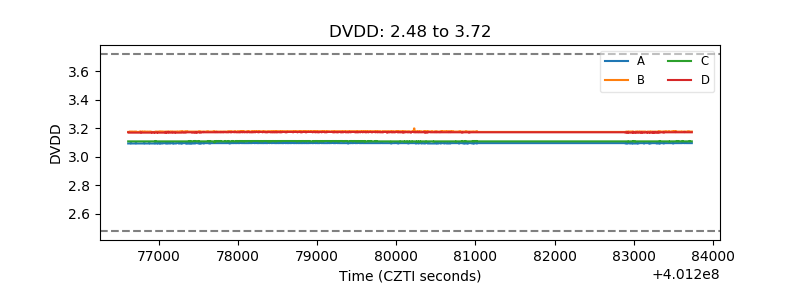 |
| Temperature 1 | 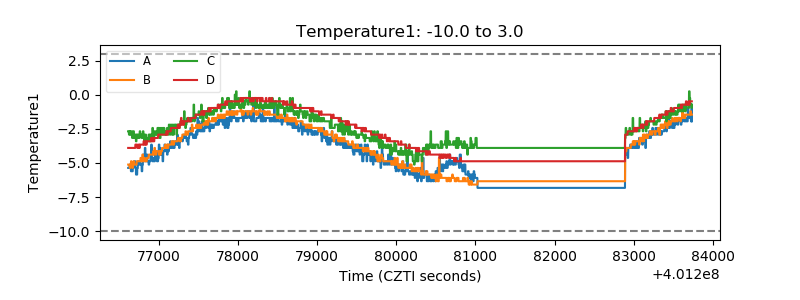 |
| Veto HV Monitor |  |
| Veto LLD | 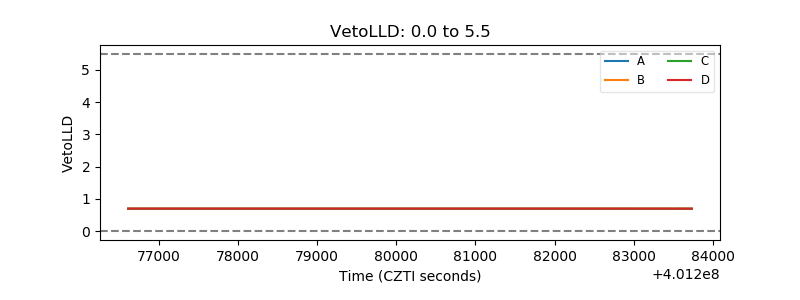 |
| Alpha Counter |  |
| _CPM_Rate |  |
| CZT Counter | 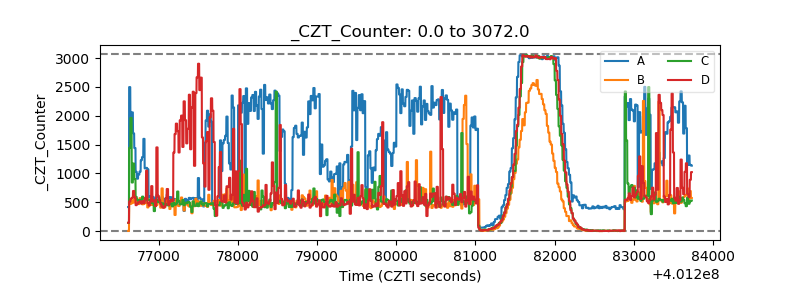 |
| +2.5 Volts monitor |  |
| +5 Volts monitor |  |
| _ROLL_ROT | 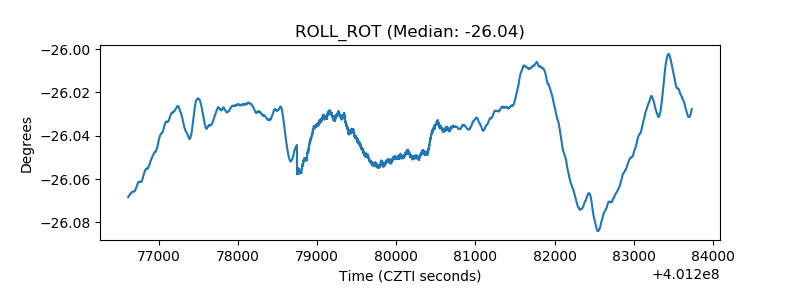 |
| _Roll_DEC | 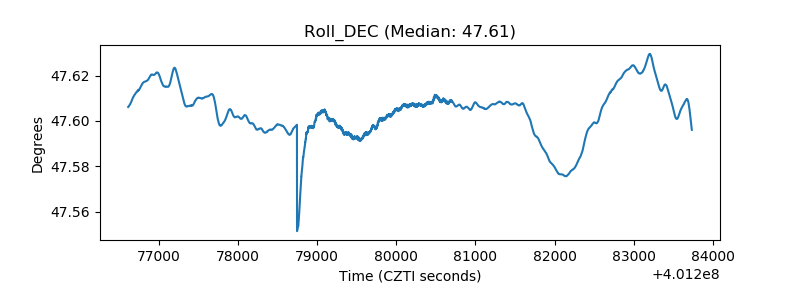 |
| _Roll_RA | 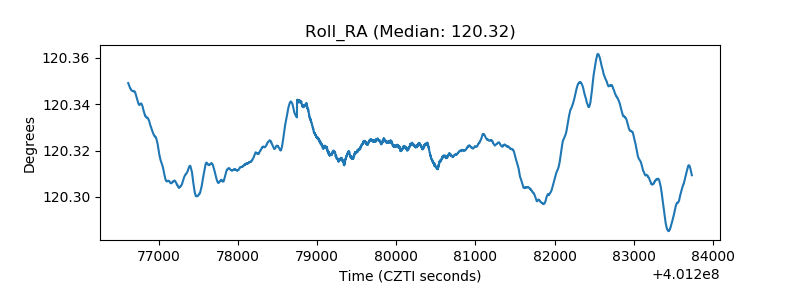 |
| Veto Counter | 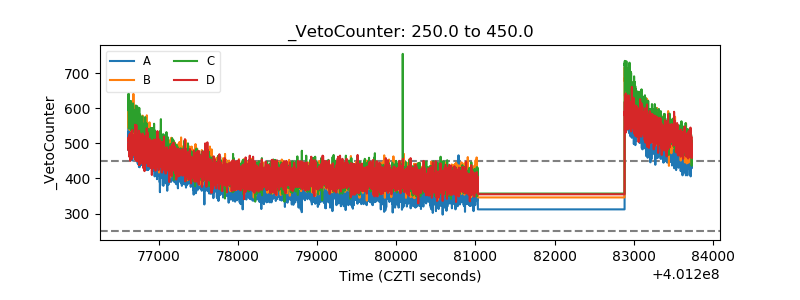 |