| Param | Original file | Final file |
|---|---|---|
| Filename | modeM0/AS1A11_106T02_9000005344_37722cztM0_level2.evt | modeM0/AS1A11_106T02_9000005344_37722cztM0_level2_quad_clean.evt |
| Size (bytes) | 621,385,920 | 67,141,440 |
| Size | 592.6 MB | 64.0 MB |
| Events in quadrant A | 8,411,331 | 395,943 |
| Events in quadrant B | 3,064,267 | 437,552 |
| Events in quadrant C | 2,823,848 | 438,023 |
| Events in quadrant D | 4,175,612 | 404,376 |
| Mode M9 | |||
|---|---|---|---|
| Quadrant | BADHDUFLAG | Total packets | Discarded packets |
| A | 0 | 24 | 0 |
| B | 0 | 24 | 0 |
| C | 0 | 24 | 0 |
| D | 0 | 25 | 0 |
| Mode SS | |||
|---|---|---|---|
| Quadrant | BADHDUFLAG | Total packets | Discarded packets |
| A | 0 | 104 | 0 |
| B | 0 | 104 | 0 |
| C | 0 | 104 | 0 |
| D | 0 | 104 | 0 |
| Mode M0 | |||
|---|---|---|---|
| Quadrant | BADHDUFLAG | Total packets | Discarded packets |
| A | 0 | 28519 | 3 |
| B | 0 | 12150 | 2 |
| C | 0 | 11225 | 2 |
| D | 0 | 15720 | 2 |
| Quadrant | Total seconds | Saturated seconds | Saturation percentage |
|---|---|---|---|
| A | 5086 | 1909 | 37.534408% |
| B | 5086 | 119 | 2.339756% |
| C | 5086 | 32 | 0.629178% |
| D | 5086 | 390 | 7.668109% |
Noise dominated data is calculated using 1-second bins in cleaned event files. If a bin has >2000 counts, and if more than 50% of those come from <1% of pixels, then it is considered to be noise-dominated and hence unusable.
| Quadrant | # 1 sec bins | Bins with >0 counts | Bins with >2000 counts | High rate bins dominated by noise | Noise dominated (total time) | Noise dominated (detector-on time) | Marked lightcurve |
|---|---|---|---|---|---|---|---|
| A | 7059 | 5087 | 1844 | 1844 | 26.12% | 36.25% | 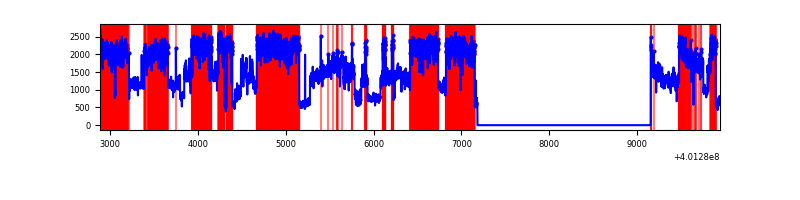 |
| B | 7058 | 5085 | 89 | 89 | 1.26% | 1.75% | 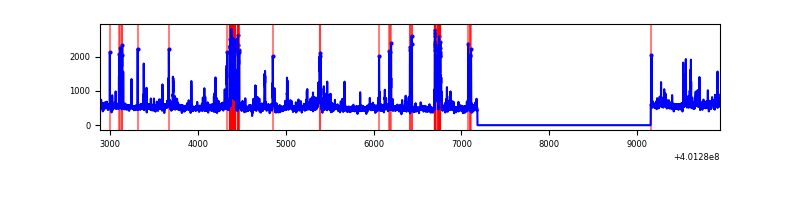 |
| C | 7058 | 5085 | 28 | 28 | 0.40% | 0.55% | 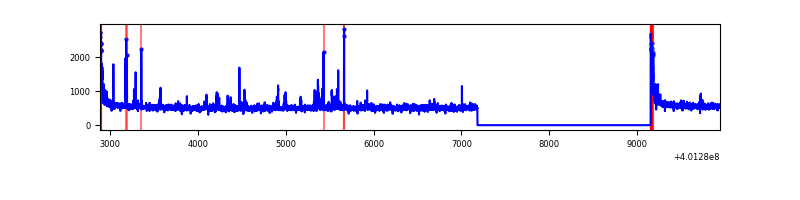 |
| D | 7058 | 5085 | 377 | 377 | 5.34% | 7.41% | 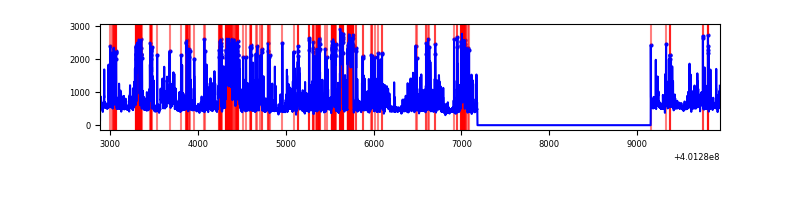 |
Top three noisy pixels from each quadrant. If the there are fewer than three noisy pixels in the level2.evt file, extra rows are filled as -1
| Pixel properties | Quadrant properties | ||||||
|---|---|---|---|---|---|---|---|
| Quadrant | DetID | PixID | Counts | Sigma | Mean | Median | Sigma |
| A | 15 | 222 | 5636704 | 48090.0 | 589 | 580 | 117.2 |
| A | 10 | 83 | 317095 | 2700.65 | 589 | 580 | 117.2 |
| A | 6 | 10 | 97053 | 823.15 | 589 | 580 | 117.2 |
| B | 5 | 172 | 238774 | 2065.19 | 615 | 600 | 115.3 |
| B | 4 | 81 | 121601 | 1049.19 | 615 | 600 | 115.3 |
| B | 5 | 255 | 63876 | 548.66 | 615 | 600 | 115.3 |
| C | 15 | 214 | 219349 | 1561.38 | 610 | 614 | 140.1 |
| C | 0 | 10 | 115449 | 819.72 | 610 | 614 | 140.1 |
| C | 1 | 23 | 52327 | 369.14 | 610 | 614 | 140.1 |
| D | 2 | 249 | 770008 | 5247.96 | 600 | 585 | 146.6 |
| D | 2 | 250 | 301890 | 2055.1 | 600 | 585 | 146.6 |
| D | 12 | 217 | 297374 | 2024.29 | 600 | 585 | 146.6 |
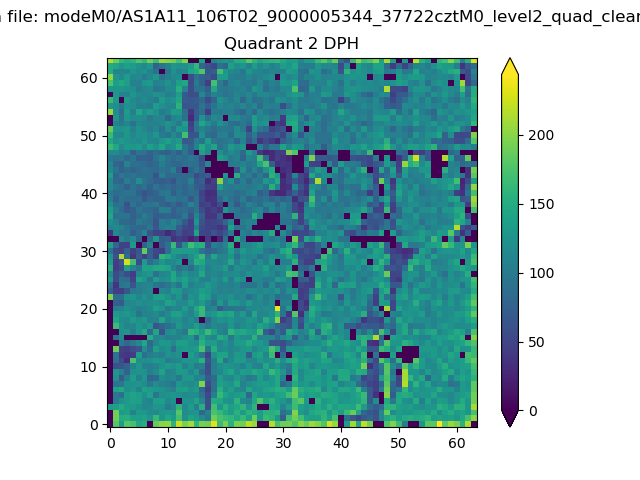
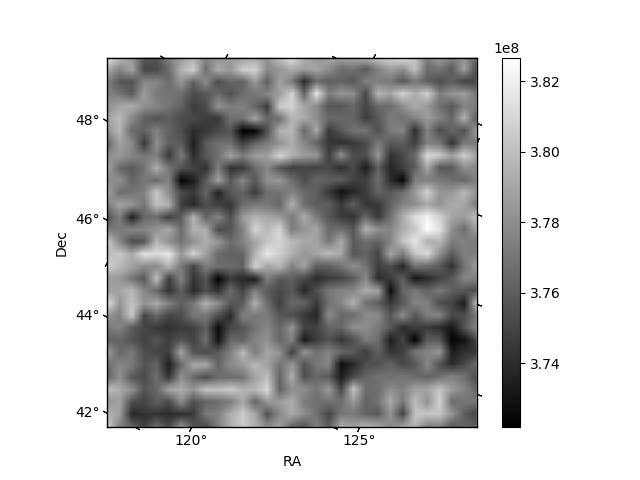
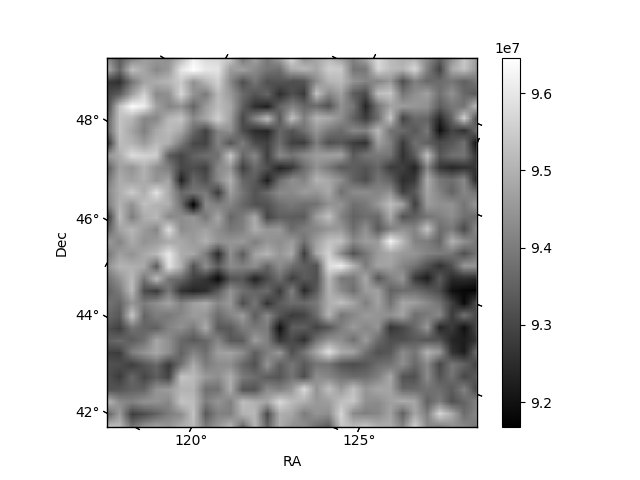
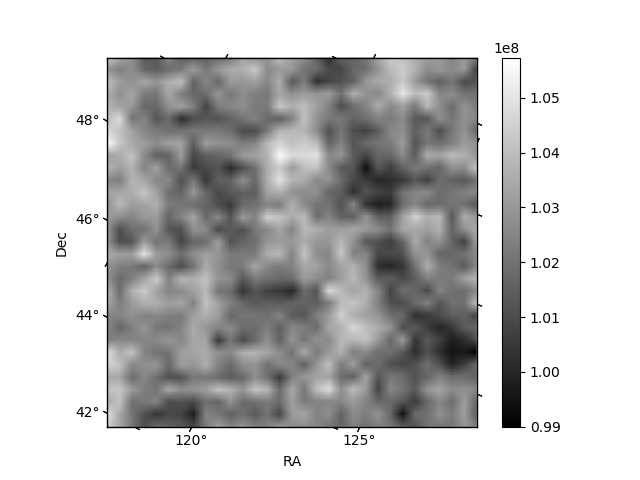
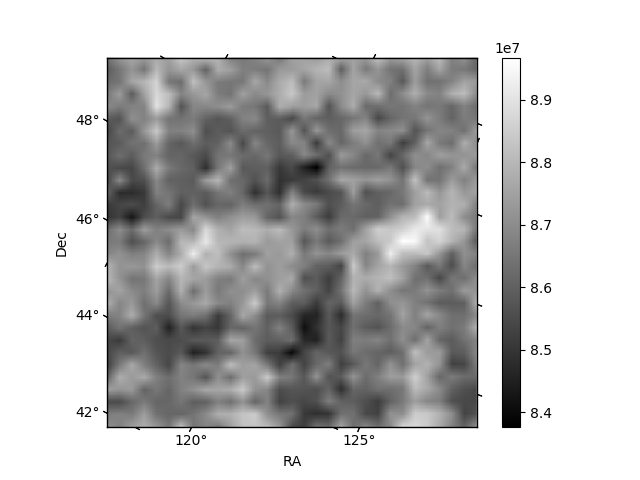
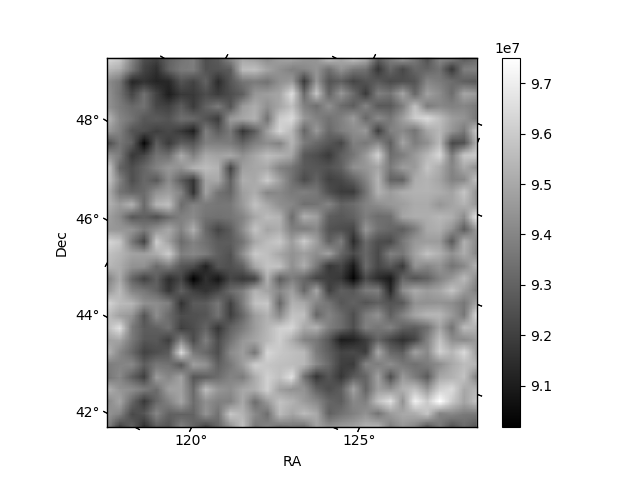
Histogram calculated using DETX and DETY for each event in the final _common_clean file
| Quadrant A | 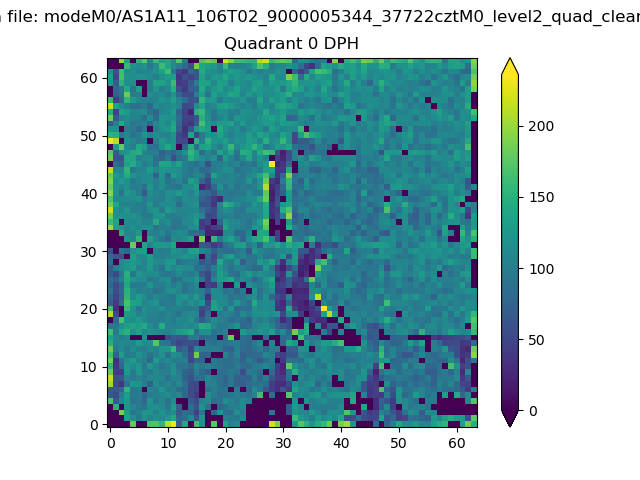 |
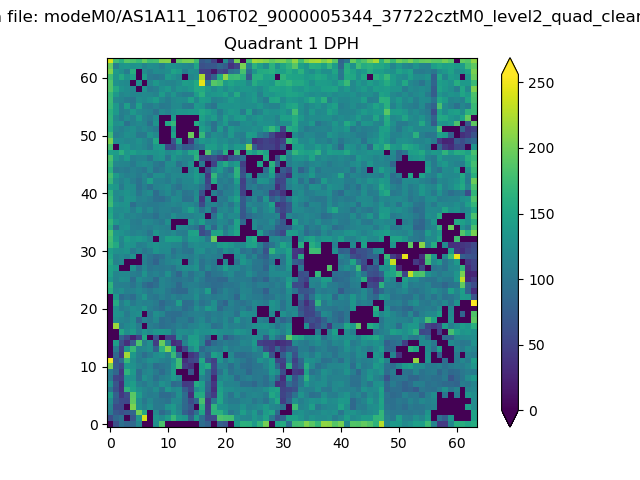 |
Quadrant B |
|---|---|---|---|
| Quadrant D | 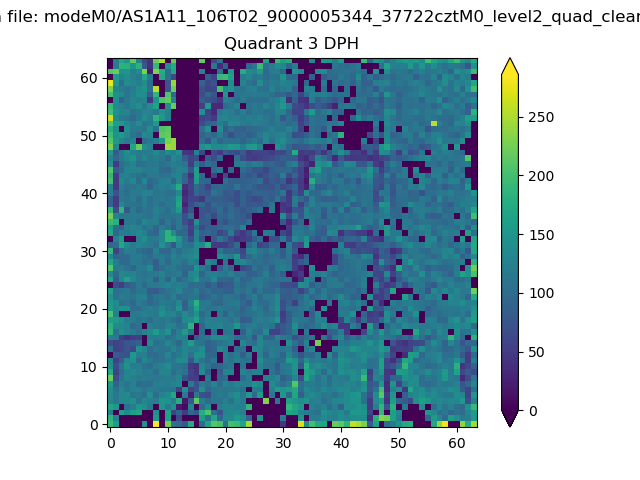 |
 |
Quadrant C |
| Plot type | Count rate plots | Images |
|---|---|---|
| Comparison with Poisson distribution Blue bars denote a histogram of data divided into 1 sec bins. Red curve is a Poisson curve with rate = median count rate of data. |
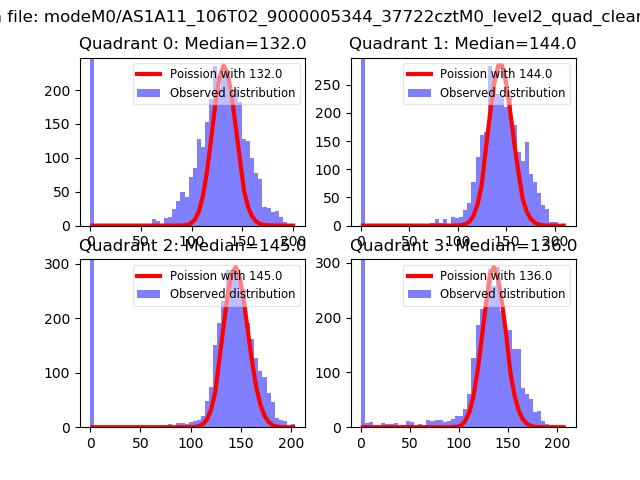 |
 |
| Quadrant-wise count rates Data is divided into 100 sec bins |
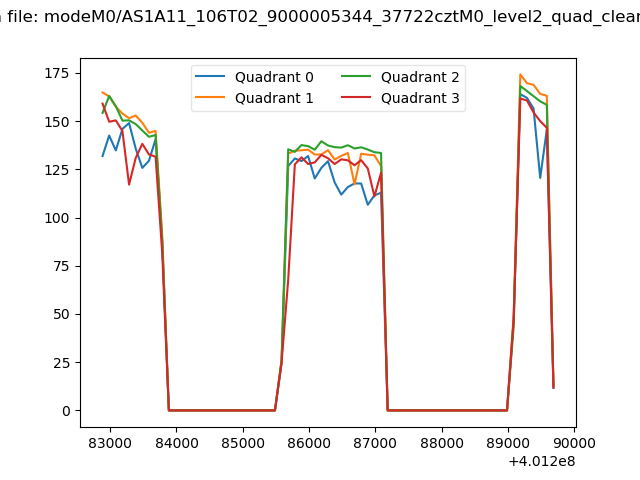 |
|
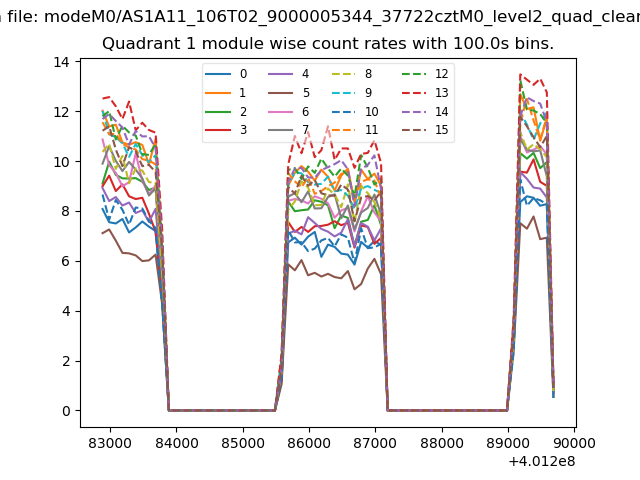
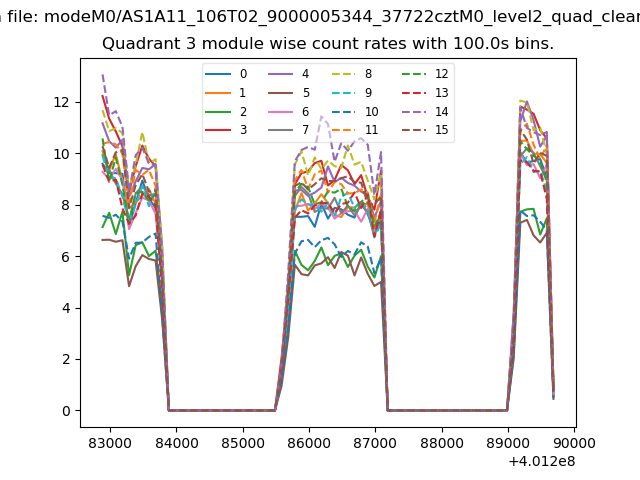
| Module-wise count rates for Quadrant A Data is divided into 100 sec bins |
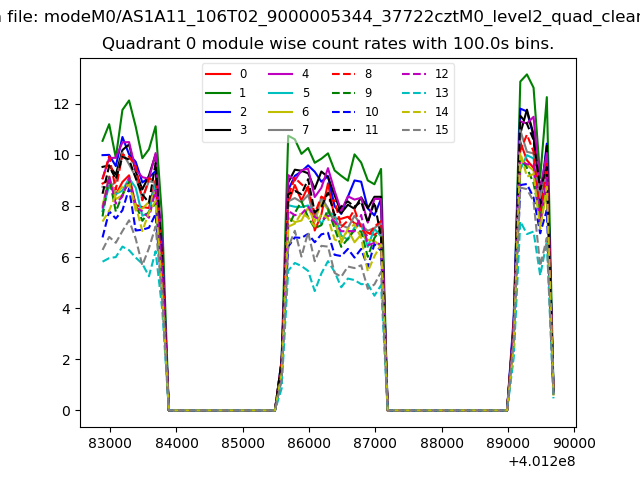 |
 |
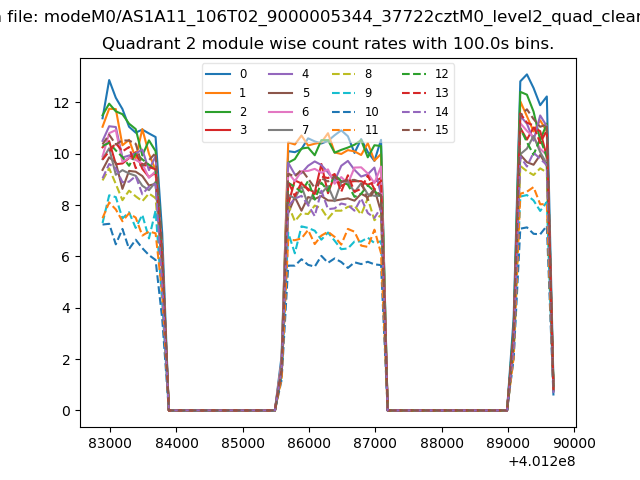
| Module-wise count rates for Quadrant B Data is divided into 100 sec bins |
 |
 |
| Module-wise count rates for Quadrant C Data is divided into 100 sec bins |
 |
 |
| Module-wise count rates for Quadrant D Data is divided into 100 sec bins |
 |
 |
| Parameter | Plot |
|---|---|
| CZT HV Monitor | 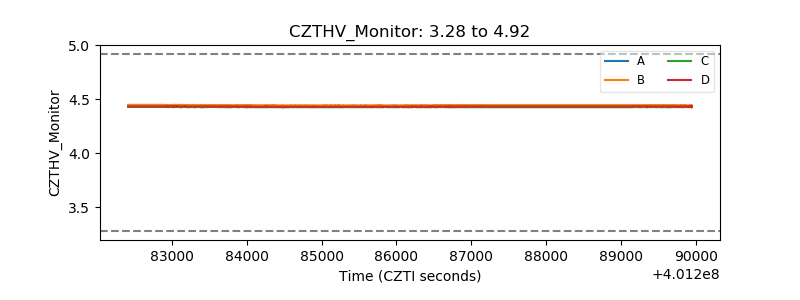 |
| D_VDD | 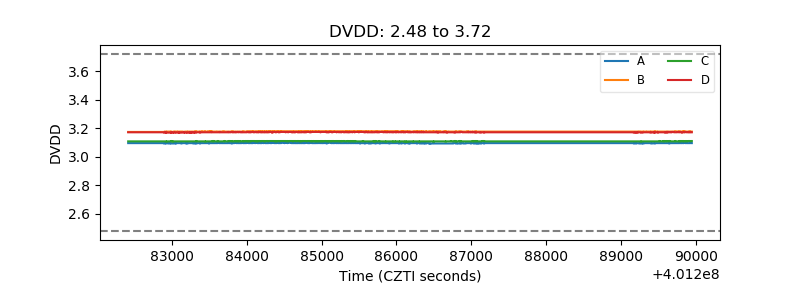 |
| Temperature 1 | 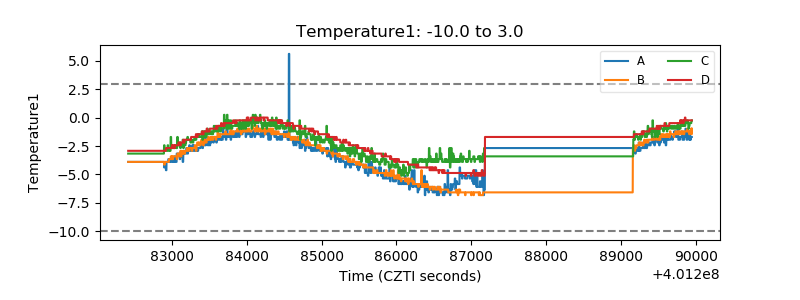 |
| Veto HV Monitor |  |
| Veto LLD | 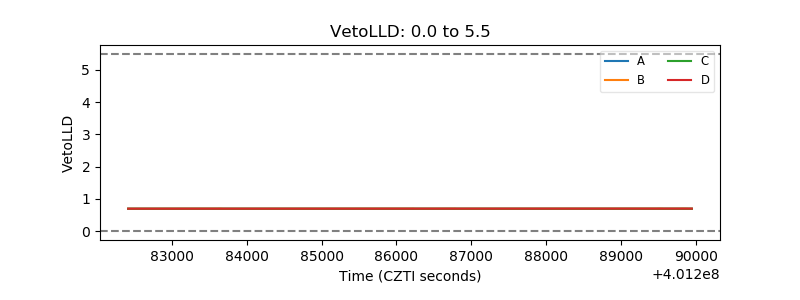 |
| Alpha Counter | 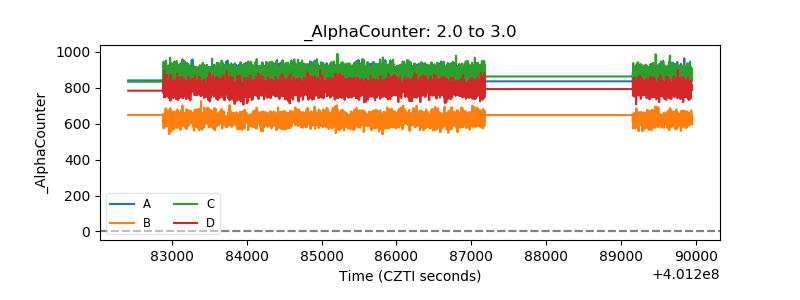 |
| _CPM_Rate | 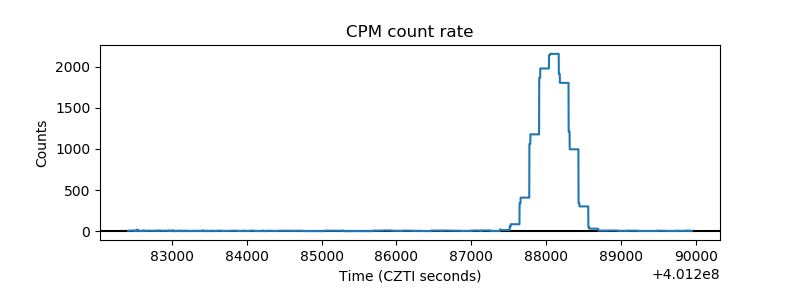 |
| CZT Counter | 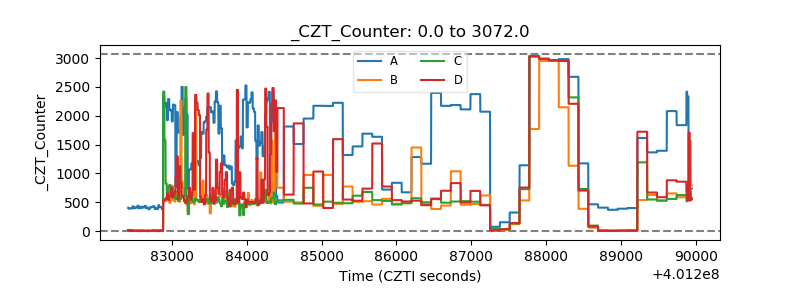 |
| +2.5 Volts monitor | 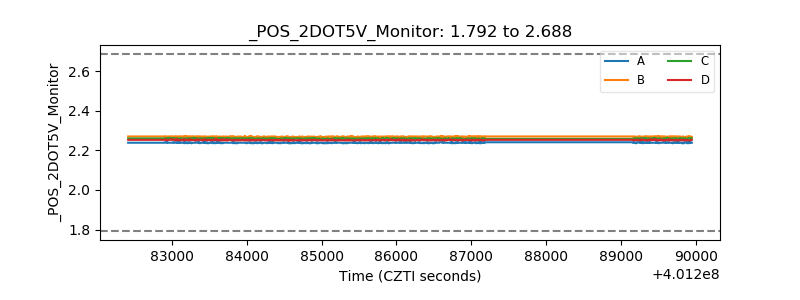 |
| +5 Volts monitor | 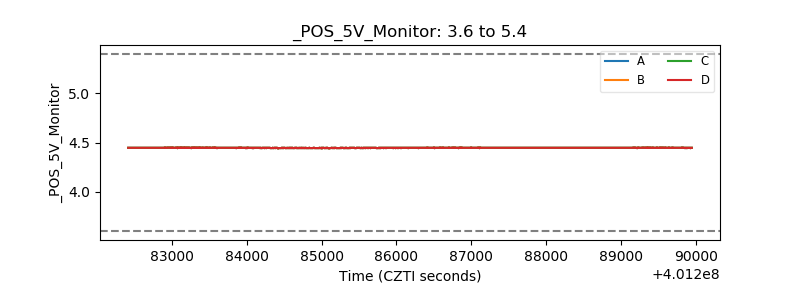 |
| _ROLL_ROT | 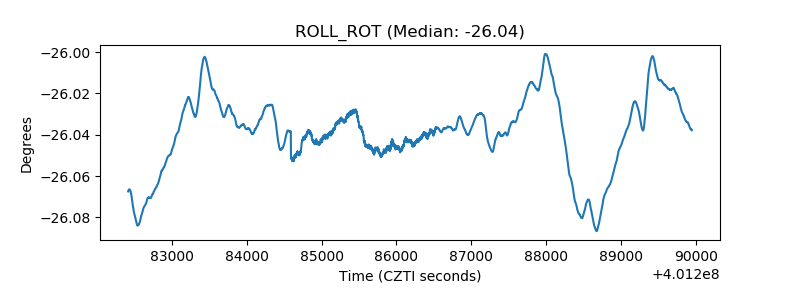 |
| _Roll_DEC | 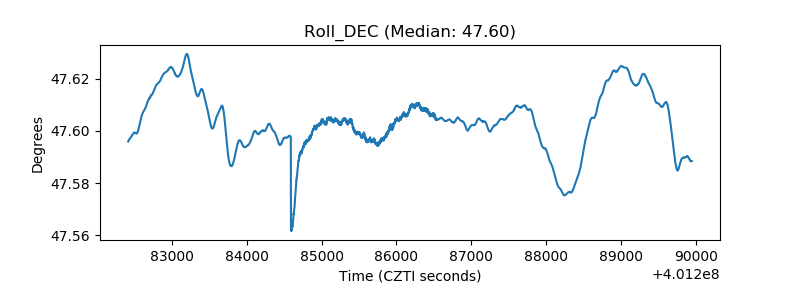 |
| _Roll_RA | 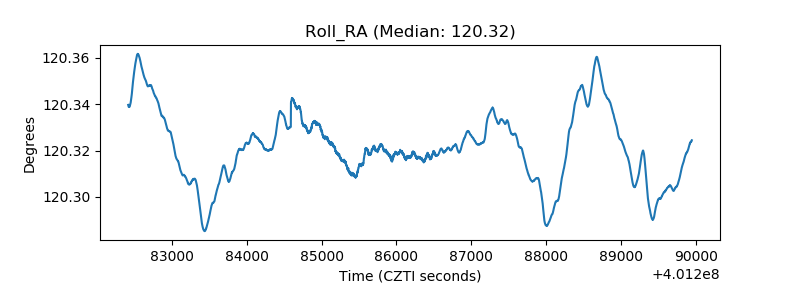 |
| Veto Counter | 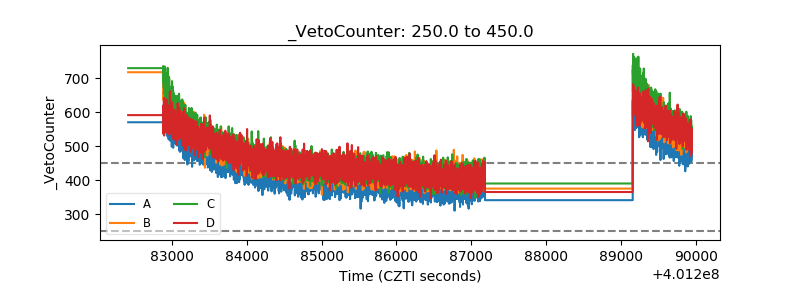 |