| Param | Original file | Final file |
|---|---|---|
| Filename | modeM0/AS1A11_106T02_9000005344_37723cztM0_level2.evt | modeM0/AS1A11_106T02_9000005344_37723cztM0_level2_quad_clean.evt |
| Size (bytes) | 657,354,240 | 57,481,920 |
| Size | 626.9 MB | 54.8 MB |
| Events in quadrant A | 9,193,684 | 303,256 |
| Events in quadrant B | 3,090,724 | 361,356 |
| Events in quadrant C | 2,892,927 | 363,781 |
| Events in quadrant D | 4,378,441 | 346,386 |
| Mode M9 | |||
|---|---|---|---|
| Quadrant | BADHDUFLAG | Total packets | Discarded packets |
| A | 0 | 21 | 0 |
| B | 0 | 21 | 0 |
| C | 0 | 21 | 0 |
| D | 0 | 22 | 0 |
| Mode SS | |||
|---|---|---|---|
| Quadrant | BADHDUFLAG | Total packets | Discarded packets |
| A | 0 | 106 | 0 |
| B | 0 | 106 | 0 |
| C | 0 | 106 | 0 |
| D | 0 | 106 | 0 |
| Mode M0 | |||
|---|---|---|---|
| Quadrant | BADHDUFLAG | Total packets | Discarded packets |
| A | 0 | 30927 | 3 |
| B | 0 | 12447 | 2 |
| C | 0 | 11415 | 2 |
| D | 0 | 16457 | 2 |
| Quadrant | Total seconds | Saturated seconds | Saturation percentage |
|---|---|---|---|
| A | 5208 | 2688 | 51.612903% |
| B | 5208 | 77 | 1.478495% |
| C | 5208 | 25 | 0.480031% |
| D | 5208 | 456 | 8.755760% |
Noise dominated data is calculated using 1-second bins in cleaned event files. If a bin has >2000 counts, and if more than 50% of those come from <1% of pixels, then it is considered to be noise-dominated and hence unusable.
| Quadrant | # 1 sec bins | Bins with >0 counts | Bins with >2000 counts | High rate bins dominated by noise | Noise dominated (total time) | Noise dominated (detector-on time) | Marked lightcurve |
|---|---|---|---|---|---|---|---|
| A | 7271 | 5209 | 2469 | 2469 | 33.96% | 47.40% | 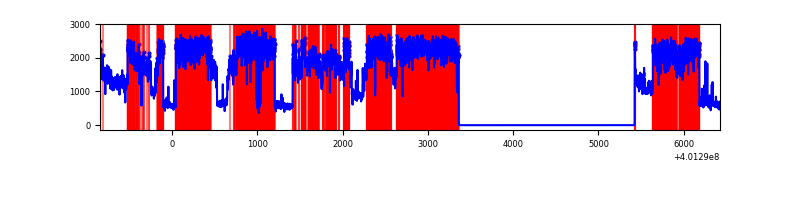 |
| B | 7270 | 5207 | 55 | 55 | 0.76% | 1.06% | 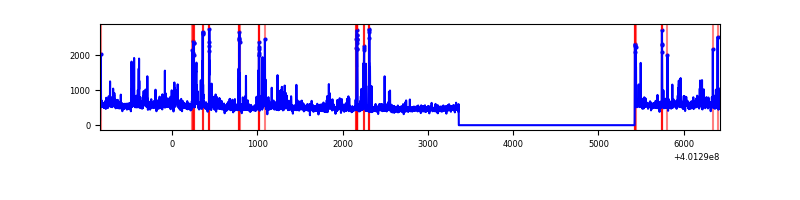 |
| C | 7270 | 5207 | 22 | 22 | 0.30% | 0.42% | 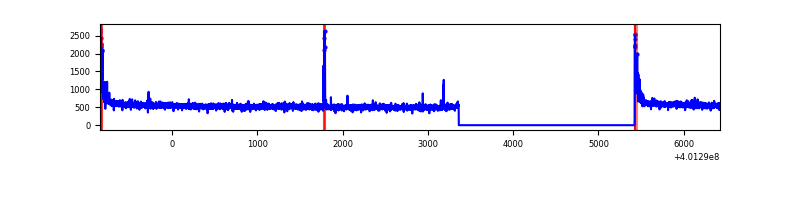 |
| D | 7270 | 5207 | 431 | 431 | 5.93% | 8.28% | 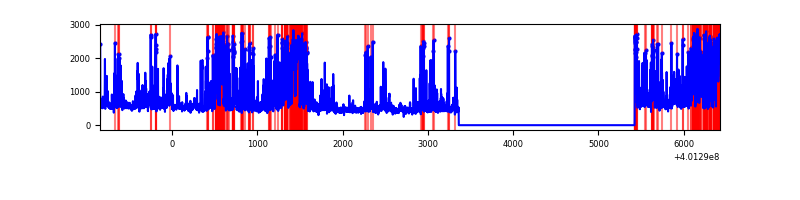 |
Top three noisy pixels from each quadrant. If the there are fewer than three noisy pixels in the level2.evt file, extra rows are filled as -1
| Pixel properties | Quadrant properties | ||||||
|---|---|---|---|---|---|---|---|
| Quadrant | DetID | PixID | Counts | Sigma | Mean | Median | Sigma |
| A | 15 | 222 | 6246221 | 54124.73 | 573 | 562 | 115.4 |
| A | 9 | 143 | 367983 | 3184.06 | 573 | 562 | 115.4 |
| A | 10 | 83 | 312889 | 2706.62 | 573 | 562 | 115.4 |
| B | 5 | 172 | 214043 | 1765.95 | 647 | 633 | 120.8 |
| B | 0 | 189 | 70131 | 575.09 | 647 | 633 | 120.8 |
| B | 5 | 255 | 58125 | 475.74 | 647 | 633 | 120.8 |
| C | 15 | 214 | 223249 | 1512.92 | 645 | 652 | 147.1 |
| C | 0 | 10 | 120067 | 811.63 | 645 | 652 | 147.1 |
| C | 14 | 254 | 23892 | 157.96 | 645 | 652 | 147.1 |
| D | 2 | 249 | 905780 | 5750.76 | 626 | 613 | 157.4 |
| D | 12 | 233 | 243265 | 1541.63 | 626 | 613 | 157.4 |
| D | 1 | 47 | 206740 | 1309.58 | 626 | 613 | 157.4 |
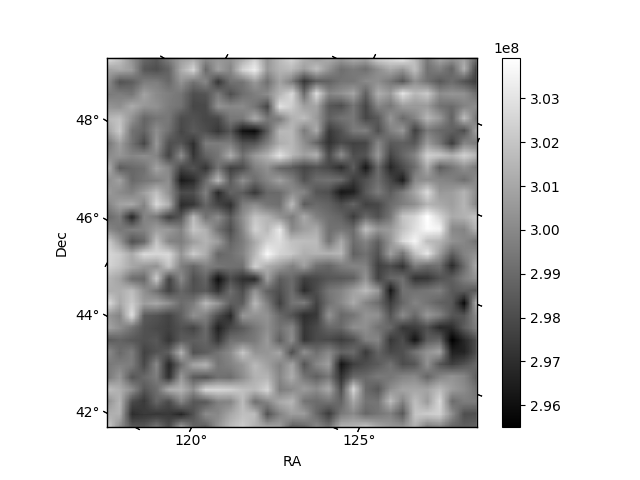
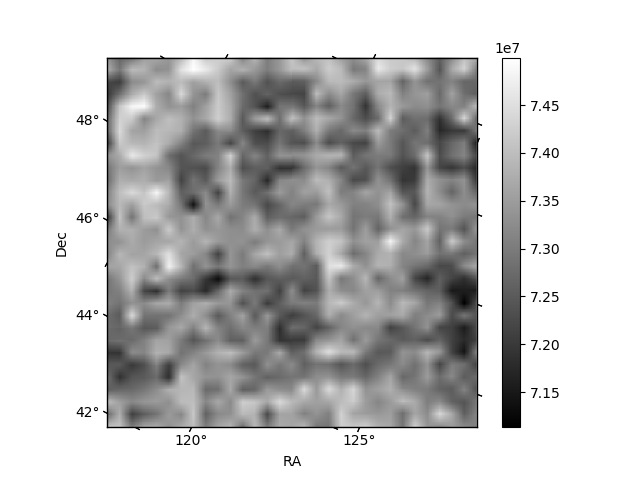
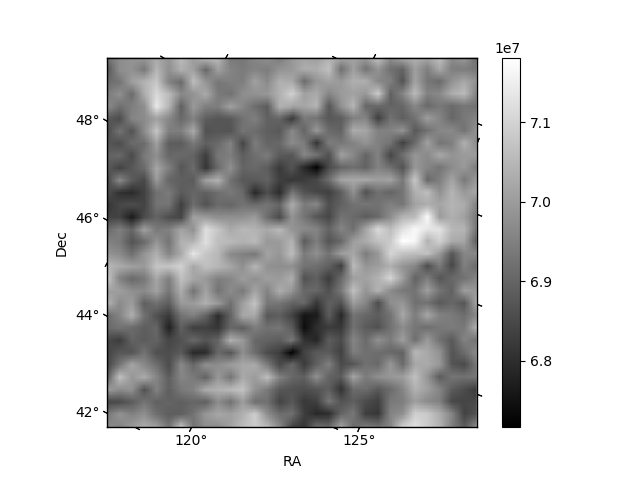
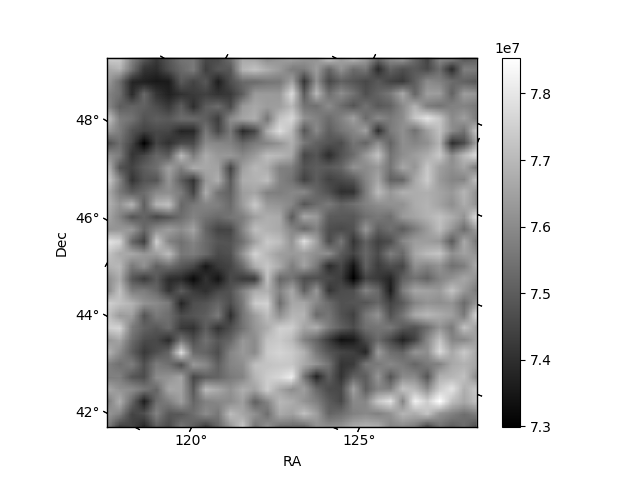
Histogram calculated using DETX and DETY for each event in the final _common_clean file
| Quadrant A | 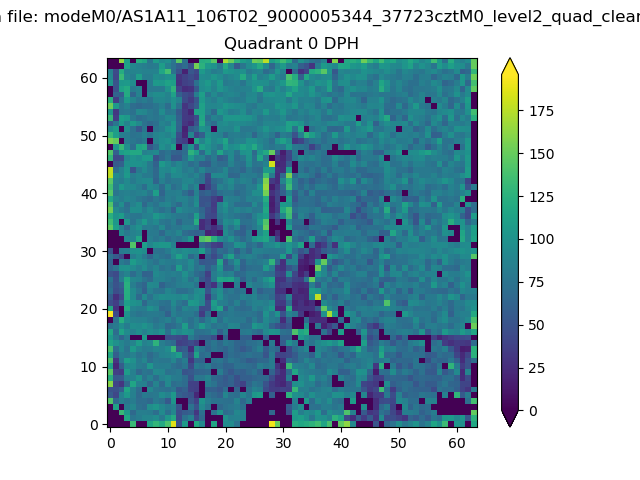 |
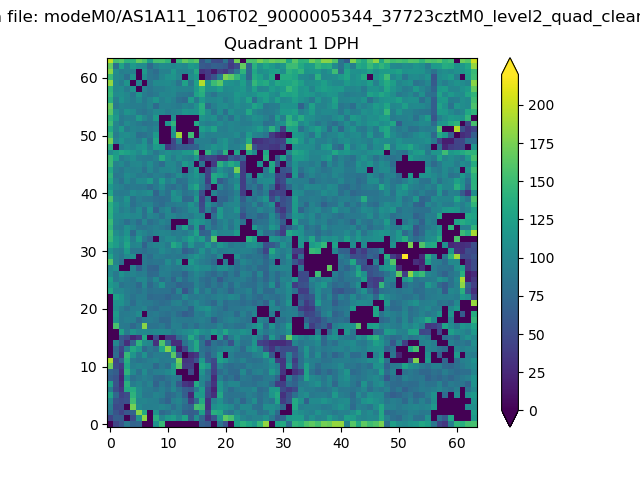 |
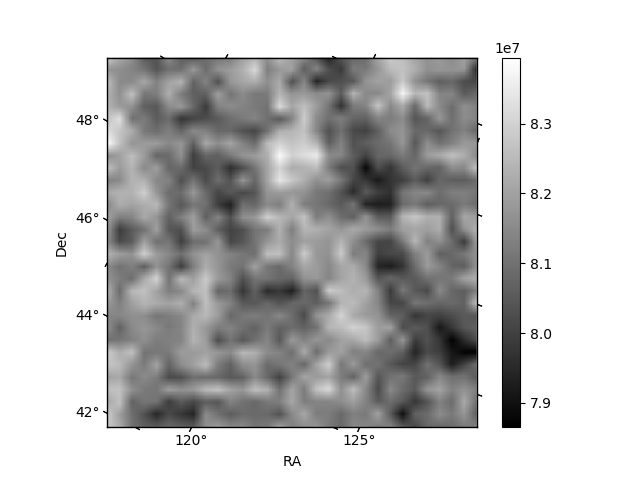
Quadrant B |
|---|---|---|---|
| Quadrant D | 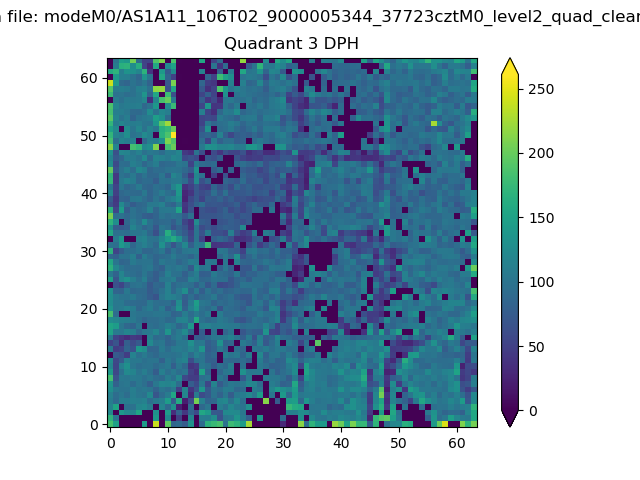 |
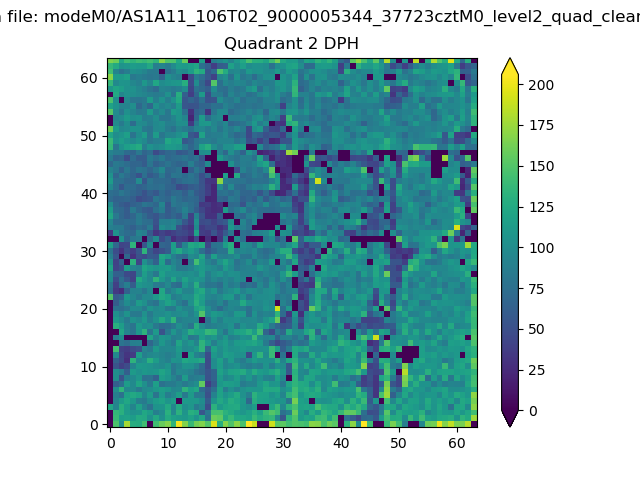 |
Quadrant C |
| Plot type | Count rate plots | Images |
|---|---|---|
| Comparison with Poisson distribution Blue bars denote a histogram of data divided into 1 sec bins. Red curve is a Poisson curve with rate = median count rate of data. |
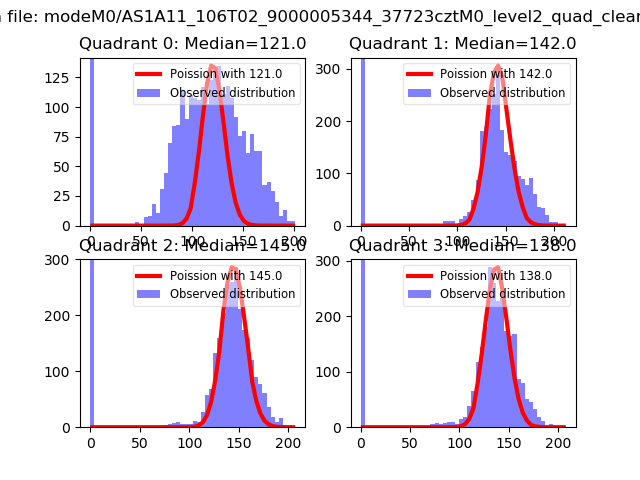 |
 |
| Quadrant-wise count rates Data is divided into 100 sec bins |
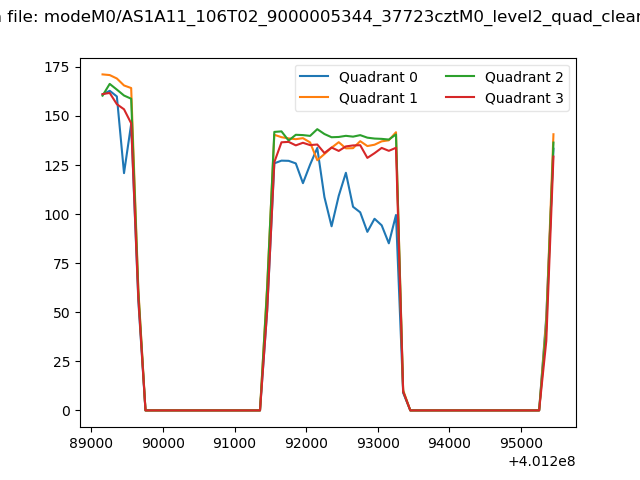 |
|
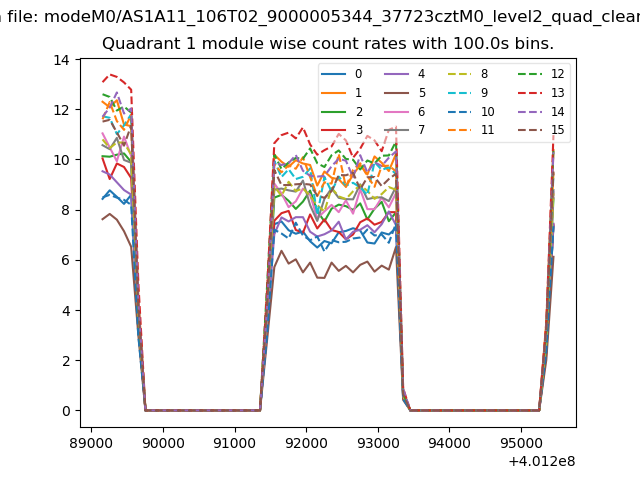
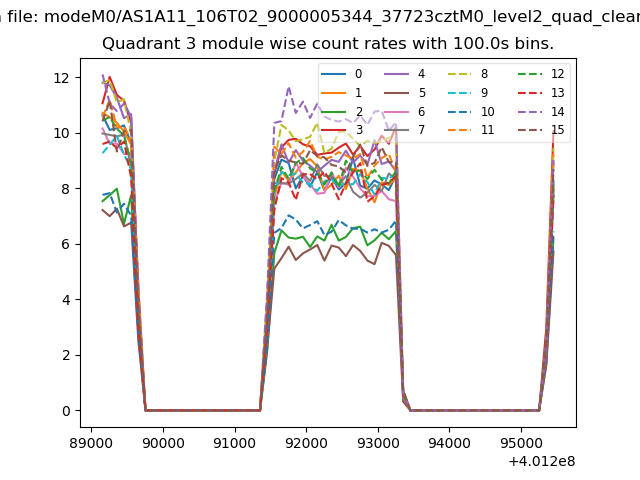
| Module-wise count rates for Quadrant A Data is divided into 100 sec bins |
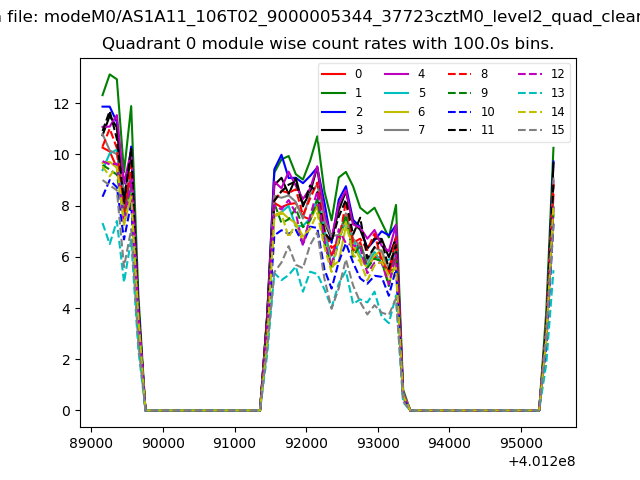 |
 |
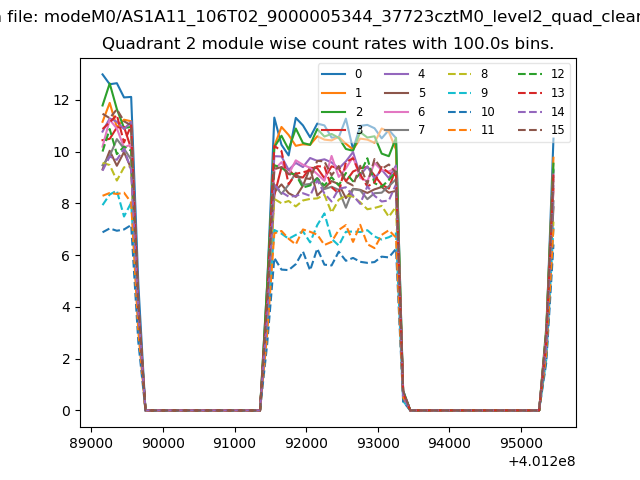
| Module-wise count rates for Quadrant B Data is divided into 100 sec bins |
 |
 |
| Module-wise count rates for Quadrant C Data is divided into 100 sec bins |
 |
 |
| Module-wise count rates for Quadrant D Data is divided into 100 sec bins |
 |
 |
| Parameter | Plot |
|---|---|
| CZT HV Monitor | 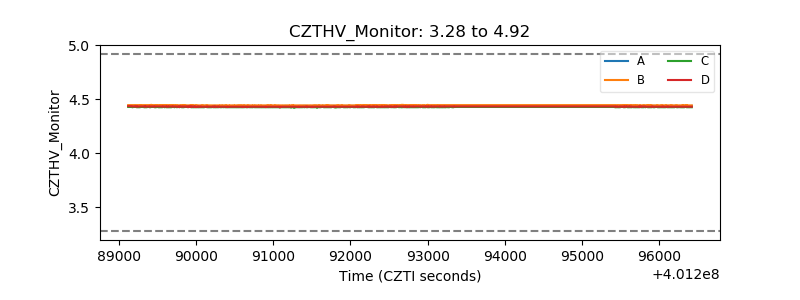 |
| D_VDD | 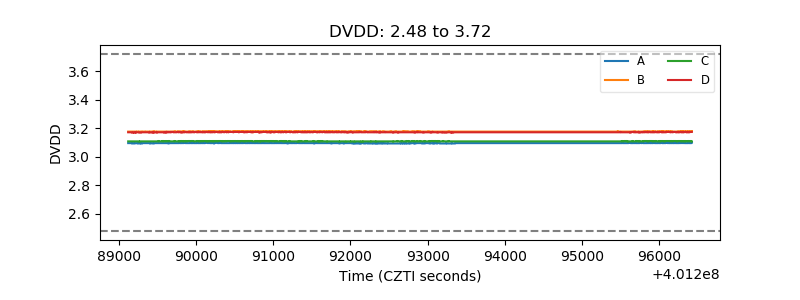 |
| Temperature 1 | 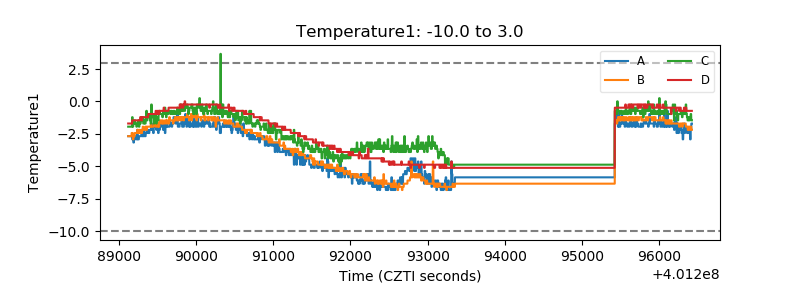 |
| Veto HV Monitor | 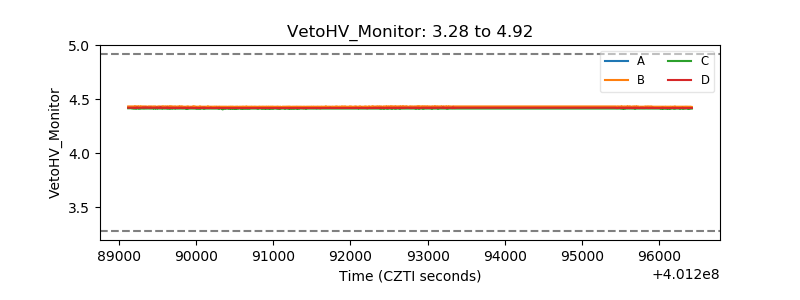 |
| Veto LLD | 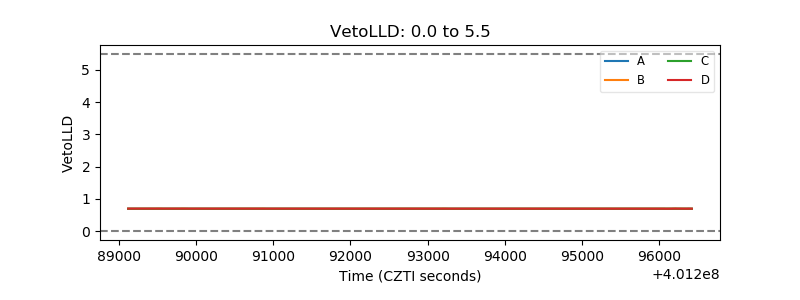 |
| Alpha Counter | 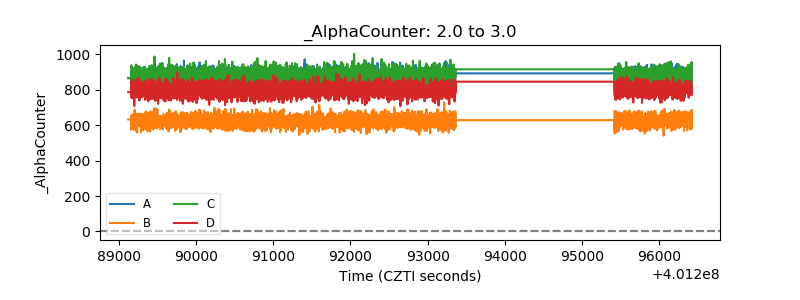 |
| _CPM_Rate | 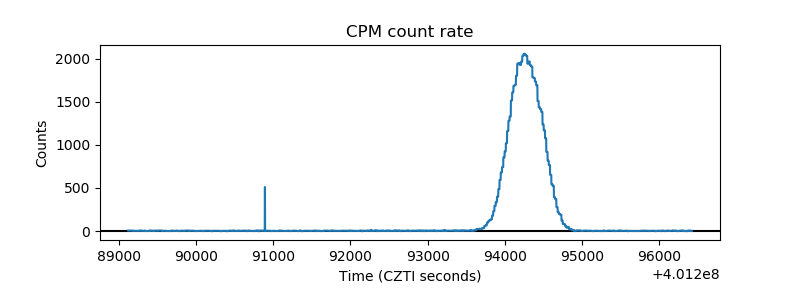 |
| CZT Counter | 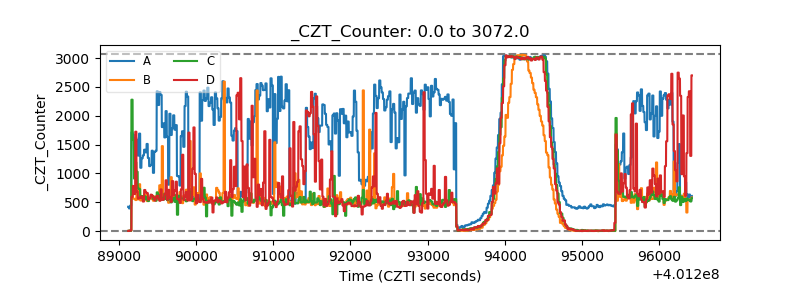 |
| +2.5 Volts monitor | 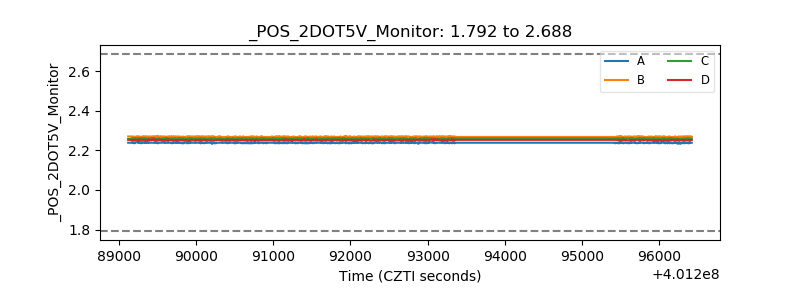 |
| +5 Volts monitor | 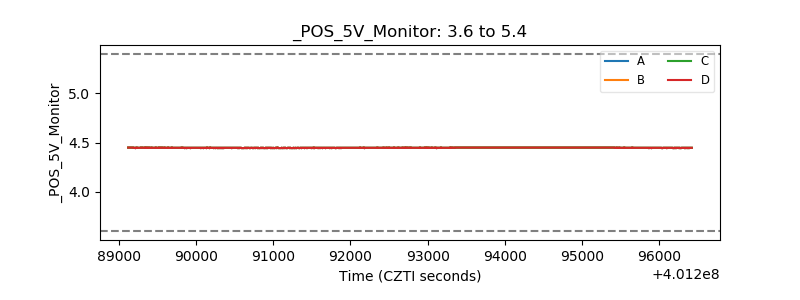 |
| _ROLL_ROT | 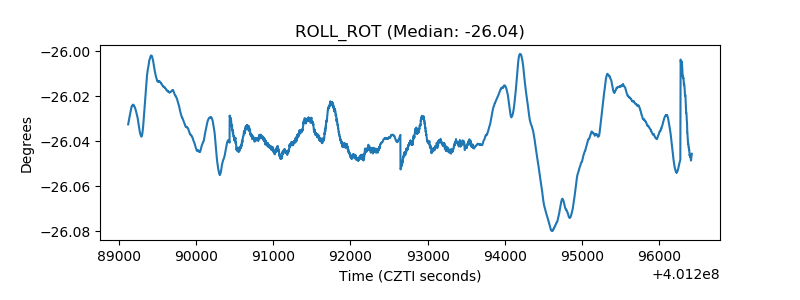 |
| _Roll_DEC | 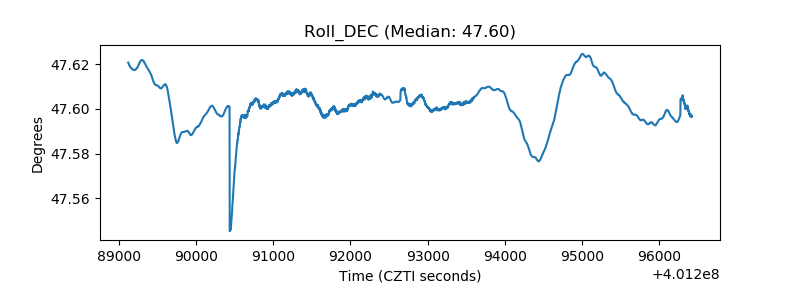 |
| _Roll_RA | 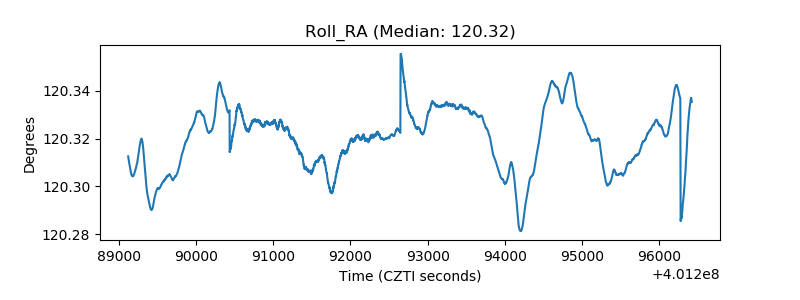 |
| Veto Counter | 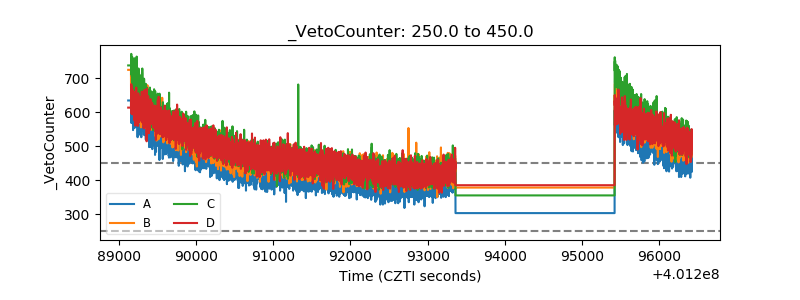 |