| Param | Original file | Final file |
|---|---|---|
| Filename | modeM0/AS1A11_106T02_9000005344_37725cztM0_level2.evt | modeM0/AS1A11_106T02_9000005344_37725cztM0_level2_quad_clean.evt |
| Size (bytes) | 692,449,920 | 55,604,160 |
| Size | 660.4 MB | 53.0 MB |
| Events in quadrant A | 9,953,088 | 296,824 |
| Events in quadrant B | 3,338,745 | 341,268 |
| Events in quadrant C | 2,690,338 | 360,449 |
| Events in quadrant D | 4,650,936 | 333,026 |
| Mode M9 | |||
|---|---|---|---|
| Quadrant | BADHDUFLAG | Total packets | Discarded packets |
| A | 0 | 21 | 0 |
| B | 0 | 21 | 0 |
| C | 0 | 21 | 0 |
| D | 0 | 21 | 0 |
| Mode SS | |||
|---|---|---|---|
| Quadrant | BADHDUFLAG | Total packets | Discarded packets |
| A | 0 | 104 | 0 |
| B | 0 | 104 | 0 |
| C | 0 | 104 | 0 |
| D | 0 | 104 | 0 |
| Mode M0 | |||
|---|---|---|---|
| Quadrant | BADHDUFLAG | Total packets | Discarded packets |
| A | 0 | 33034 | 3 |
| B | 0 | 13133 | 2 |
| C | 0 | 10830 | 2 |
| D | 0 | 17314 | 2 |
| Quadrant | Total seconds | Saturated seconds | Saturation percentage |
|---|---|---|---|
| A | 5000 | 2927 | 58.540000% |
| B | 5000 | 225 | 4.500000% |
| C | 5000 | 37 | 0.740000% |
| D | 5000 | 311 | 6.220000% |
Noise dominated data is calculated using 1-second bins in cleaned event files. If a bin has >2000 counts, and if more than 50% of those come from <1% of pixels, then it is considered to be noise-dominated and hence unusable.
| Quadrant | # 1 sec bins | Bins with >0 counts | Bins with >2000 counts | High rate bins dominated by noise | Noise dominated (total time) | Noise dominated (detector-on time) | Marked lightcurve |
|---|---|---|---|---|---|---|---|
| A | 7124 | 5001 | 3078 | 3078 | 43.21% | 61.55% | 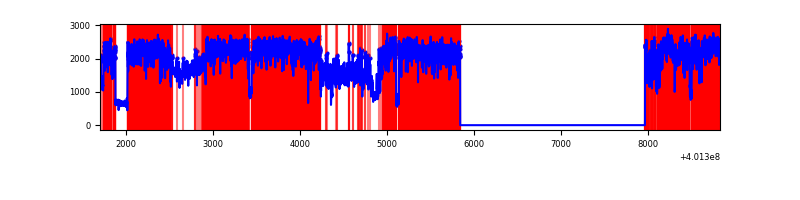 |
| B | 7124 | 5000 | 166 | 166 | 2.33% | 3.32% | 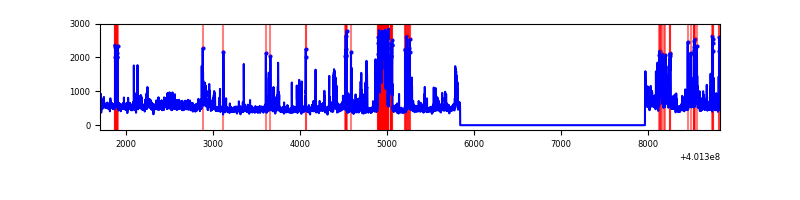 |
| C | 7124 | 5000 | 27 | 27 | 0.38% | 0.54% | 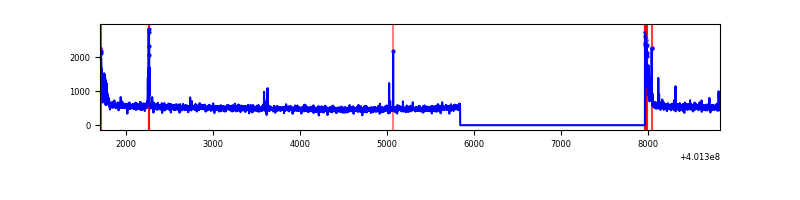 |
| D | 7124 | 5000 | 325 | 325 | 4.56% | 6.50% | 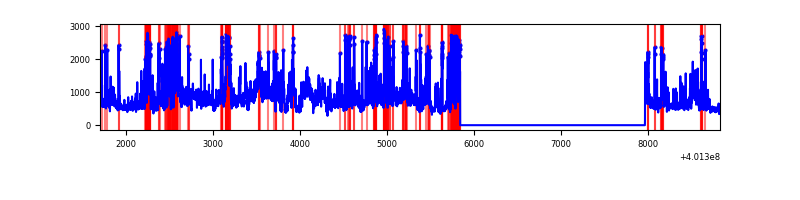 |
Top three noisy pixels from each quadrant. If the there are fewer than three noisy pixels in the level2.evt file, extra rows are filled as -1
| Pixel properties | Quadrant properties | ||||||
|---|---|---|---|---|---|---|---|
| Quadrant | DetID | PixID | Counts | Sigma | Mean | Median | Sigma |
| A | 15 | 222 | 7555578 | 71850.81 | 523 | 514 | 105.1 |
| A | 10 | 83 | 292629 | 2778.1 | 523 | 514 | 105.1 |
| A | 9 | 143 | 49774 | 468.48 | 523 | 514 | 105.1 |
| B | 5 | 255 | 471271 | 4310.0 | 581 | 568 | 109.2 |
| B | 5 | 172 | 143691 | 1310.51 | 581 | 568 | 109.2 |
| B | 4 | 171 | 109623 | 998.56 | 581 | 568 | 109.2 |
| C | 15 | 214 | 212176 | 1581.02 | 586 | 591 | 133.8 |
| C | 0 | 10 | 141003 | 1049.19 | 586 | 591 | 133.8 |
| C | 15 | 159 | 27293 | 199.52 | 586 | 591 | 133.8 |
| D | 12 | 227 | 1673805 | 11999.12 | 577 | 563 | 139.4 |
| D | 2 | 249 | 260412 | 1863.42 | 577 | 563 | 139.4 |
| D | 12 | 233 | 102066 | 727.9 | 577 | 563 | 139.4 |
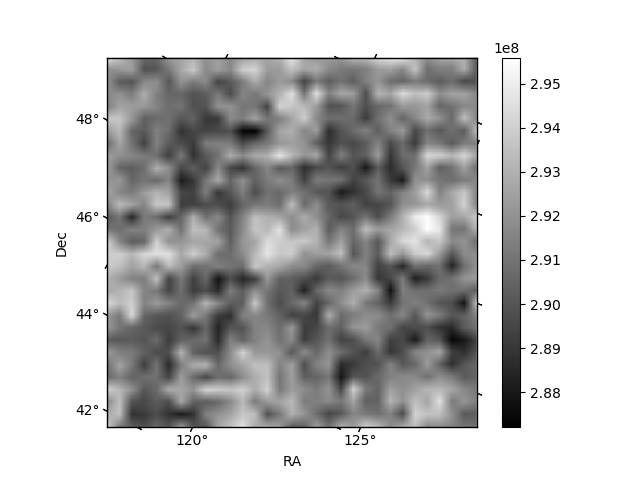
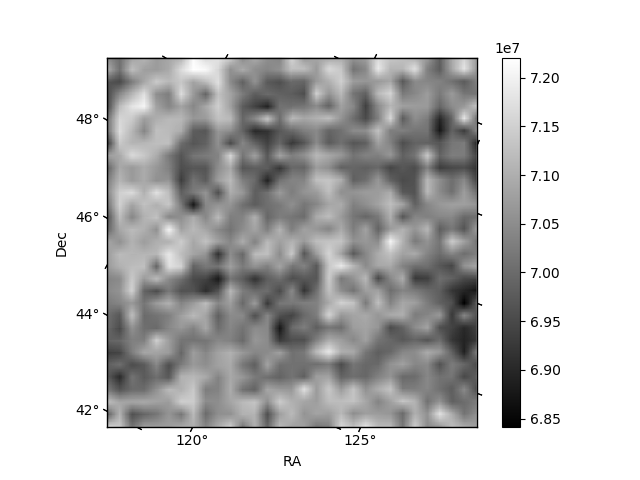
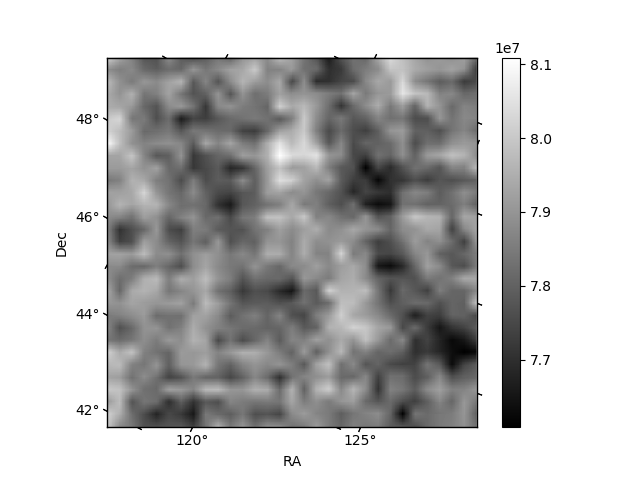
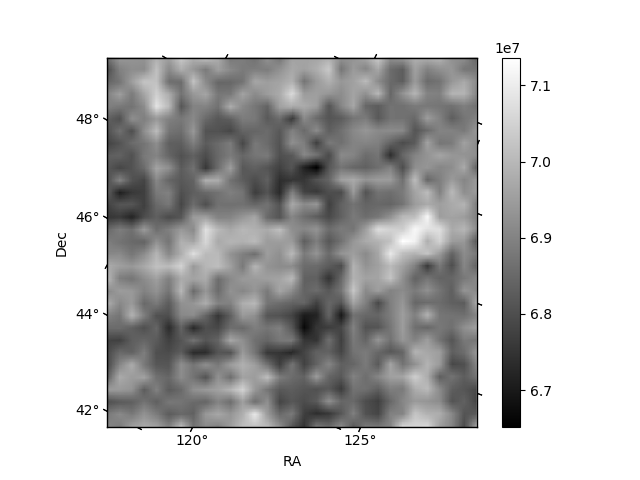
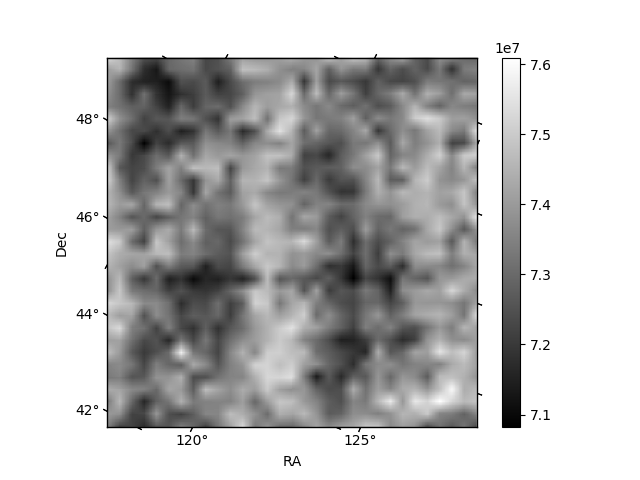
Histogram calculated using DETX and DETY for each event in the final _common_clean file
| Quadrant A | 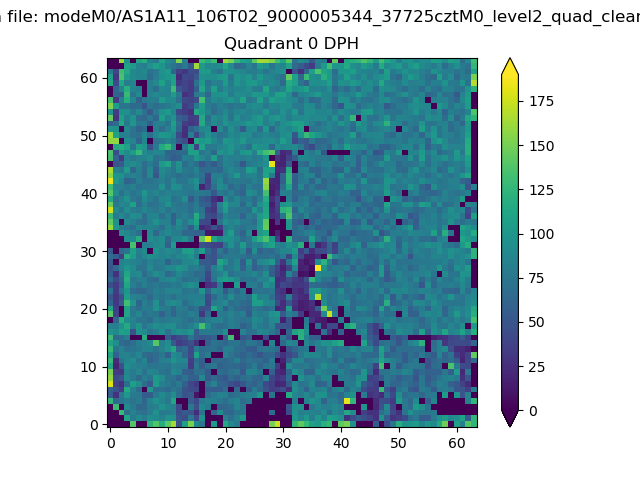 |
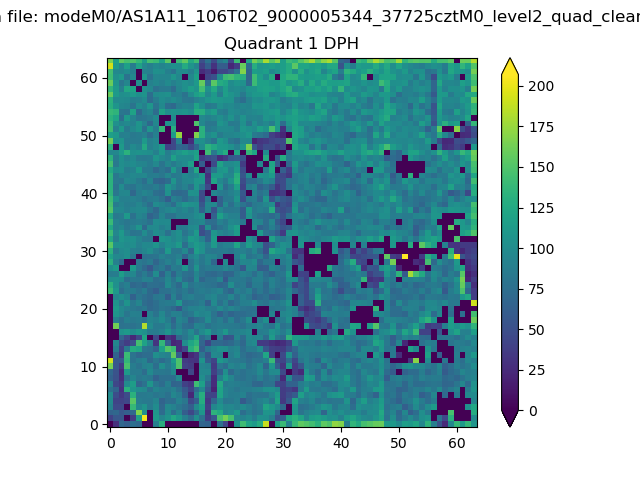 |
Quadrant B |
|---|---|---|---|
| Quadrant D | 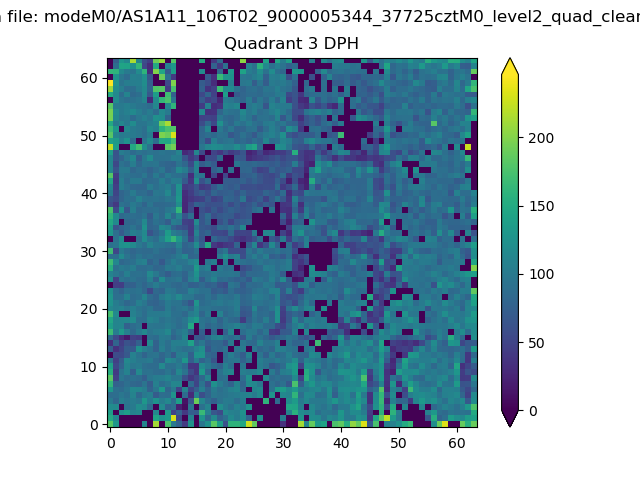 |
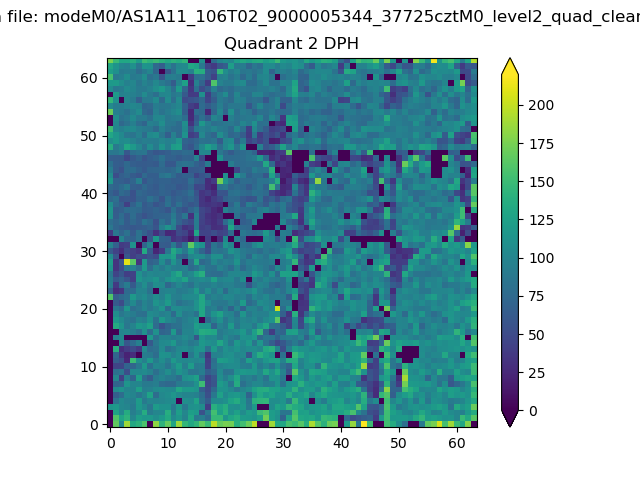 |
Quadrant C |
| Plot type | Count rate plots | Images |
|---|---|---|
| Comparison with Poisson distribution Blue bars denote a histogram of data divided into 1 sec bins. Red curve is a Poisson curve with rate = median count rate of data. |
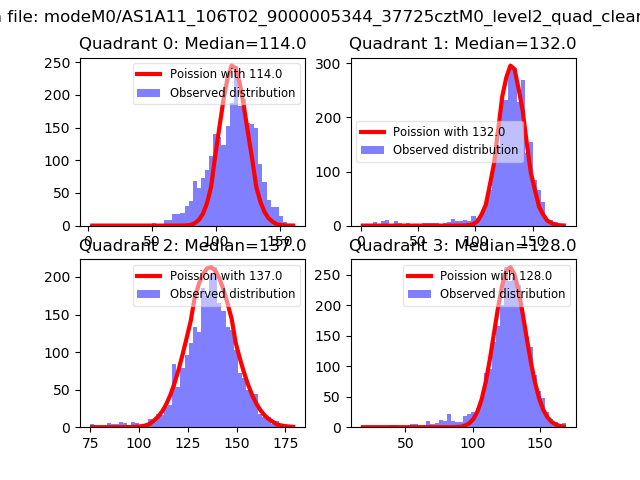 |
 |
| Quadrant-wise count rates Data is divided into 100 sec bins |
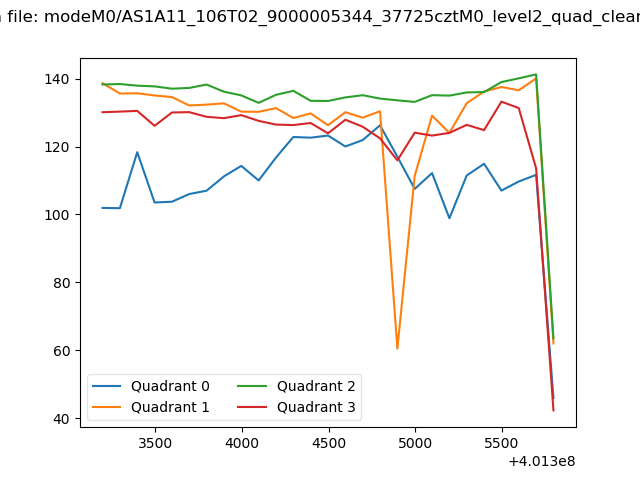 |
|
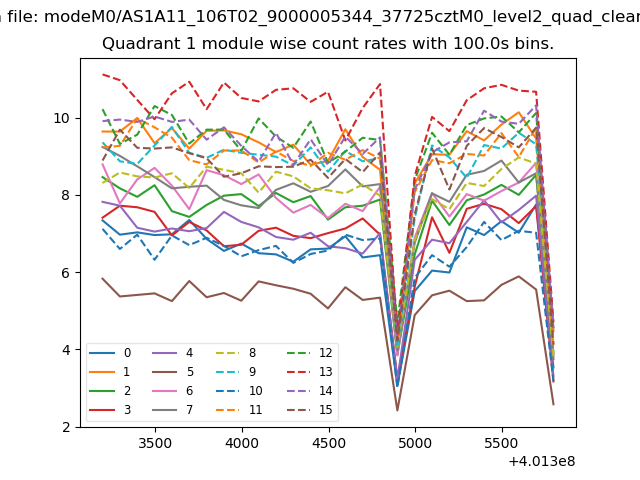
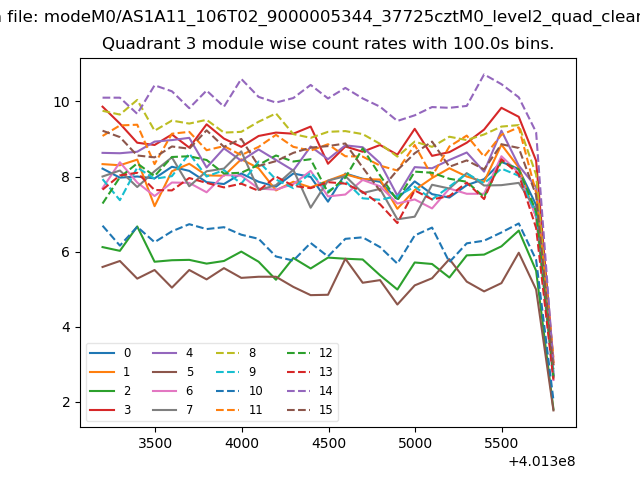
| Module-wise count rates for Quadrant A Data is divided into 100 sec bins |
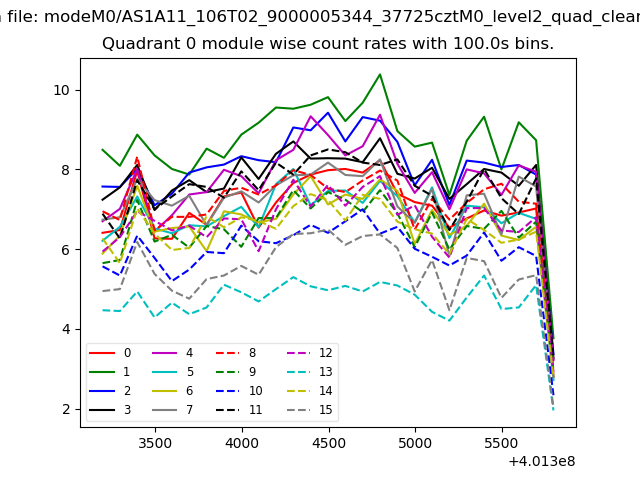 |
 |
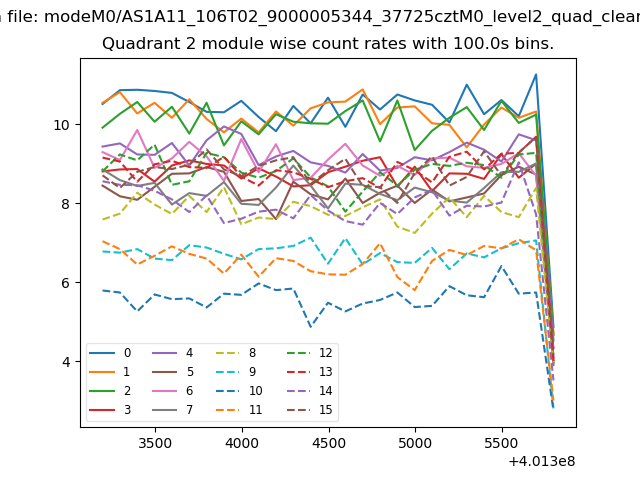
| Module-wise count rates for Quadrant B Data is divided into 100 sec bins |
 |
 |
| Module-wise count rates for Quadrant C Data is divided into 100 sec bins |
 |
 |
| Module-wise count rates for Quadrant D Data is divided into 100 sec bins |
 |
 |
| Parameter | Plot |
|---|---|
| CZT HV Monitor | 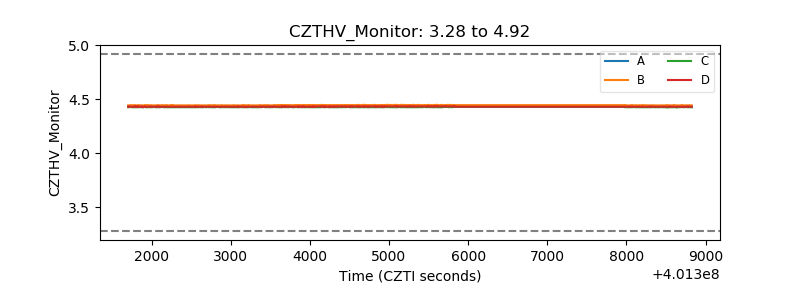 |
| D_VDD | 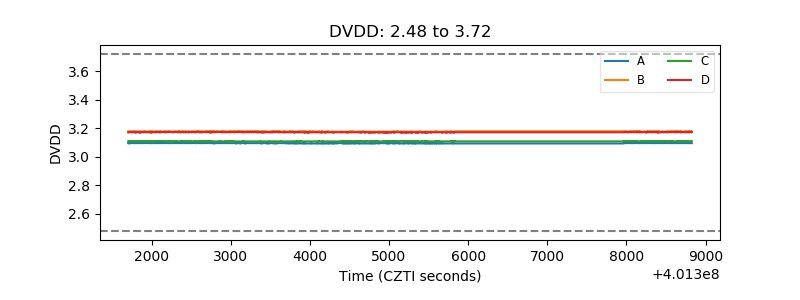 |
| Temperature 1 | 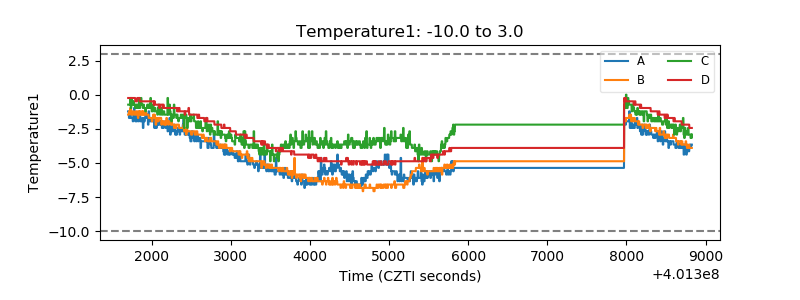 |
| Veto HV Monitor |  |
| Veto LLD | 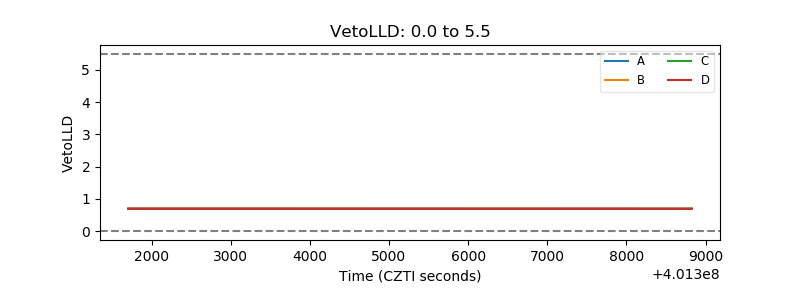 |
| Alpha Counter | 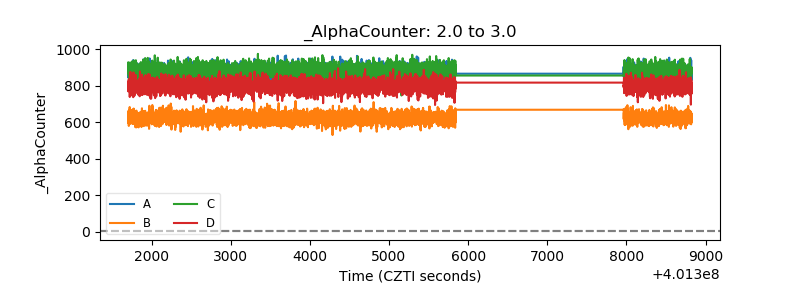 |
| _CPM_Rate | 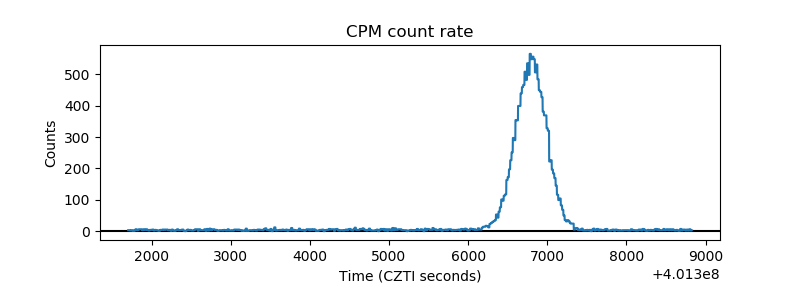 |
| CZT Counter | 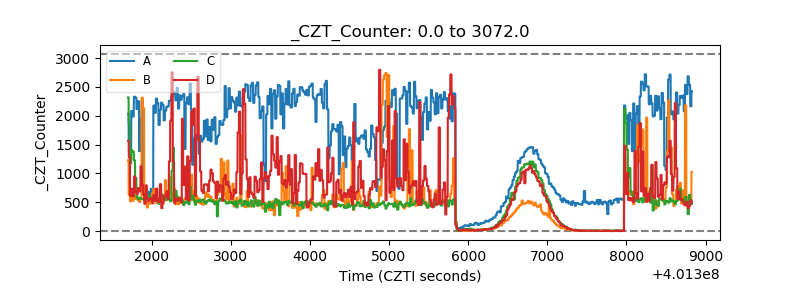 |
| +2.5 Volts monitor | 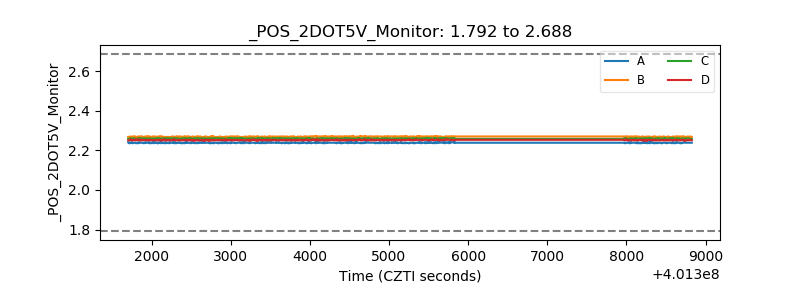 |
| +5 Volts monitor | 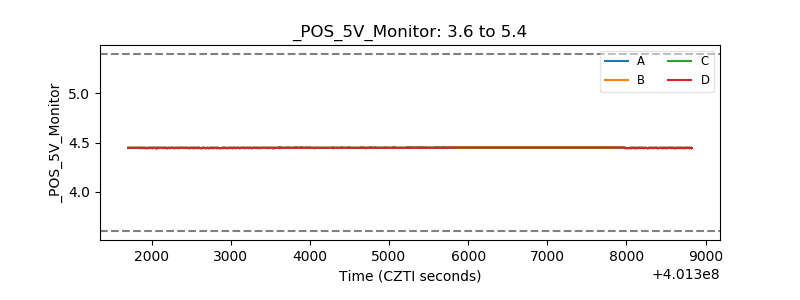 |
| _ROLL_ROT | 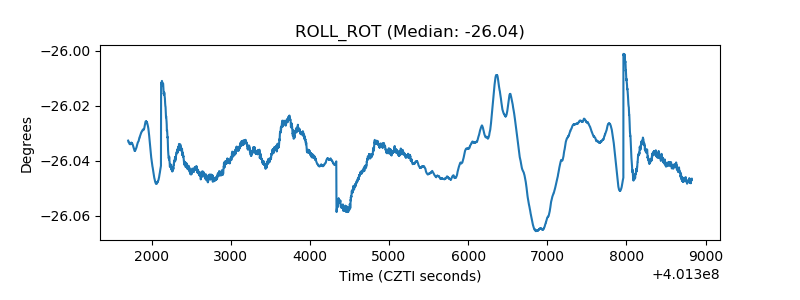 |
| _Roll_DEC | 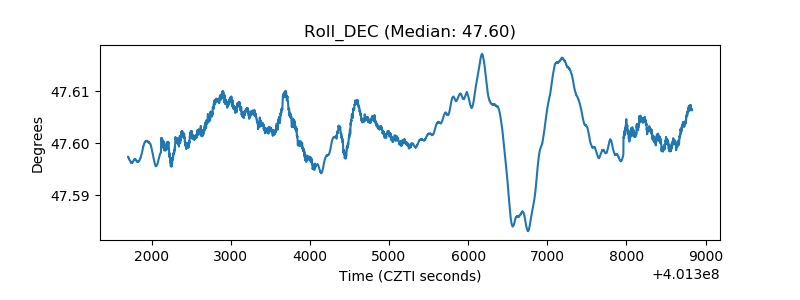 |
| _Roll_RA | 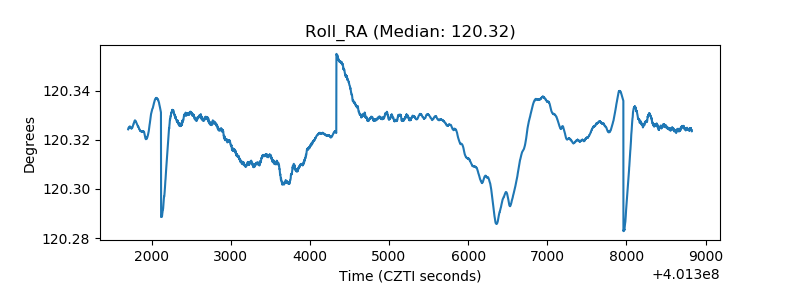 |
| Veto Counter | 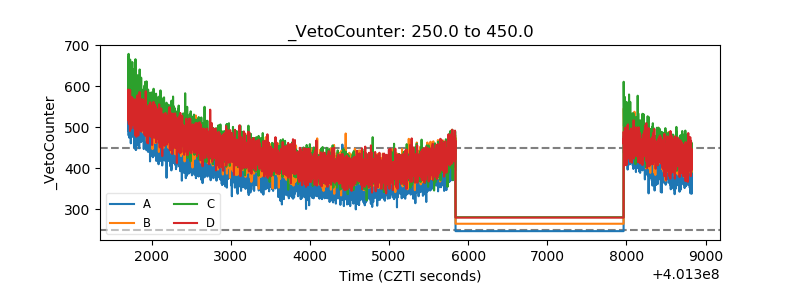 |