| Param | Original file | Final file |
|---|---|---|
| Filename | modeM0/AS1A11_106T02_9000005344_37726cztM0_level2.evt | modeM0/AS1A11_106T02_9000005344_37726cztM0_level2_quad_clean.evt |
| Size (bytes) | 687,165,120 | 66,401,280 |
| Size | 655.3 MB | 63.3 MB |
| Events in quadrant A | 9,541,504 | 376,303 |
| Events in quadrant B | 3,580,806 | 428,343 |
| Events in quadrant C | 2,710,186 | 443,037 |
| Events in quadrant D | 4,632,028 | 402,628 |
| Mode M9 | |||
|---|---|---|---|
| Quadrant | BADHDUFLAG | Total packets | Discarded packets |
| A | 0 | 28 | 0 |
| B | 0 | 28 | 0 |
| C | 0 | 28 | 0 |
| D | 0 | 29 | 0 |
| Mode SS | |||
|---|---|---|---|
| Quadrant | BADHDUFLAG | Total packets | Discarded packets |
| A | 0 | 104 | 0 |
| B | 0 | 104 | 0 |
| C | 0 | 104 | 0 |
| D | 0 | 104 | 0 |
| Mode M0 | |||
|---|---|---|---|
| Quadrant | BADHDUFLAG | Total packets | Discarded packets |
| A | 0 | 31918 | 3 |
| B | 0 | 14124 | 2 |
| C | 0 | 11142 | 2 |
| D | 0 | 17281 | 2 |
| Quadrant | Total seconds | Saturated seconds | Saturation percentage |
|---|---|---|---|
| A | 5132 | 2594 | 50.545596% |
| B | 5132 | 287 | 5.592362% |
| C | 5132 | 60 | 1.169135% |
| D | 5132 | 459 | 8.943882% |
Noise dominated data is calculated using 1-second bins in cleaned event files. If a bin has >2000 counts, and if more than 50% of those come from <1% of pixels, then it is considered to be noise-dominated and hence unusable.
| Quadrant | # 1 sec bins | Bins with >0 counts | Bins with >2000 counts | High rate bins dominated by noise | Noise dominated (total time) | Noise dominated (detector-on time) | Marked lightcurve |
|---|---|---|---|---|---|---|---|
| A | 7076 | 5133 | 2721 | 2721 | 38.45% | 53.01% | 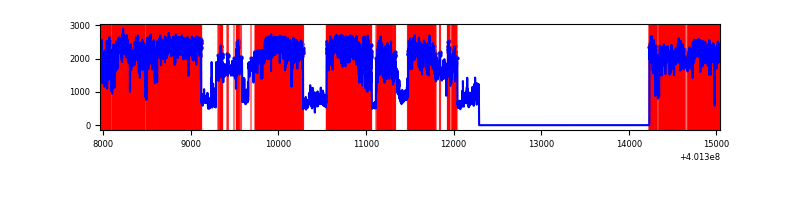 |
| B | 7075 | 5131 | 203 | 203 | 2.87% | 3.96% | 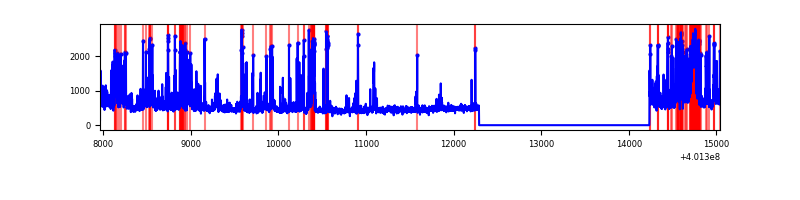 |
| C | 7075 | 5131 | 48 | 48 | 0.68% | 0.94% | 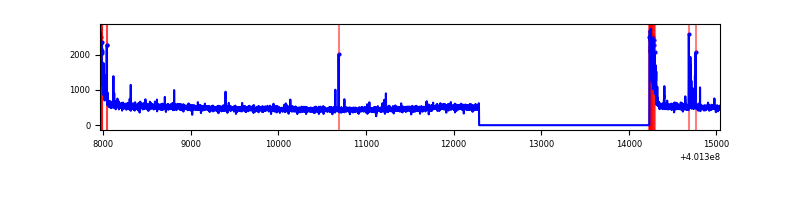 |
| D | 7075 | 5131 | 463 | 463 | 6.54% | 9.02% | 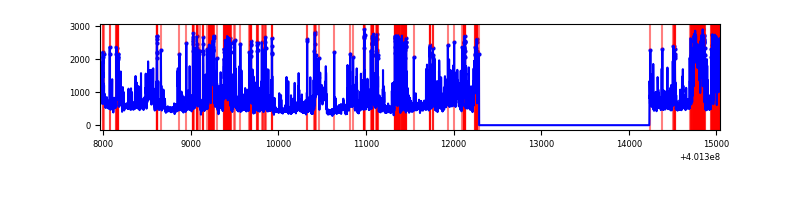 |
Top three noisy pixels from each quadrant. If the there are fewer than three noisy pixels in the level2.evt file, extra rows are filled as -1
| Pixel properties | Quadrant properties | ||||||
|---|---|---|---|---|---|---|---|
| Quadrant | DetID | PixID | Counts | Sigma | Mean | Median | Sigma |
| A | 15 | 222 | 7158994 | 68165.25 | 515 | 505 | 105.0 |
| A | 10 | 83 | 295029 | 2804.54 | 515 | 505 | 105.0 |
| A | 9 | 143 | 33433 | 313.55 | 515 | 505 | 105.0 |
| B | 4 | 171 | 814357 | 7471.95 | 570 | 553 | 108.9 |
| B | 5 | 172 | 152397 | 1394.16 | 570 | 553 | 108.9 |
| B | 4 | 232 | 61987 | 564.06 | 570 | 553 | 108.9 |
| C | 15 | 214 | 217065 | 1628.4 | 574 | 580 | 132.9 |
| C | 0 | 10 | 190034 | 1425.07 | 574 | 580 | 132.9 |
| C | 15 | 208 | 36356 | 269.11 | 574 | 580 | 132.9 |
| D | 12 | 227 | 777475 | 5764.56 | 555 | 540 | 134.8 |
| D | 2 | 249 | 582620 | 4318.81 | 555 | 540 | 134.8 |
| D | 1 | 47 | 387932 | 2874.3 | 555 | 540 | 134.8 |
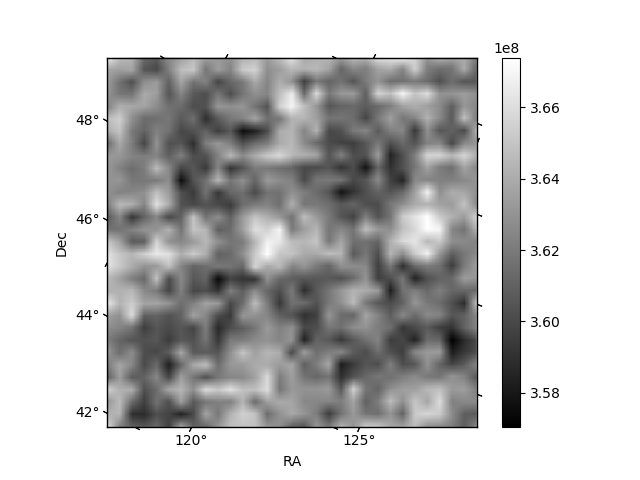
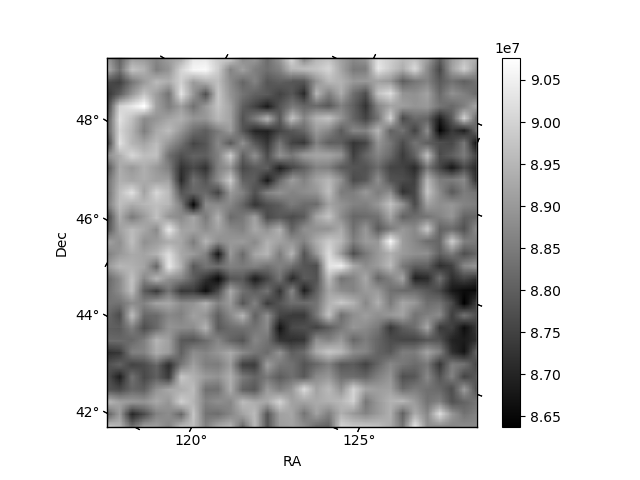
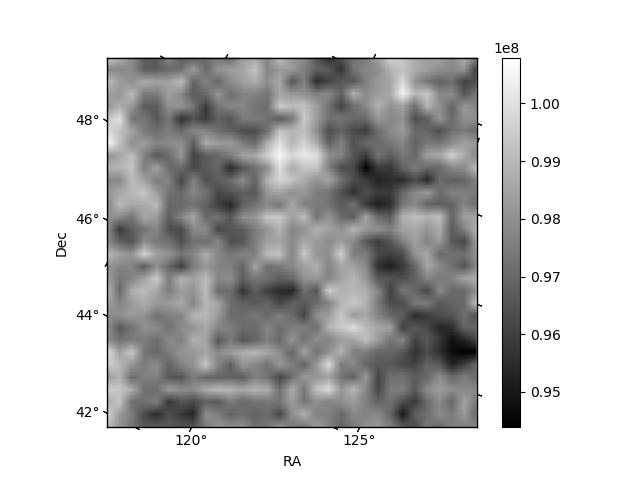
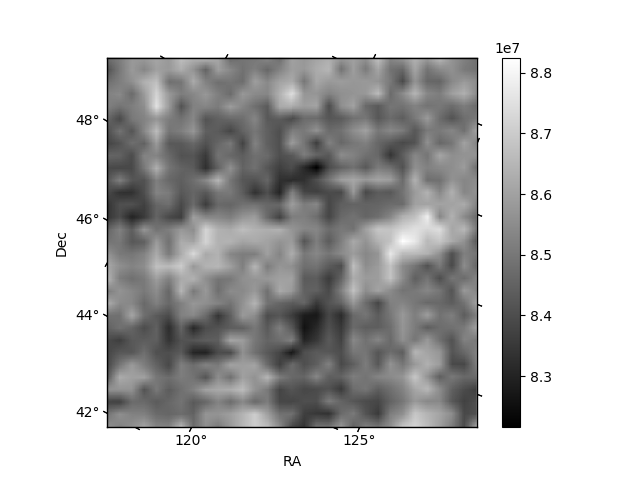
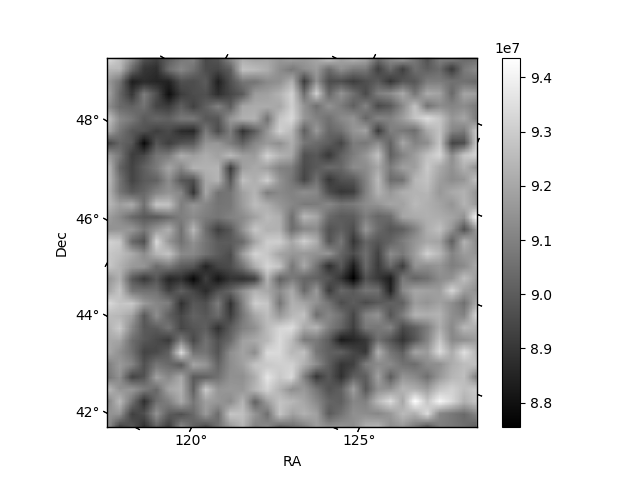
Histogram calculated using DETX and DETY for each event in the final _common_clean file
| Quadrant A | 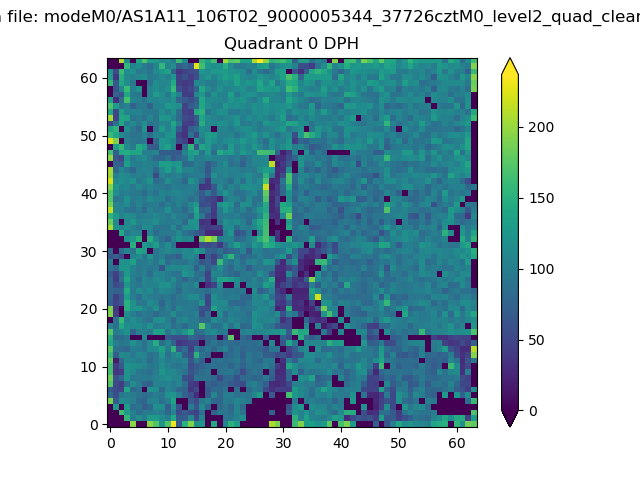 |
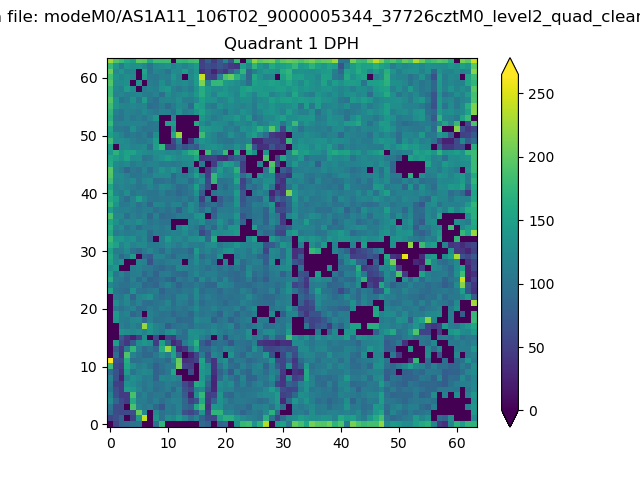 |
Quadrant B |
|---|---|---|---|
| Quadrant D | 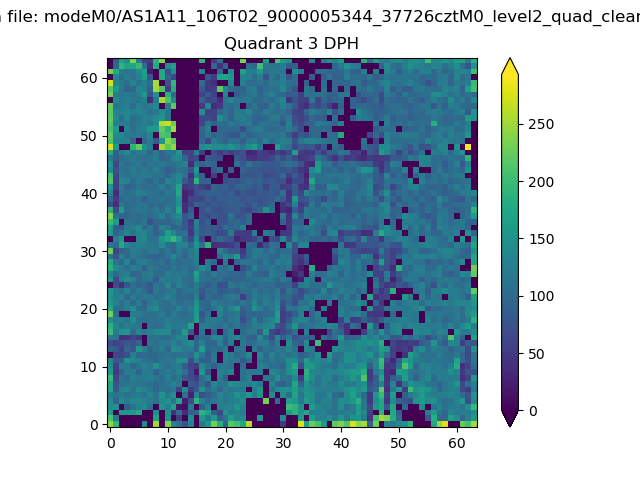 |
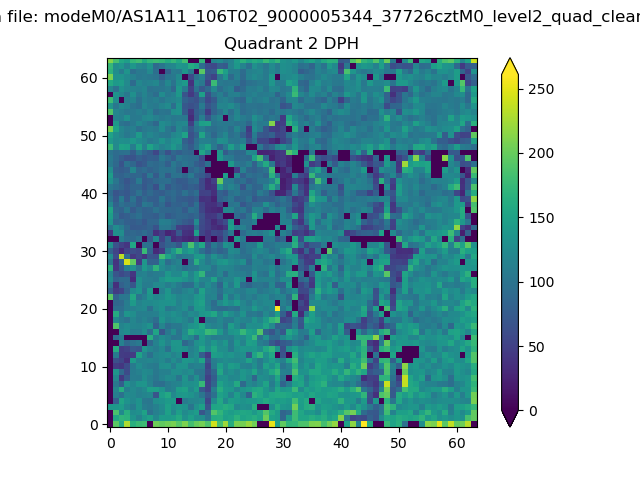 |
Quadrant C |
| Plot type | Count rate plots | Images |
|---|---|---|
| Comparison with Poisson distribution Blue bars denote a histogram of data divided into 1 sec bins. Red curve is a Poisson curve with rate = median count rate of data. |
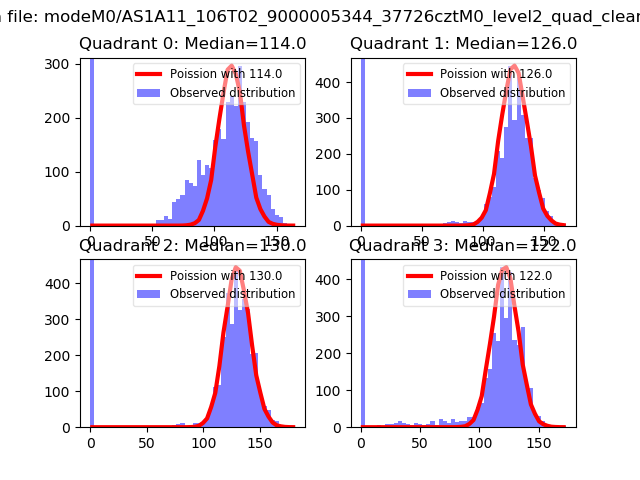 |
 |
| Quadrant-wise count rates Data is divided into 100 sec bins |
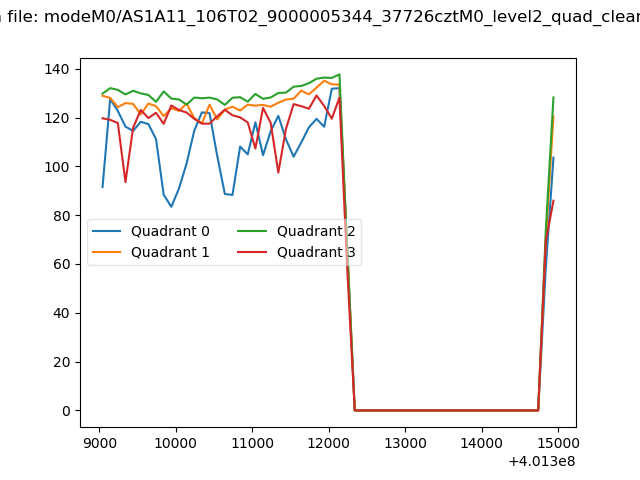 |
|
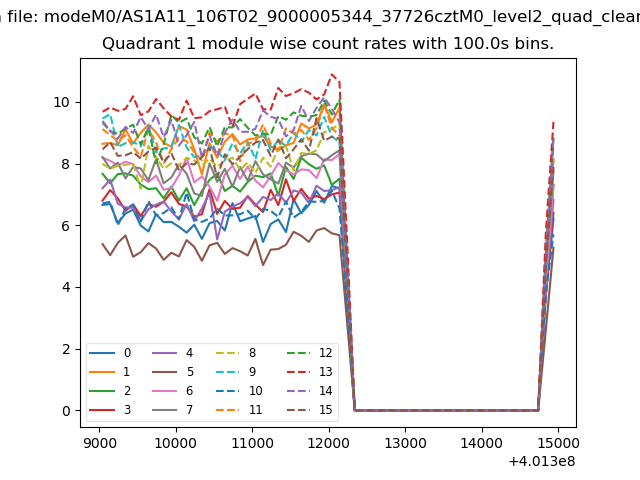
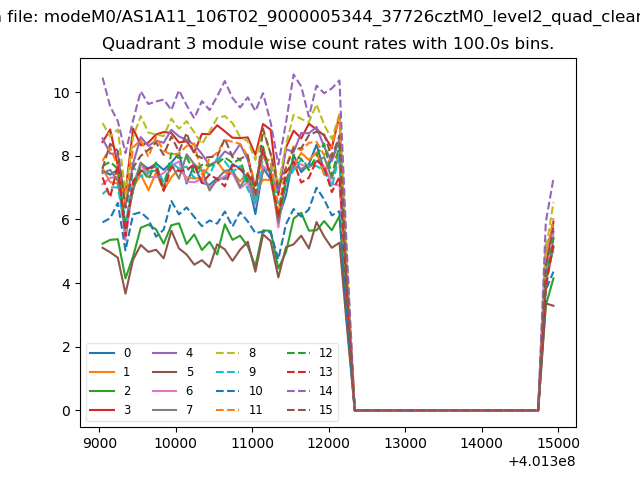
| Module-wise count rates for Quadrant A Data is divided into 100 sec bins |
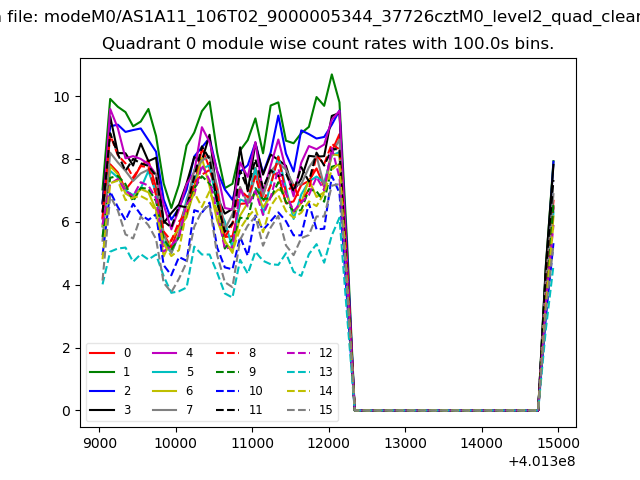 |
 |
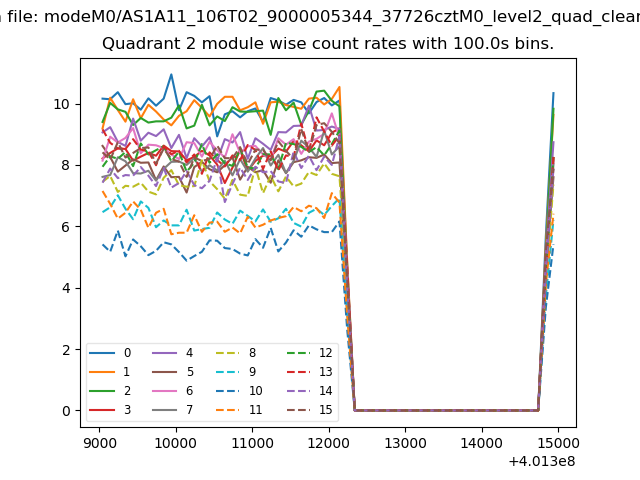
| Module-wise count rates for Quadrant B Data is divided into 100 sec bins |
 |
 |
| Module-wise count rates for Quadrant C Data is divided into 100 sec bins |
 |
 |
| Module-wise count rates for Quadrant D Data is divided into 100 sec bins |
 |
 |
| Parameter | Plot |
|---|---|
| CZT HV Monitor | 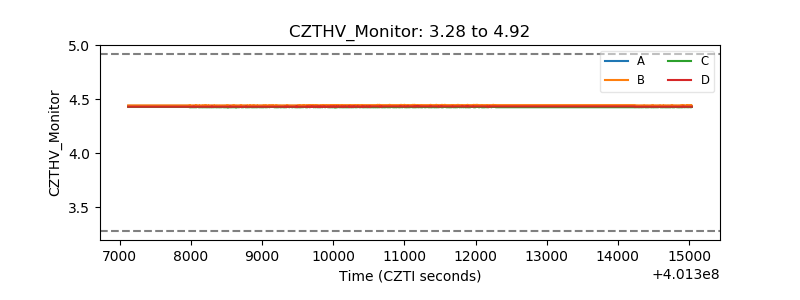 |
| D_VDD | 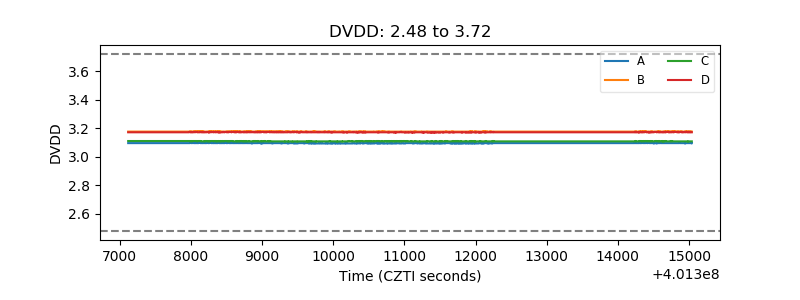 |
| Temperature 1 | 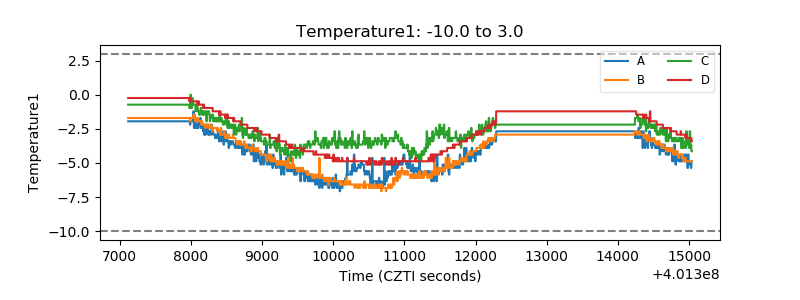 |
| Veto HV Monitor |  |
| Veto LLD | 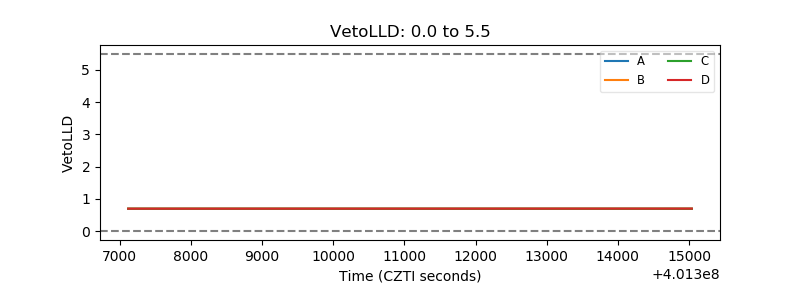 |
| Alpha Counter | 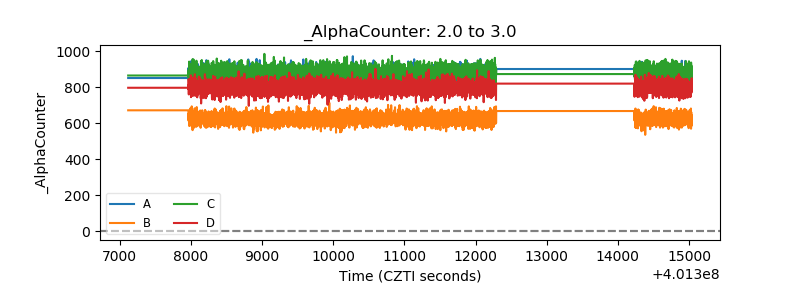 |
| _CPM_Rate | 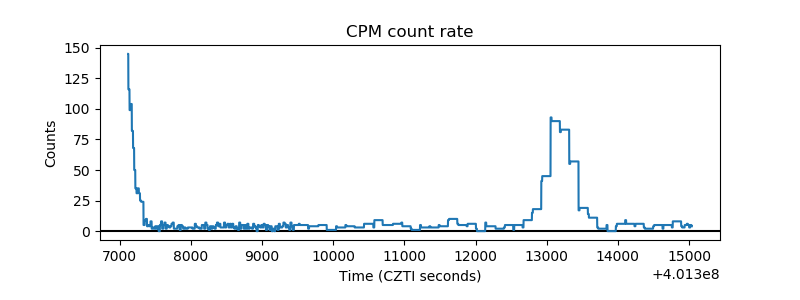 |
| CZT Counter | 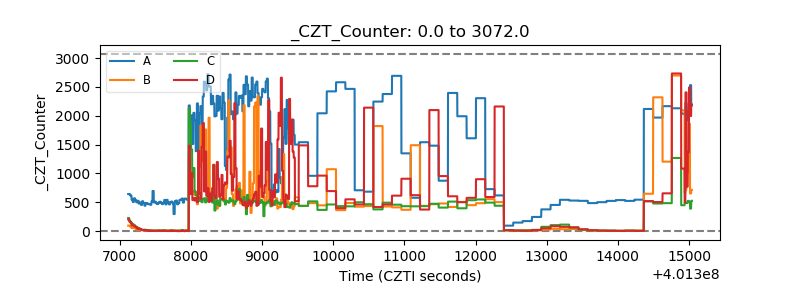 |
| +2.5 Volts monitor | 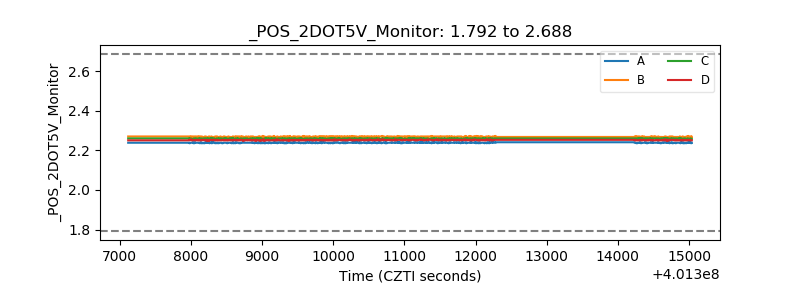 |
| +5 Volts monitor | 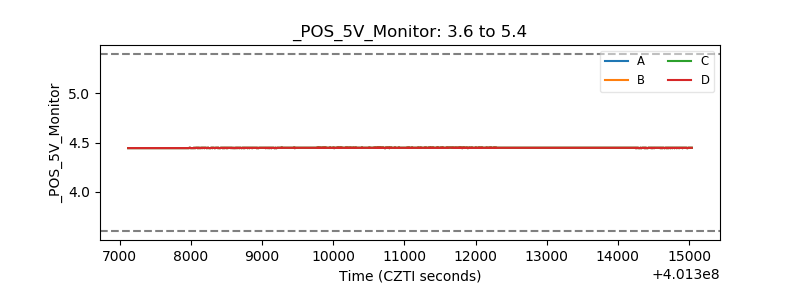 |
| _ROLL_ROT | 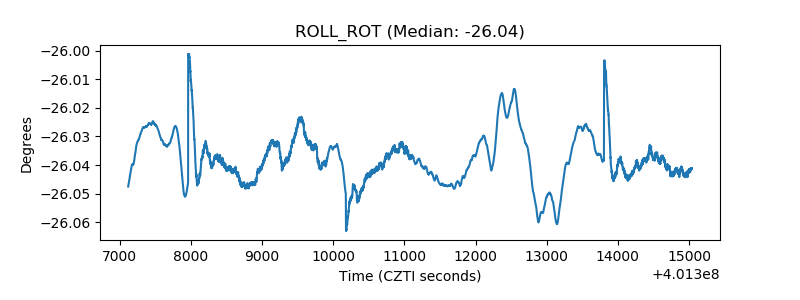 |
| _Roll_DEC | 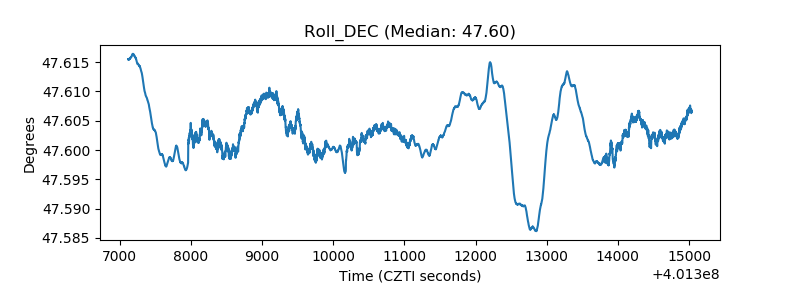 |
| _Roll_RA | 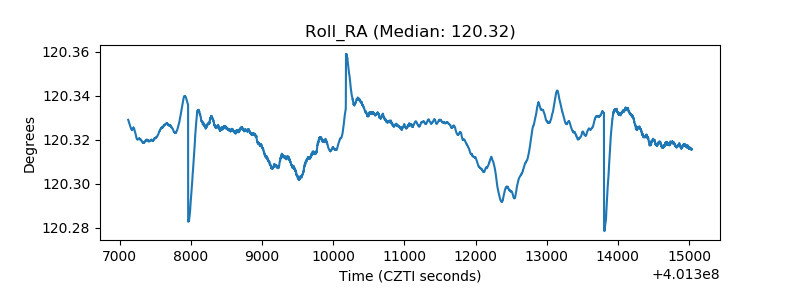 |
| Veto Counter | 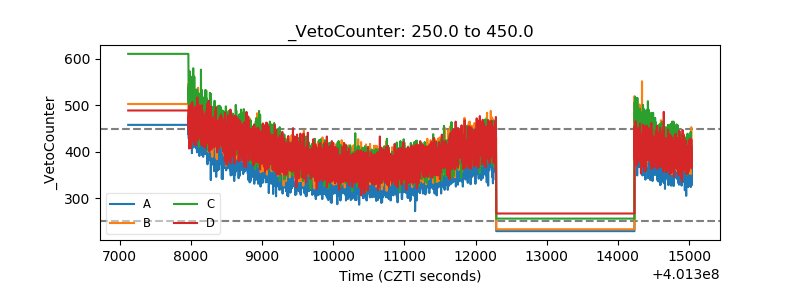 |