| Param | Original file | Final file |
|---|---|---|
| Filename | modeM0/AS1A11_106T02_9000005344_37727cztM0_level2.evt | modeM0/AS1A11_106T02_9000005344_37727cztM0_level2_quad_clean.evt |
| Size (bytes) | 656,922,240 | 83,505,600 |
| Size | 626.5 MB | 79.6 MB |
| Events in quadrant A | 6,690,276 | 528,532 |
| Events in quadrant B | 3,566,525 | 556,549 |
| Events in quadrant C | 2,842,778 | 573,454 |
| Events in quadrant D | 6,429,530 | 490,295 |
| Mode M9 | |||
|---|---|---|---|
| Quadrant | BADHDUFLAG | Total packets | Discarded packets |
| A | 0 | 19 | 0 |
| B | 0 | 19 | 0 |
| C | 0 | 19 | 0 |
| D | 0 | 20 | 0 |
| Mode SS | |||
|---|---|---|---|
| Quadrant | BADHDUFLAG | Total packets | Discarded packets |
| A | 0 | 110 | 0 |
| B | 0 | 110 | 0 |
| C | 0 | 110 | 0 |
| D | 0 | 110 | 0 |
| Mode M0 | |||
|---|---|---|---|
| Quadrant | BADHDUFLAG | Total packets | Discarded packets |
| A | 0 | 23625 | 3 |
| B | 0 | 14324 | 2 |
| C | 0 | 11776 | 2 |
| D | 0 | 22792 | 2 |
| Quadrant | Total seconds | Saturated seconds | Saturation percentage |
|---|---|---|---|
| A | 5419 | 1122 | 20.704927% |
| B | 5419 | 213 | 3.930615% |
| C | 5419 | 72 | 1.328658% |
| D | 5419 | 1064 | 19.634619% |
Noise dominated data is calculated using 1-second bins in cleaned event files. If a bin has >2000 counts, and if more than 50% of those come from <1% of pixels, then it is considered to be noise-dominated and hence unusable.
| Quadrant | # 1 sec bins | Bins with >0 counts | Bins with >2000 counts | High rate bins dominated by noise | Noise dominated (total time) | Noise dominated (detector-on time) | Marked lightcurve |
|---|---|---|---|---|---|---|---|
| A | 7032 | 5420 | 1024 | 1024 | 14.56% | 18.89% | 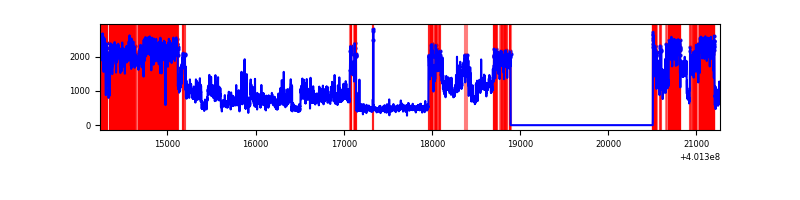 |
| B | 7031 | 5418 | 162 | 162 | 2.30% | 2.99% | 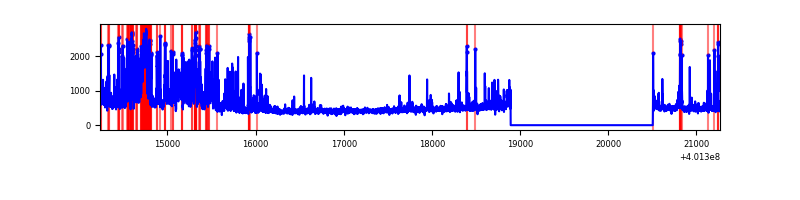 |
| C | 7031 | 5418 | 61 | 61 | 0.87% | 1.13% | 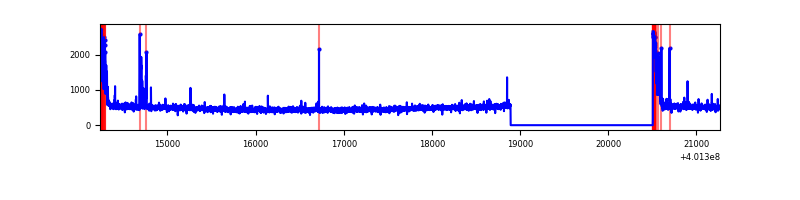 |
| D | 7031 | 5418 | 1241 | 1241 | 17.65% | 22.91% | 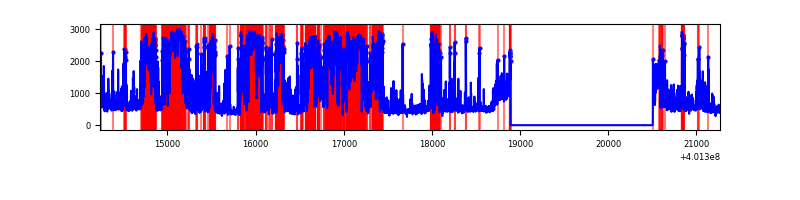 |
Top three noisy pixels from each quadrant. If the there are fewer than three noisy pixels in the level2.evt file, extra rows are filled as -1
| Pixel properties | Quadrant properties | ||||||
|---|---|---|---|---|---|---|---|
| Quadrant | DetID | PixID | Counts | Sigma | Mean | Median | Sigma |
| A | 15 | 222 | 4035661 | 34723.6 | 576 | 565 | 116.2 |
| A | 10 | 83 | 309832 | 2661.36 | 576 | 565 | 116.2 |
| A | 7 | 16 | 44503 | 378.1 | 576 | 565 | 116.2 |
| B | 4 | 171 | 830209 | 7324.44 | 591 | 575 | 113.3 |
| B | 5 | 172 | 145952 | 1283.46 | 591 | 575 | 113.3 |
| B | 4 | 81 | 47891 | 417.73 | 591 | 575 | 113.3 |
| C | 15 | 214 | 229205 | 1665.67 | 591 | 595 | 137.2 |
| C | 0 | 10 | 220422 | 1601.67 | 591 | 595 | 137.2 |
| C | 15 | 208 | 37436 | 268.43 | 591 | 595 | 137.2 |
| D | 12 | 227 | 2880500 | 21535.7 | 550 | 534 | 133.7 |
| D | 2 | 249 | 666304 | 4978.47 | 550 | 534 | 133.7 |
| D | 1 | 47 | 211235 | 1575.57 | 550 | 534 | 133.7 |
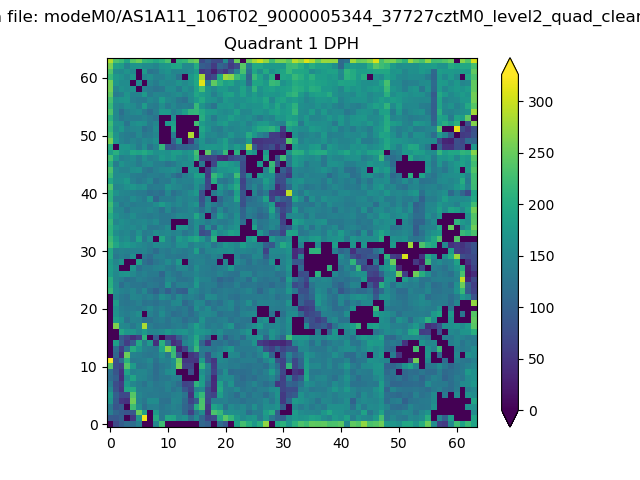
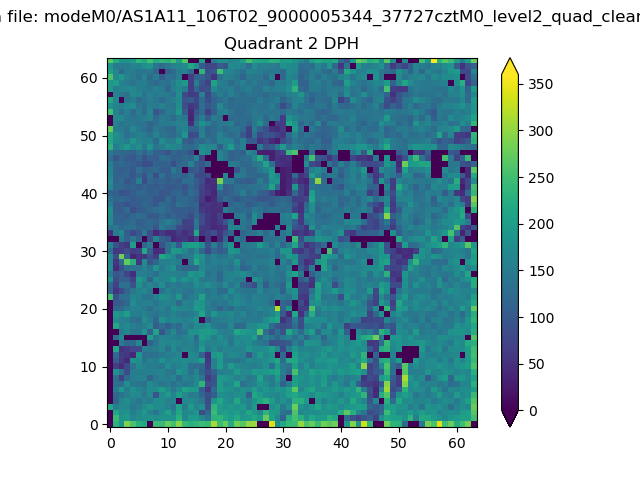
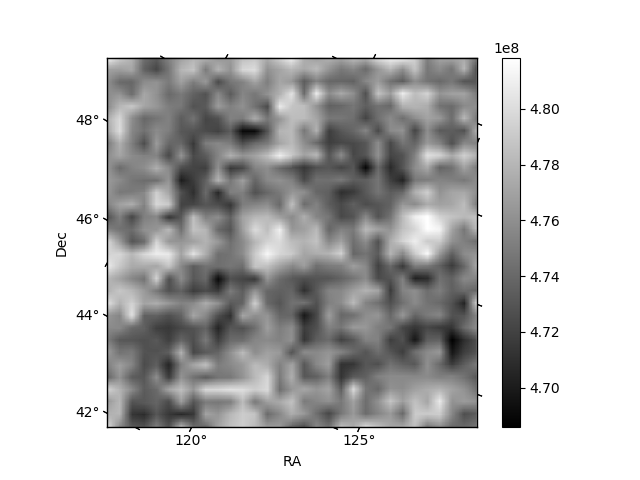
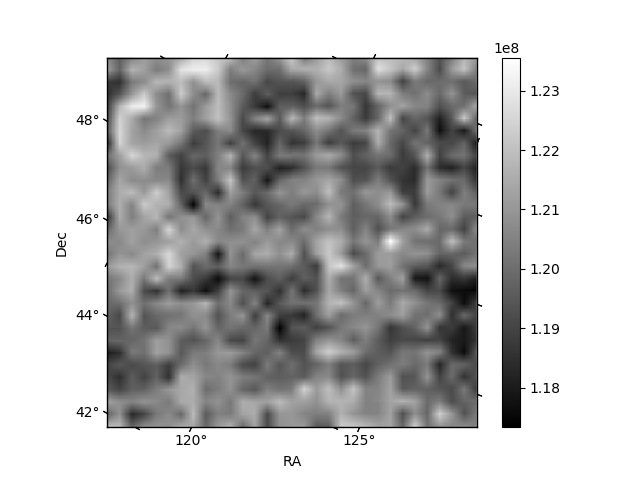
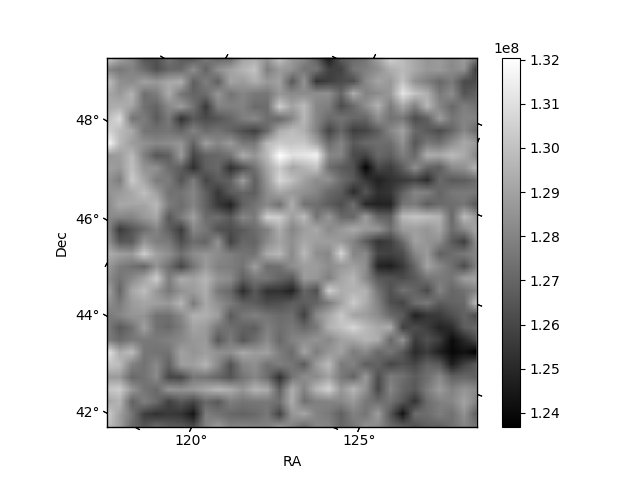
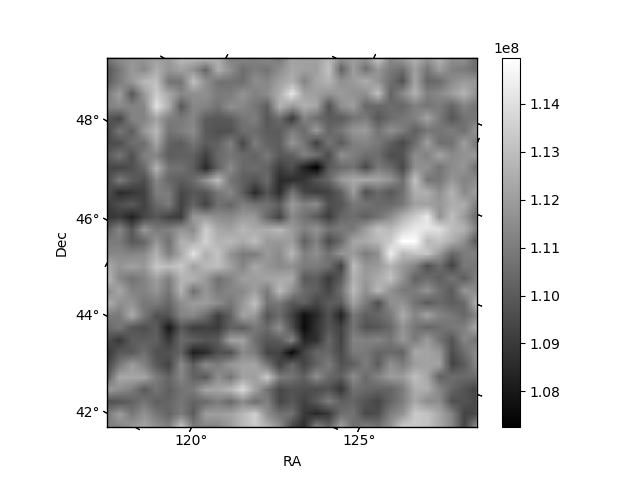
Histogram calculated using DETX and DETY for each event in the final _common_clean file
| Quadrant A |  |
 |
Quadrant B |
|---|---|---|---|
| Quadrant D | 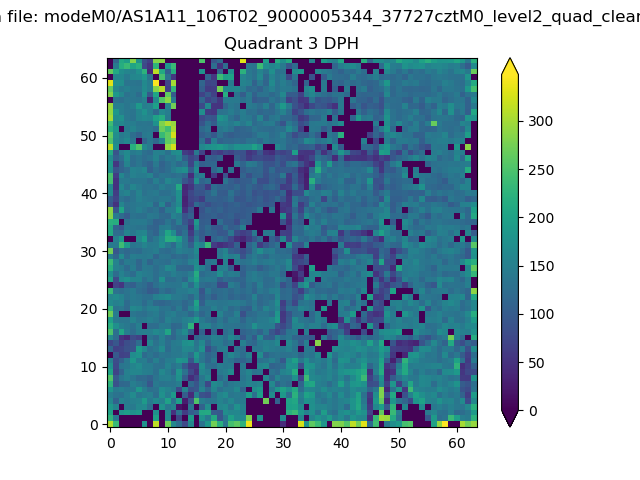 |
 |
Quadrant C |
| Plot type | Count rate plots | Images |
|---|---|---|
| Comparison with Poisson distribution Blue bars denote a histogram of data divided into 1 sec bins. Red curve is a Poisson curve with rate = median count rate of data. |
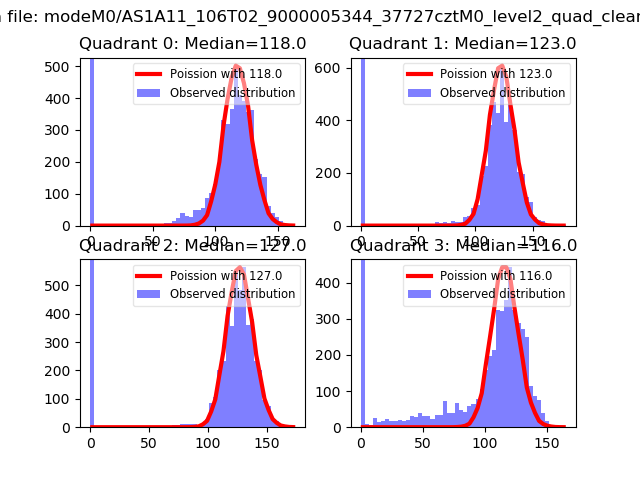 |
 |
| Quadrant-wise count rates Data is divided into 100 sec bins |
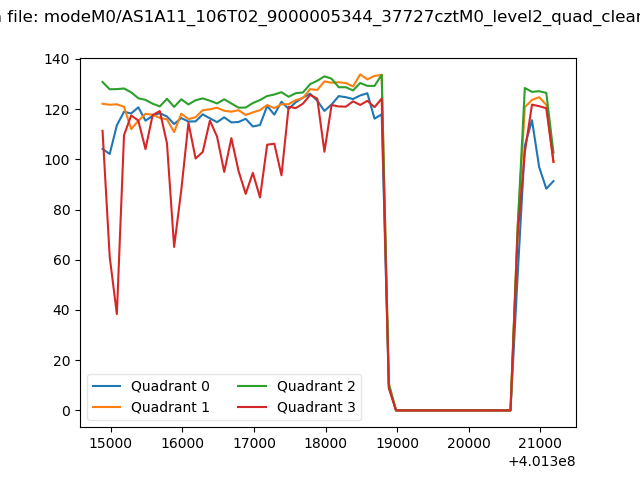 |
|
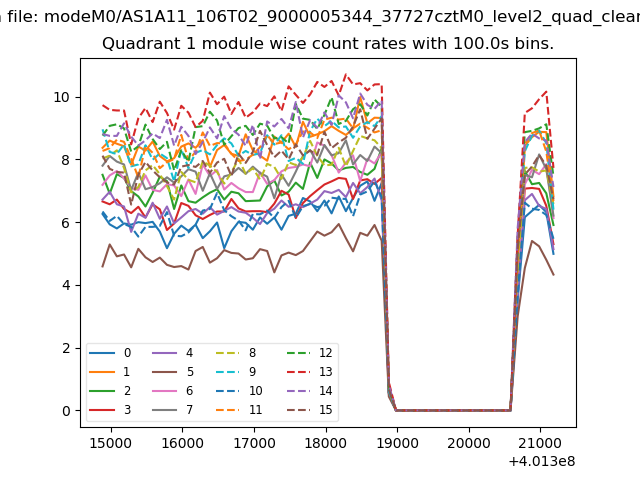
| Module-wise count rates for Quadrant A Data is divided into 100 sec bins |
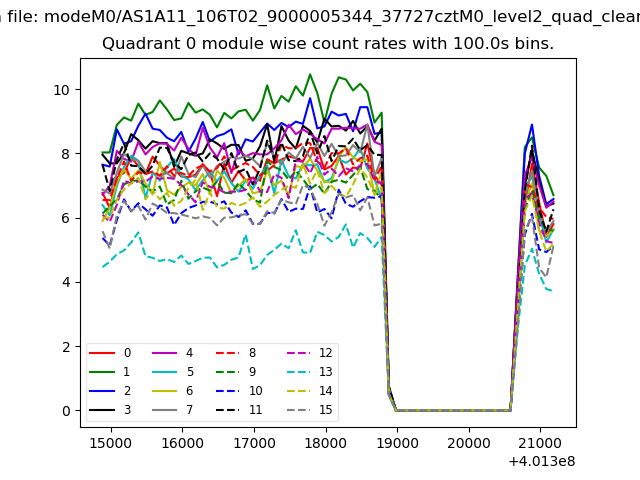 |
 |
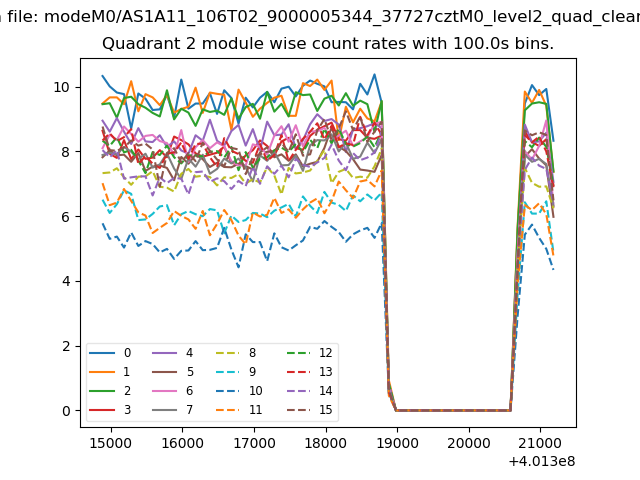
| Module-wise count rates for Quadrant B Data is divided into 100 sec bins |
 |
 |
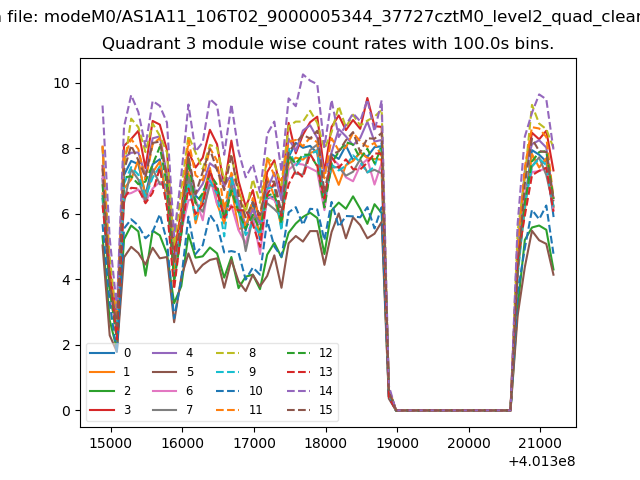
| Module-wise count rates for Quadrant C Data is divided into 100 sec bins |
 |
 |
| Module-wise count rates for Quadrant D Data is divided into 100 sec bins |
 |
 |
| Parameter | Plot |
|---|---|
| CZT HV Monitor |  |
| D_VDD | 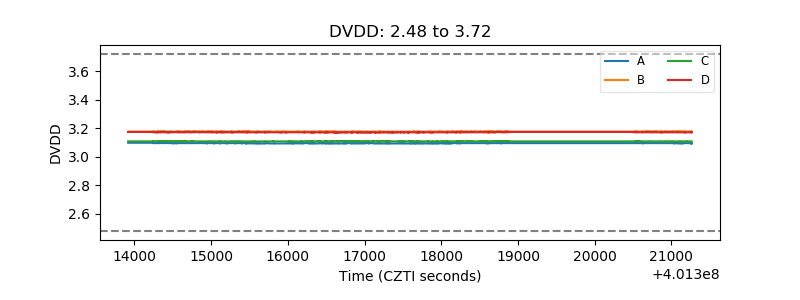 |
| Temperature 1 | 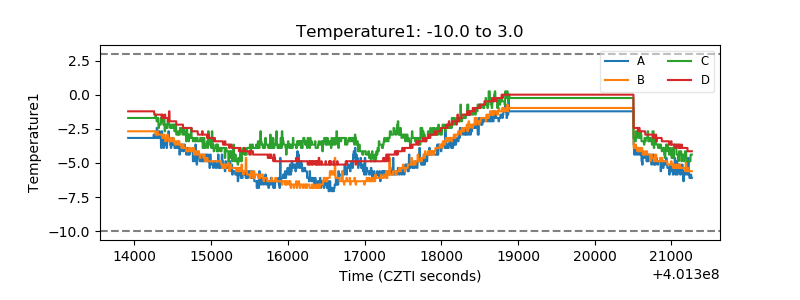 |
| Veto HV Monitor | 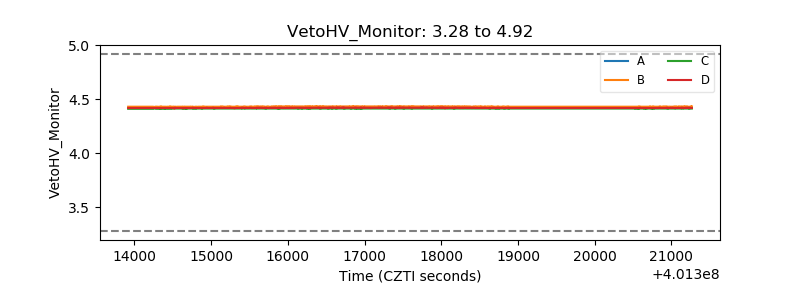 |
| Veto LLD | 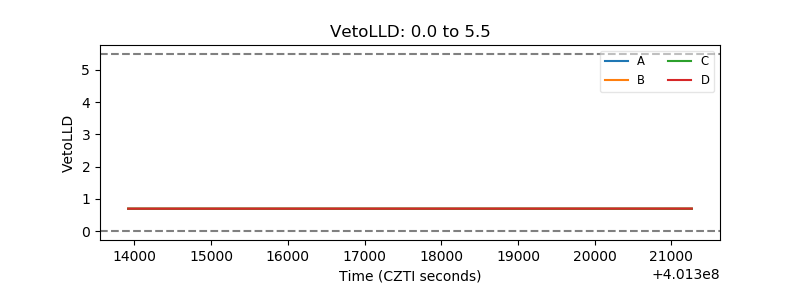 |
| Alpha Counter | 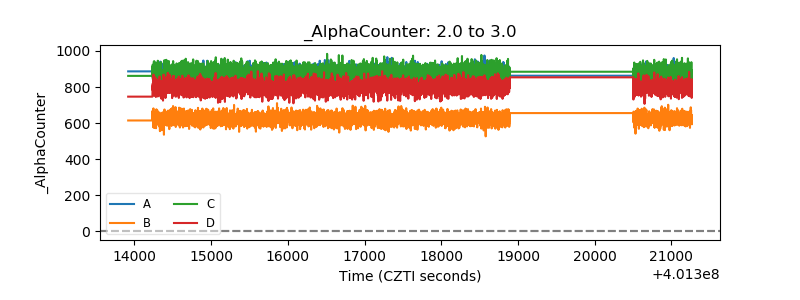 |
| _CPM_Rate | 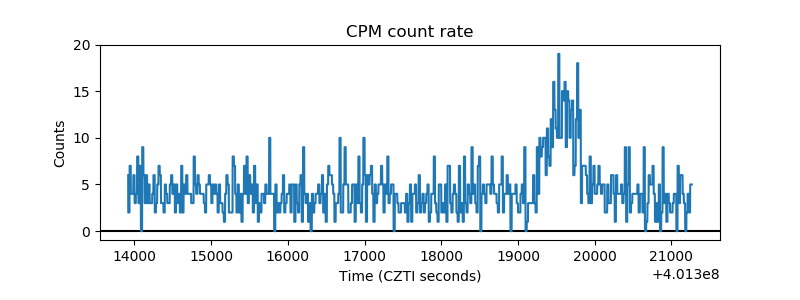 |
| CZT Counter | 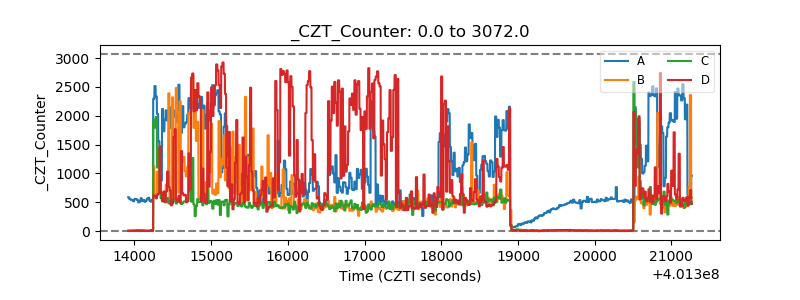 |
| +2.5 Volts monitor | 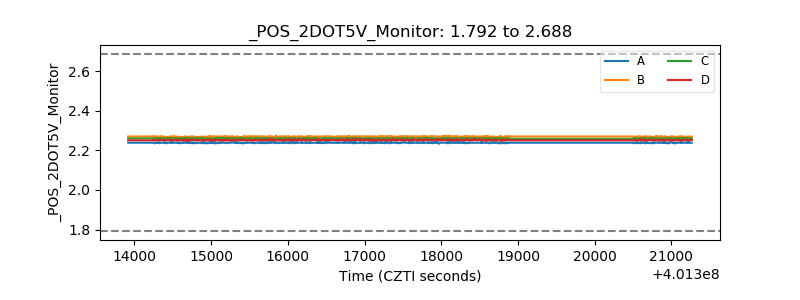 |
| +5 Volts monitor | 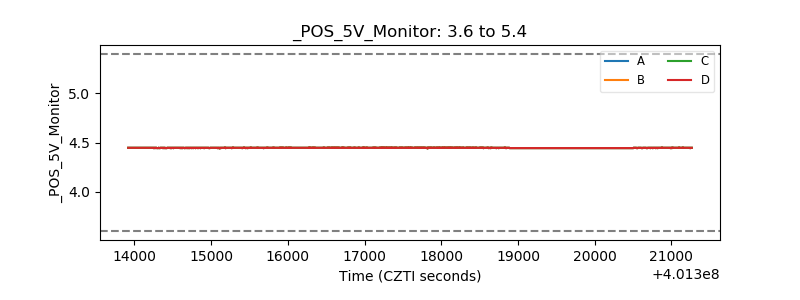 |
| _ROLL_ROT | 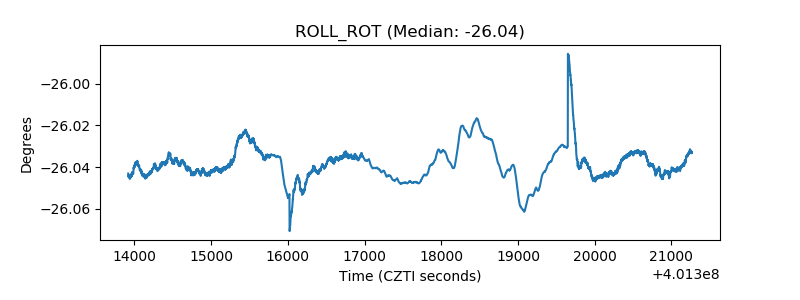 |
| _Roll_DEC | 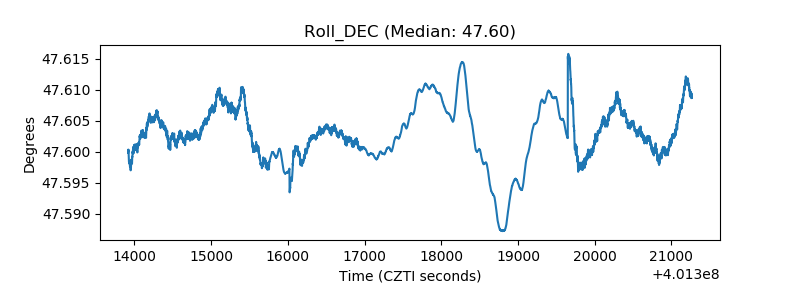 |
| _Roll_RA | 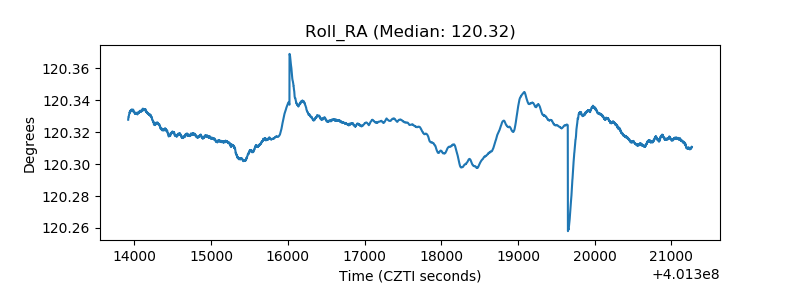 |
| Veto Counter | 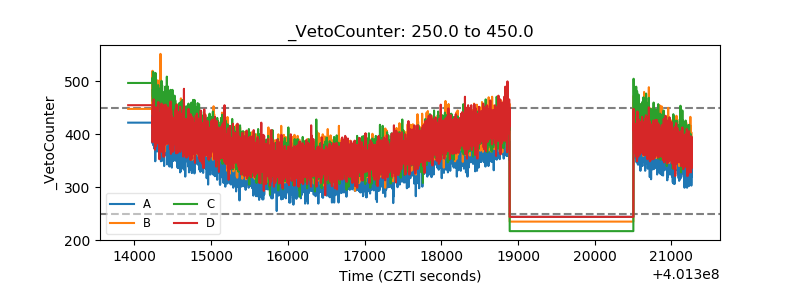 |