| Param | Original file | Final file |
|---|---|---|
| Filename | modeM0/AS1A11_106T02_9000005344_37729cztM0_level2.evt | modeM0/AS1A11_106T02_9000005344_37729cztM0_level2_quad_clean.evt |
| Size (bytes) | 753,171,840 | 85,029,120 |
| Size | 718.3 MB | 81.1 MB |
| Events in quadrant A | 8,883,042 | 506,176 |
| Events in quadrant B | 3,155,767 | 572,908 |
| Events in quadrant C | 2,916,727 | 584,425 |
| Events in quadrant D | 7,450,707 | 492,484 |
| Mode M9 | |||
|---|---|---|---|
| Quadrant | BADHDUFLAG | Total packets | Discarded packets |
| A | 0 | 23 | 0 |
| B | 0 | 23 | 0 |
| C | 0 | 23 | 0 |
| D | 0 | 24 | 0 |
| Mode SS | |||
|---|---|---|---|
| Quadrant | BADHDUFLAG | Total packets | Discarded packets |
| A | 0 | 122 | 0 |
| B | 0 | 122 | 0 |
| C | 0 | 122 | 0 |
| D | 0 | 122 | 0 |
| Mode M0 | |||
|---|---|---|---|
| Quadrant | BADHDUFLAG | Total packets | Discarded packets |
| A | 0 | 30398 | 3 |
| B | 0 | 13561 | 2 |
| C | 0 | 12539 | 2 |
| D | 0 | 26379 | 2 |
| Quadrant | Total seconds | Saturated seconds | Saturation percentage |
|---|---|---|---|
| A | 5977 | 2431 | 40.672578% |
| B | 5977 | 97 | 1.622888% |
| C | 5977 | 22 | 0.368078% |
| D | 5977 | 1233 | 20.629078% |
Noise dominated data is calculated using 1-second bins in cleaned event files. If a bin has >2000 counts, and if more than 50% of those come from <1% of pixels, then it is considered to be noise-dominated and hence unusable.
| Quadrant | # 1 sec bins | Bins with >0 counts | Bins with >2000 counts | High rate bins dominated by noise | Noise dominated (total time) | Noise dominated (detector-on time) | Marked lightcurve |
|---|---|---|---|---|---|---|---|
| A | 7289 | 5976 | 2304 | 2304 | 31.61% | 38.55% | 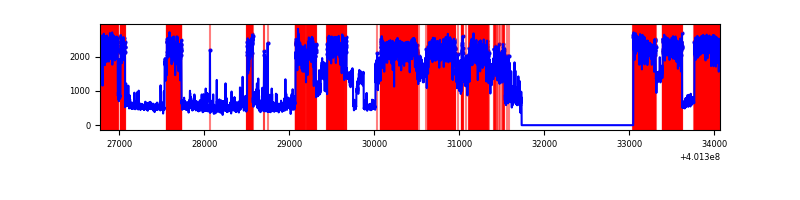 |
| B | 7289 | 5976 | 66 | 66 | 0.91% | 1.10% | 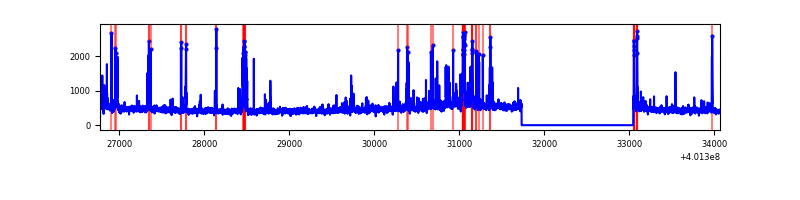 |
| C | 7289 | 5976 | 16 | 16 | 0.22% | 0.27% | 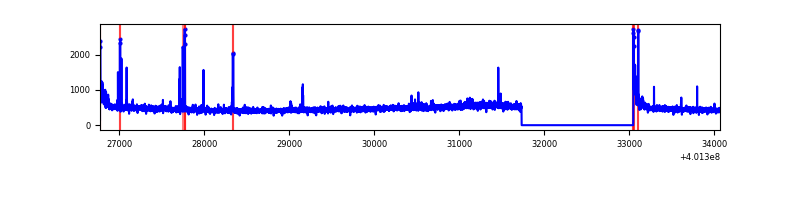 |
| D | 7289 | 5976 | 1321 | 1321 | 18.12% | 22.11% | 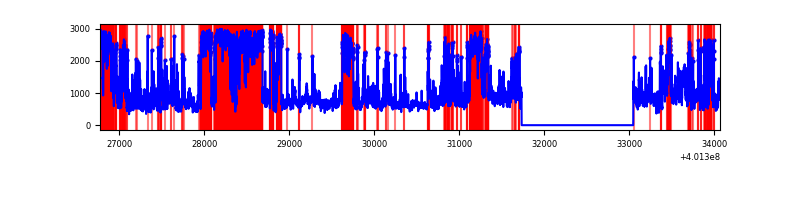 |
Top three noisy pixels from each quadrant. If the there are fewer than three noisy pixels in the level2.evt file, extra rows are filled as -1
| Pixel properties | Quadrant properties | ||||||
|---|---|---|---|---|---|---|---|
| Quadrant | DetID | PixID | Counts | Sigma | Mean | Median | Sigma |
| A | 15 | 222 | 6187590 | 51164.15 | 596 | 585 | 120.9 |
| A | 10 | 83 | 310324 | 2561.42 | 596 | 585 | 120.9 |
| A | 9 | 143 | 57968 | 474.54 | 596 | 585 | 120.9 |
| B | 5 | 172 | 181456 | 1447.97 | 649 | 631 | 124.9 |
| B | 5 | 255 | 139575 | 1112.61 | 649 | 631 | 124.9 |
| B | 5 | 200 | 78548 | 623.93 | 649 | 631 | 124.9 |
| C | 15 | 214 | 251587 | 1670.24 | 643 | 646 | 150.2 |
| C | 0 | 10 | 71730 | 473.13 | 643 | 646 | 150.2 |
| C | 0 | 207 | 32076 | 209.19 | 643 | 646 | 150.2 |
| D | 12 | 227 | 3750479 | 25953.91 | 587 | 569 | 144.5 |
| D | 2 | 249 | 523381 | 3618.49 | 587 | 569 | 144.5 |
| D | 1 | 47 | 289991 | 2003.15 | 587 | 569 | 144.5 |
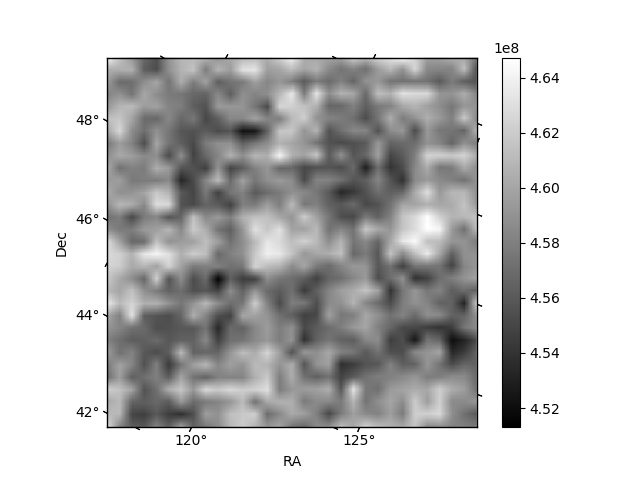
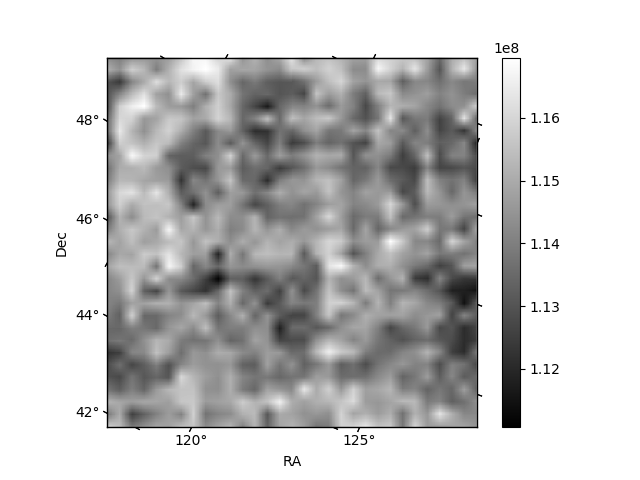
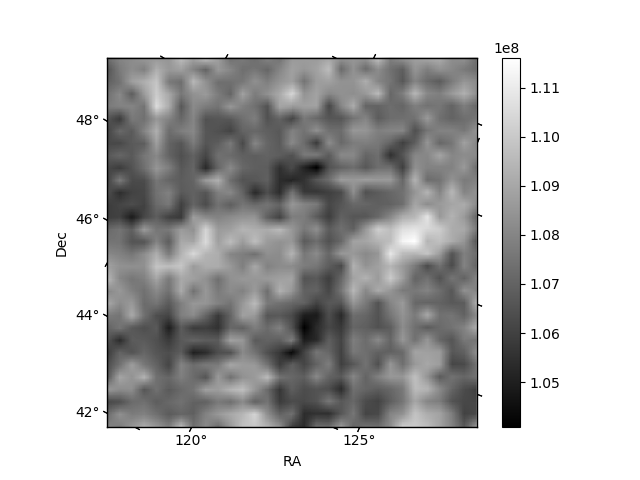
Histogram calculated using DETX and DETY for each event in the final _common_clean file
| Quadrant A | 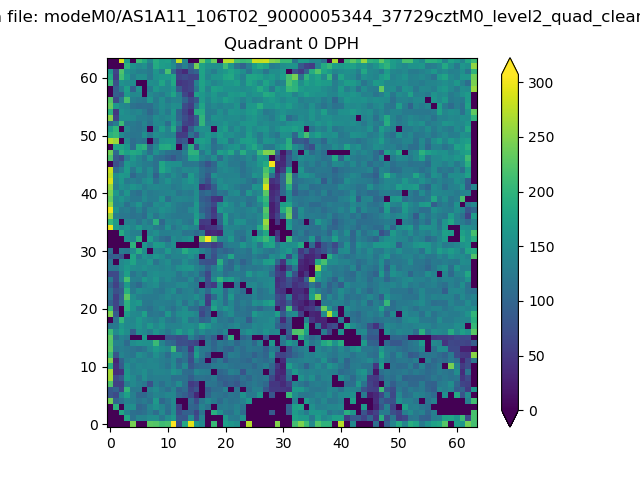 |
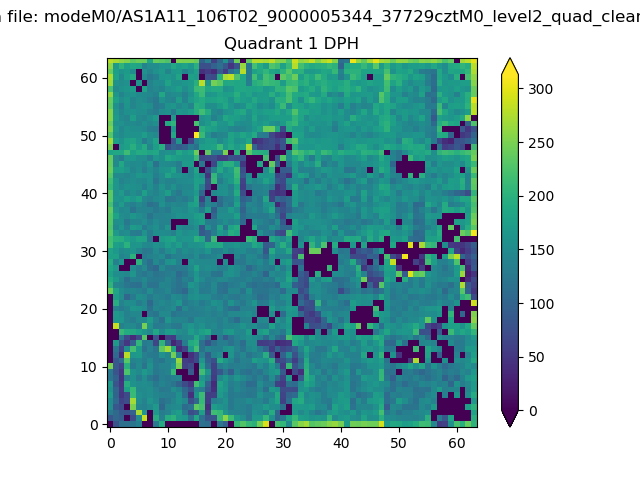 |
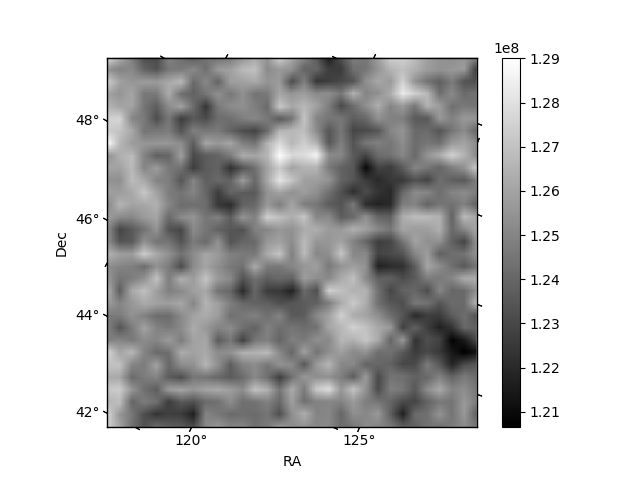
Quadrant B |
|---|---|---|---|
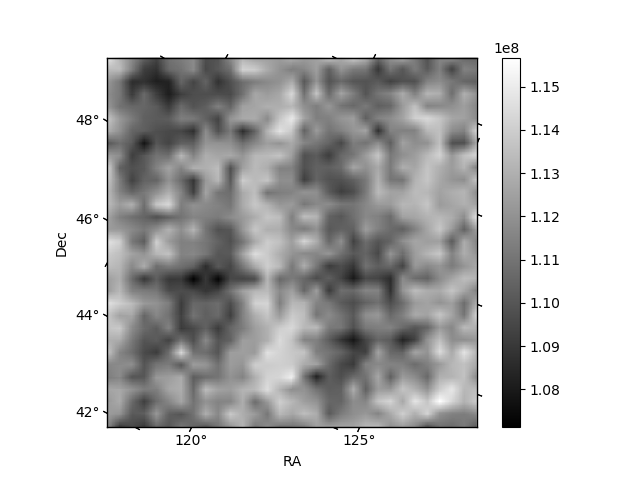
| Quadrant D | 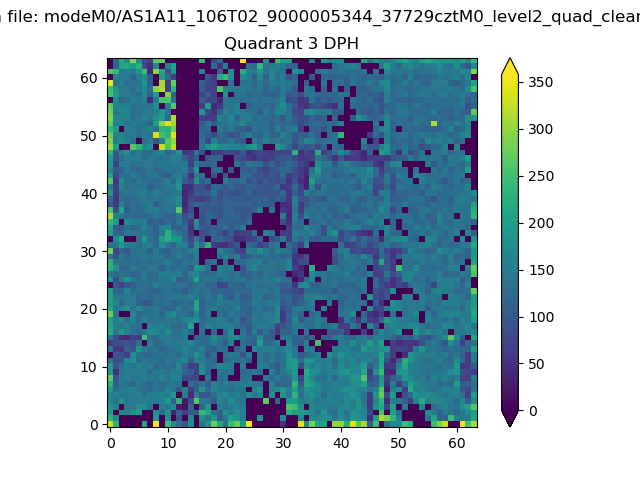 |
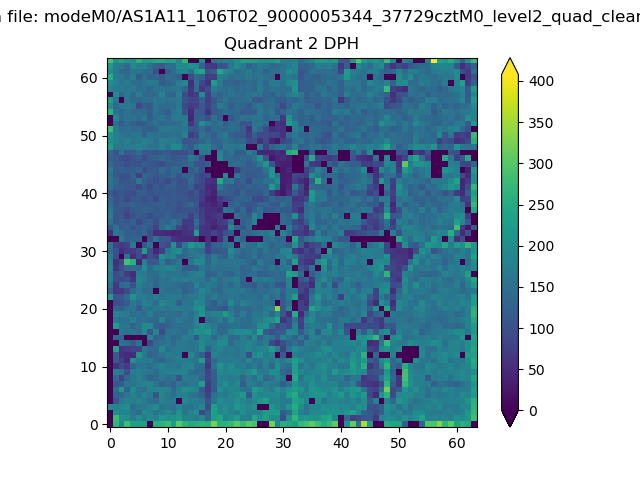 |
Quadrant C |
| Plot type | Count rate plots | Images |
|---|---|---|
| Comparison with Poisson distribution Blue bars denote a histogram of data divided into 1 sec bins. Red curve is a Poisson curve with rate = median count rate of data. |
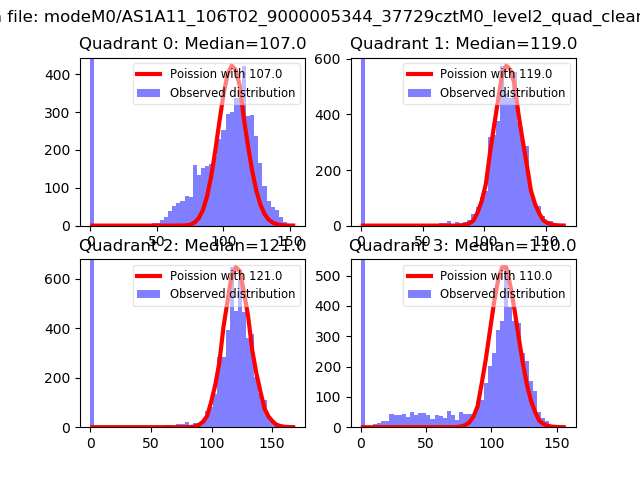 |
 |
| Quadrant-wise count rates Data is divided into 100 sec bins |
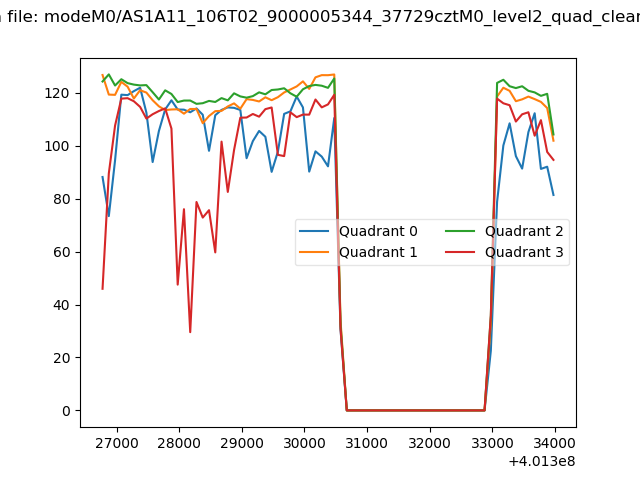 |
|
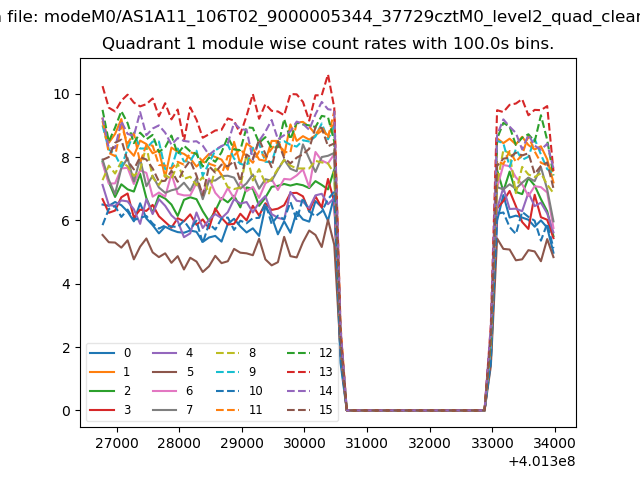
| Module-wise count rates for Quadrant A Data is divided into 100 sec bins |
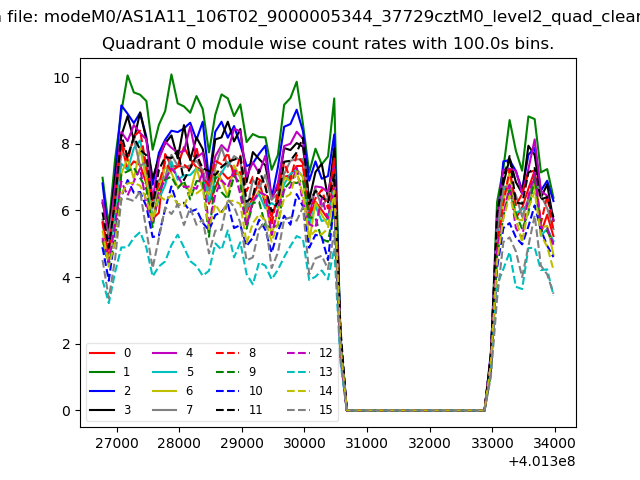 |
 |
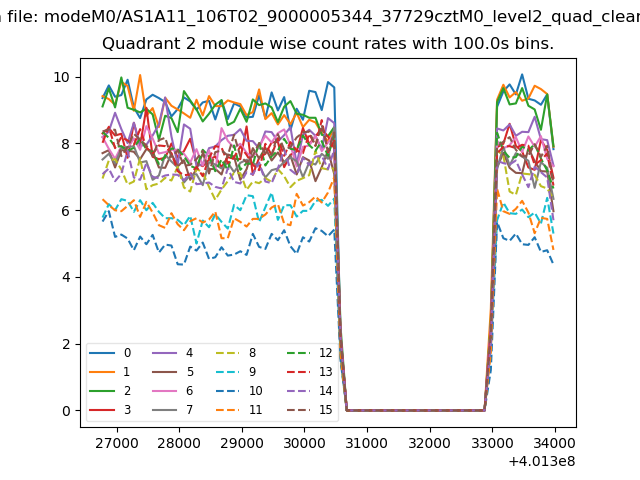
| Module-wise count rates for Quadrant B Data is divided into 100 sec bins |
 |
 |
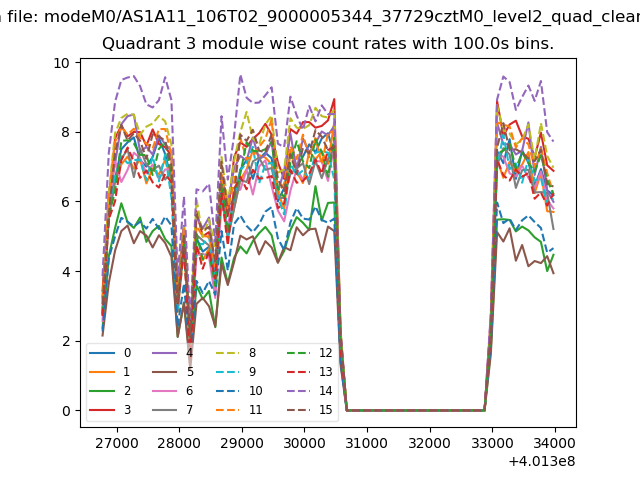
| Module-wise count rates for Quadrant C Data is divided into 100 sec bins |
 |
 |
| Module-wise count rates for Quadrant D Data is divided into 100 sec bins |
 |
 |
| Parameter | Plot |
|---|---|
| CZT HV Monitor | 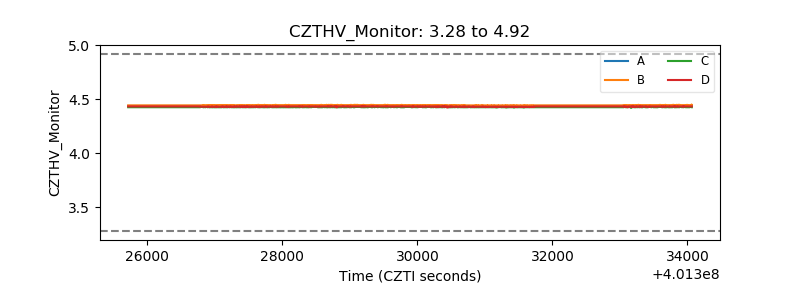 |
| D_VDD | 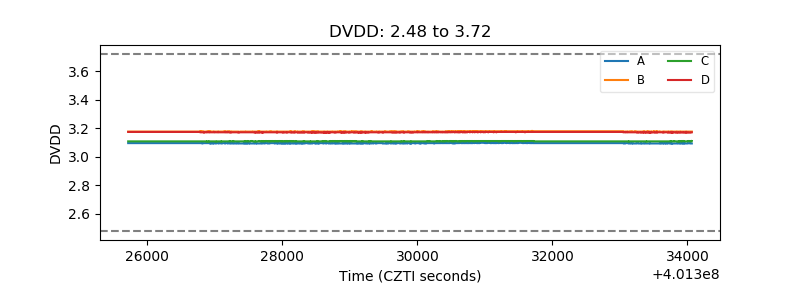 |
| Temperature 1 | 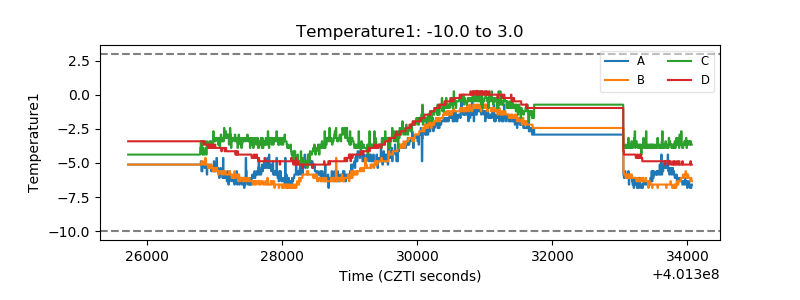 |
| Veto HV Monitor | 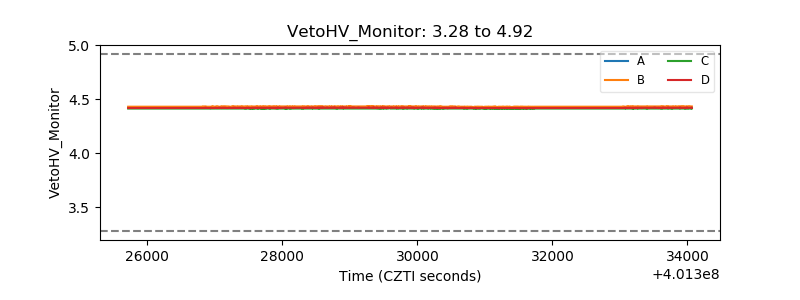 |
| Veto LLD | 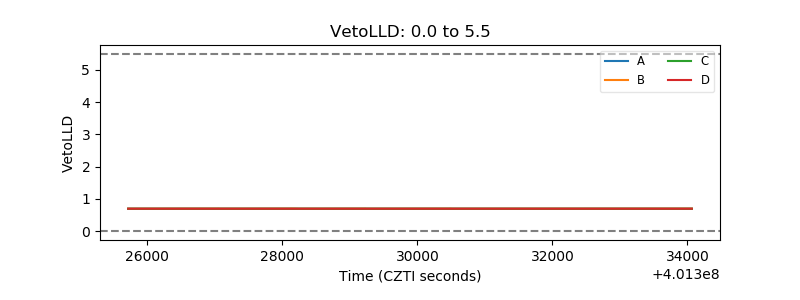 |
| Alpha Counter | 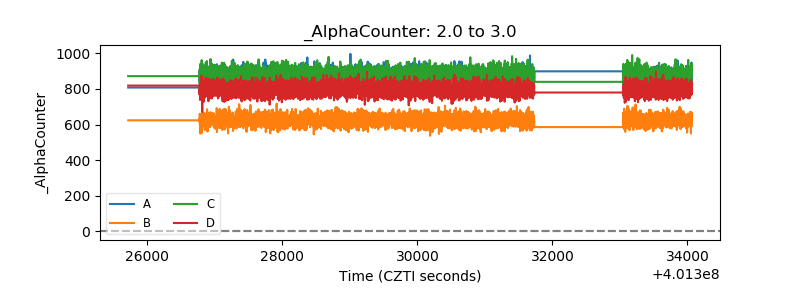 |
| _CPM_Rate | 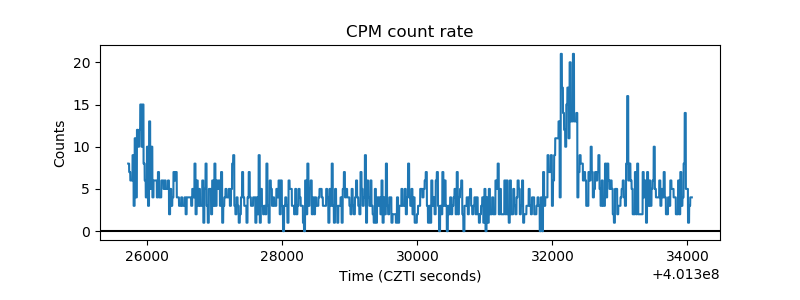 |
| CZT Counter | 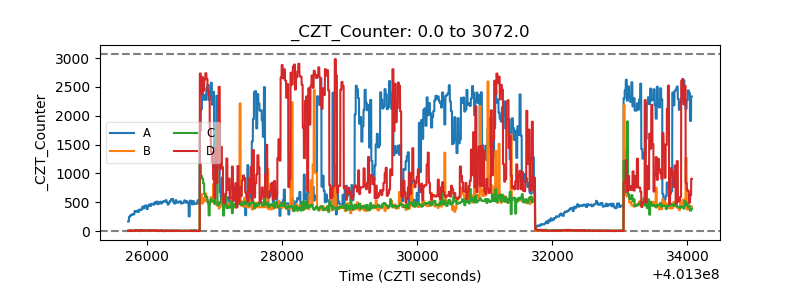 |
| +2.5 Volts monitor | 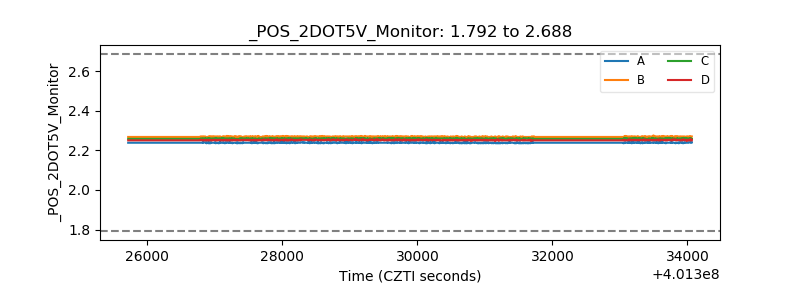 |
| +5 Volts monitor | 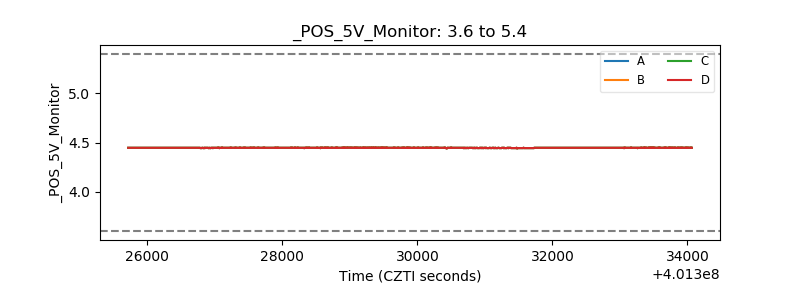 |
| _ROLL_ROT | 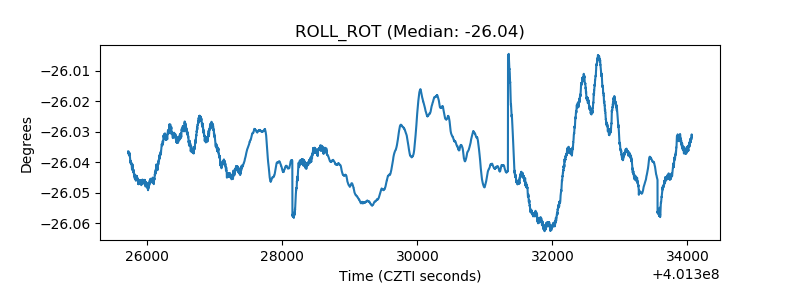 |
| _Roll_DEC | 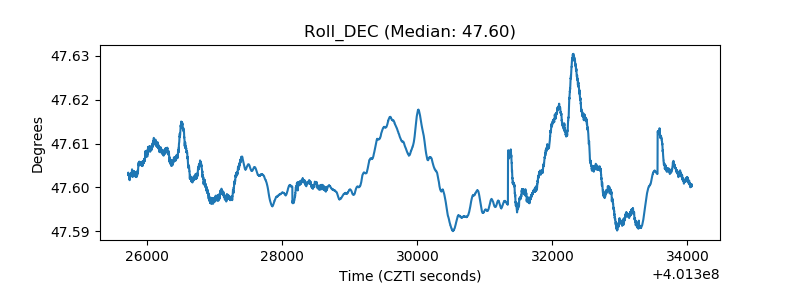 |
| _Roll_RA | 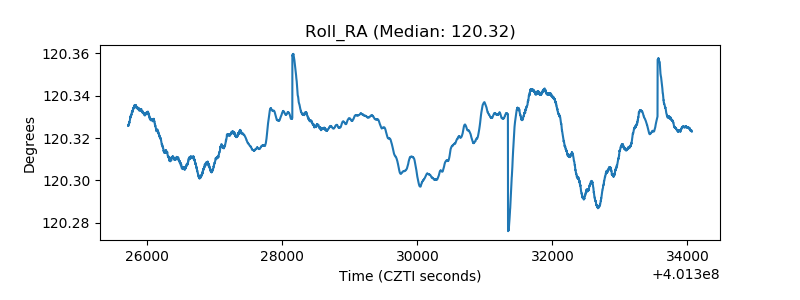 |
| Veto Counter | 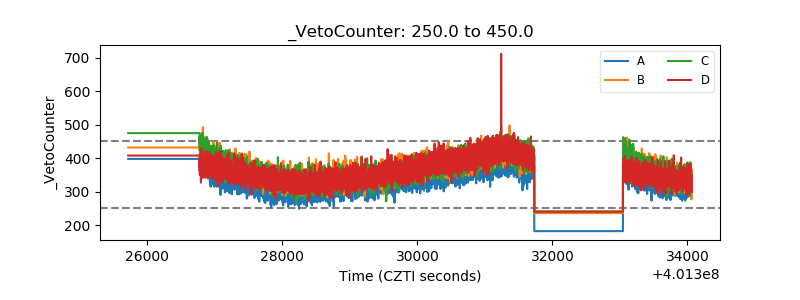 |