| Param | Original file | Final file |
|---|---|---|
| Filename | modeM0/AS1A11_106T02_9000005344_37731cztM0_level2.evt | modeM0/AS1A11_106T02_9000005344_37731cztM0_level2_quad_clean.evt |
| Size (bytes) | 1,433,825,280 | 112,561,920 |
| Size | 1.3 GB | 107.3 MB |
| Events in quadrant A | 15,257,805 | 661,624 |
| Events in quadrant B | 5,136,987 | 746,246 |
| Events in quadrant C | 4,742,832 | 757,496 |
| Events in quadrant D | 17,629,614 | 564,092 |
| Mode M9 | |||
|---|---|---|---|
| Quadrant | BADHDUFLAG | Total packets | Discarded packets |
| A | 0 | 27 | 0 |
| B | 0 | 26 | 0 |
| C | 0 | 26 | 0 |
| D | 0 | 27 | 0 |
| Mode SS | |||
|---|---|---|---|
| Quadrant | BADHDUFLAG | Total packets | Discarded packets |
| A | 0 | 200 | 0 |
| B | 0 | 200 | 0 |
| C | 0 | 200 | 0 |
| D | 0 | 200 | 0 |
| Mode M0 | |||
|---|---|---|---|
| Quadrant | BADHDUFLAG | Total packets | Discarded packets |
| A | 0 | 52003 | 2 |
| B | 0 | 22167 | 2 |
| C | 0 | 20401 | 2 |
| D | 0 | 58986 | 2 |
| Quadrant | Total seconds | Saturated seconds | Saturation percentage |
|---|---|---|---|
| A | 9765 | 4505 | 46.134153% |
| B | 9765 | 180 | 1.843318% |
| C | 9765 | 39 | 0.399386% |
| D | 9765 | 4960 | 50.793651% |
Noise dominated data is calculated using 1-second bins in cleaned event files. If a bin has >2000 counts, and if more than 50% of those come from <1% of pixels, then it is considered to be noise-dominated and hence unusable.
| Quadrant | # 1 sec bins | Bins with >0 counts | Bins with >2000 counts | High rate bins dominated by noise | Noise dominated (total time) | Noise dominated (detector-on time) | Marked lightcurve |
|---|---|---|---|---|---|---|---|
| A | 11106 | 9764 | 4401 | 4401 | 39.63% | 45.07% | 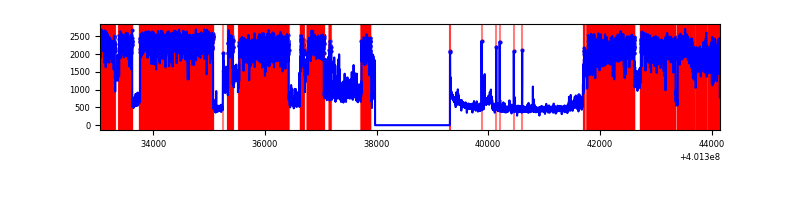 |
| B | 11106 | 9764 | 133 | 133 | 1.20% | 1.36% | 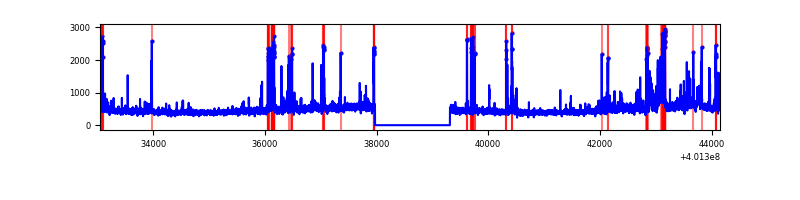 |
| C | 11106 | 9764 | 27 | 27 | 0.24% | 0.28% | 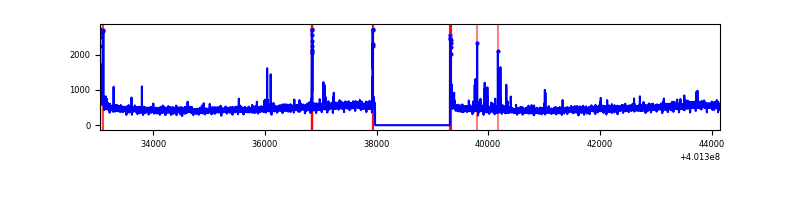 |
| D | 11106 | 9764 | 5070 | 5070 | 45.65% | 51.93% | 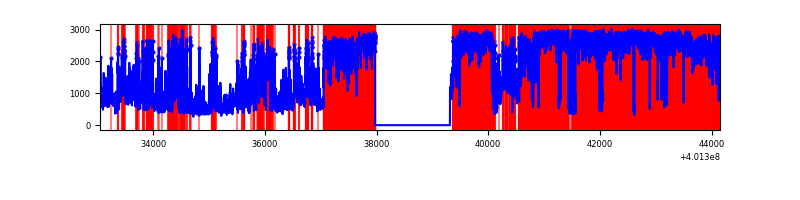 |
Top three noisy pixels from each quadrant. If the there are fewer than three noisy pixels in the level2.evt file, extra rows are filled as -1
| Pixel properties | Quadrant properties | ||||||
|---|---|---|---|---|---|---|---|
| Quadrant | DetID | PixID | Counts | Sigma | Mean | Median | Sigma |
| A | 15 | 222 | 10956890 | 56105.59 | 976 | 957 | 195.3 |
| A | 10 | 83 | 448975 | 2294.31 | 976 | 957 | 195.3 |
| A | 9 | 143 | 37078 | 184.98 | 976 | 957 | 195.3 |
| B | 5 | 172 | 298468 | 1456.91 | 1063 | 1034 | 204.2 |
| B | 5 | 200 | 190315 | 927.15 | 1063 | 1034 | 204.2 |
| B | 5 | 255 | 176840 | 861.14 | 1063 | 1034 | 204.2 |
| C | 15 | 214 | 408999 | 1669.37 | 1054 | 1060 | 244.4 |
| C | 0 | 10 | 85960 | 347.43 | 1054 | 1060 | 244.4 |
| C | 0 | 207 | 47334 | 189.36 | 1054 | 1060 | 244.4 |
| D | 12 | 227 | 11011032 | 59451.61 | 754 | 732 | 185.2 |
| D | 2 | 249 | 1637782 | 8839.47 | 754 | 732 | 185.2 |
| D | 12 | 233 | 742374 | 4004.6 | 754 | 732 | 185.2 |
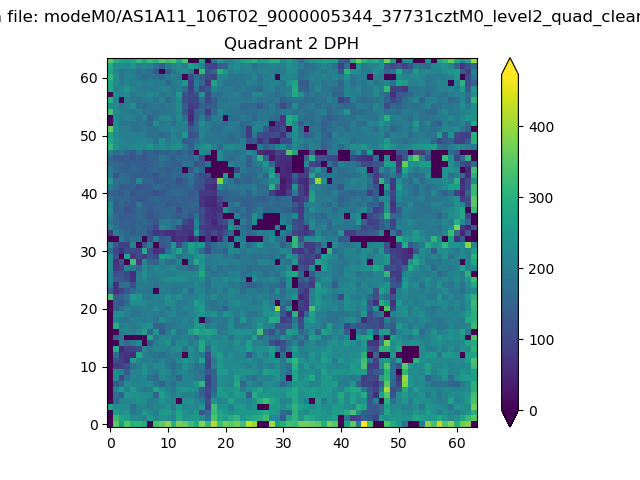
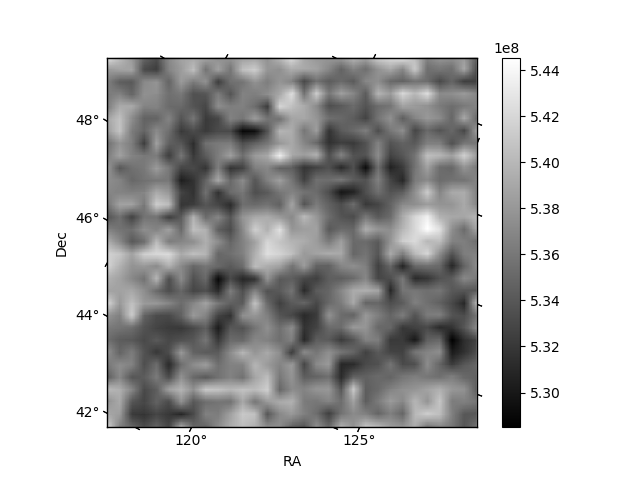
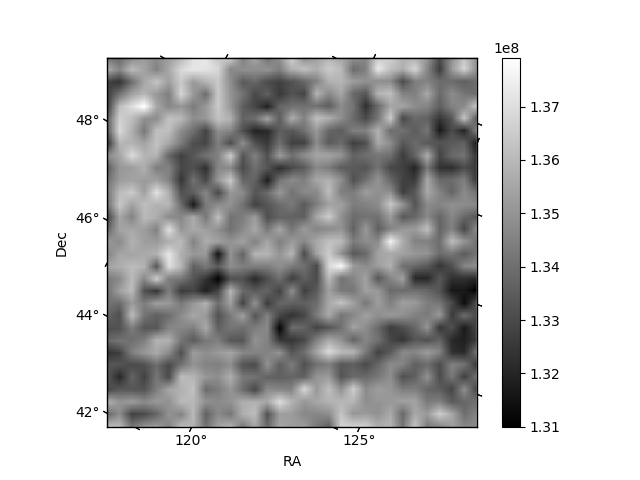
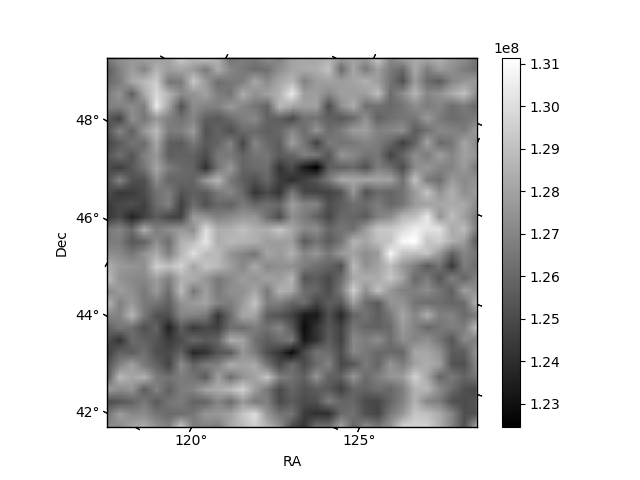
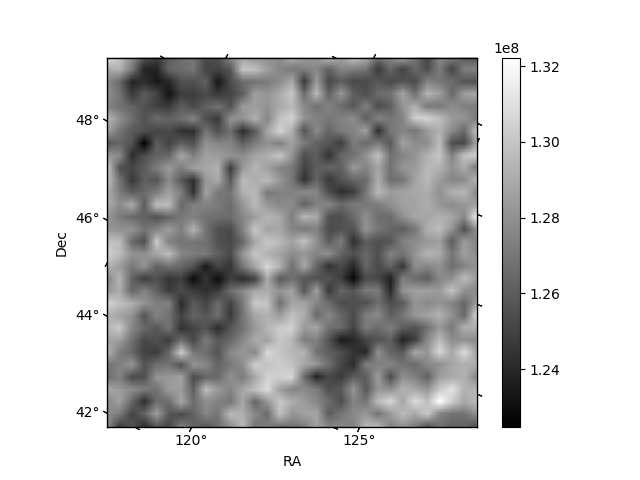
Histogram calculated using DETX and DETY for each event in the final _common_clean file
| Quadrant A | 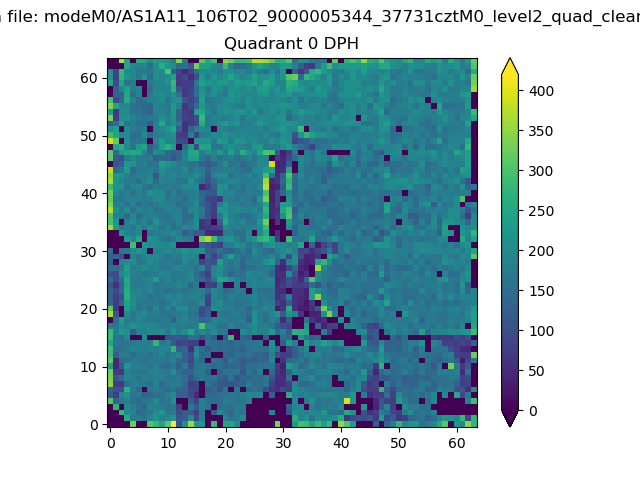 |
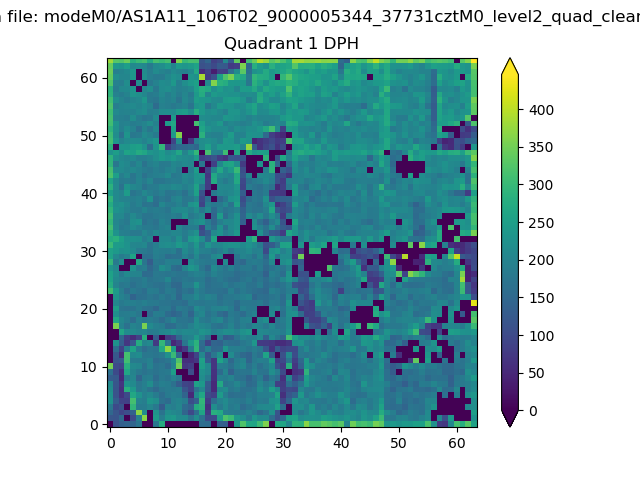 |
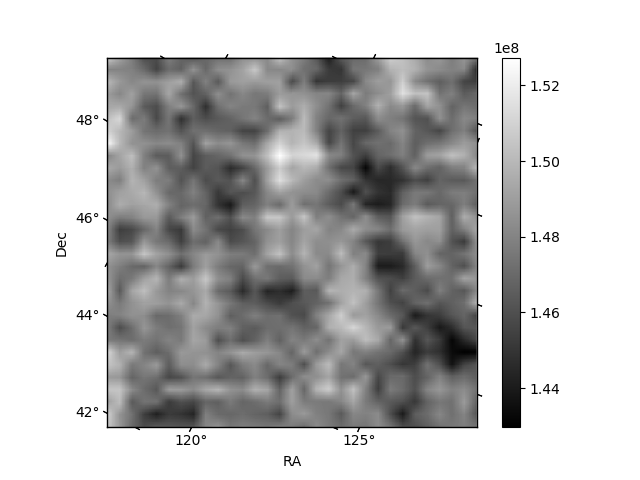
Quadrant B |
|---|---|---|---|
| Quadrant D | 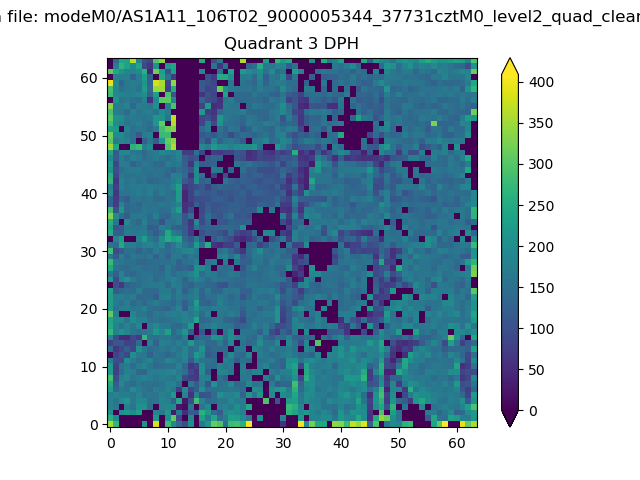 |
 |
Quadrant C |
| Plot type | Count rate plots | Images |
|---|---|---|
| Comparison with Poisson distribution Blue bars denote a histogram of data divided into 1 sec bins. Red curve is a Poisson curve with rate = median count rate of data. |
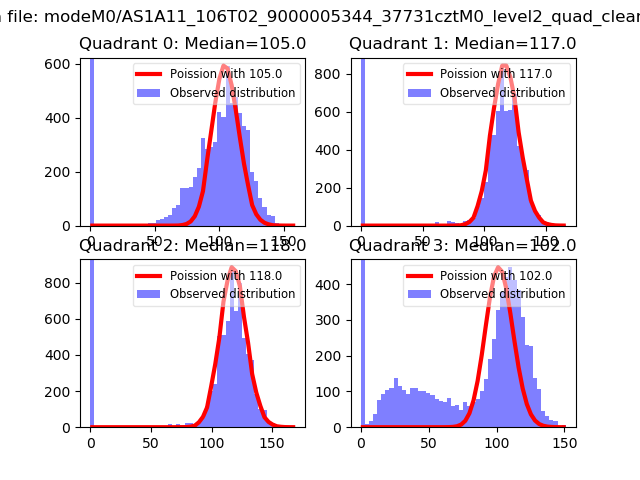 |
 |
| Quadrant-wise count rates Data is divided into 100 sec bins |
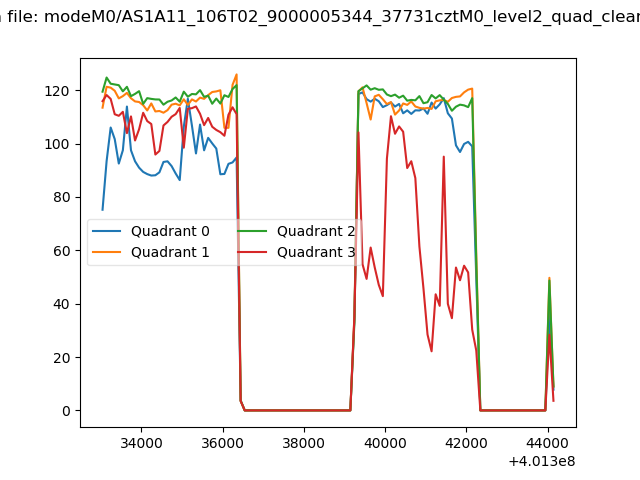 |
|
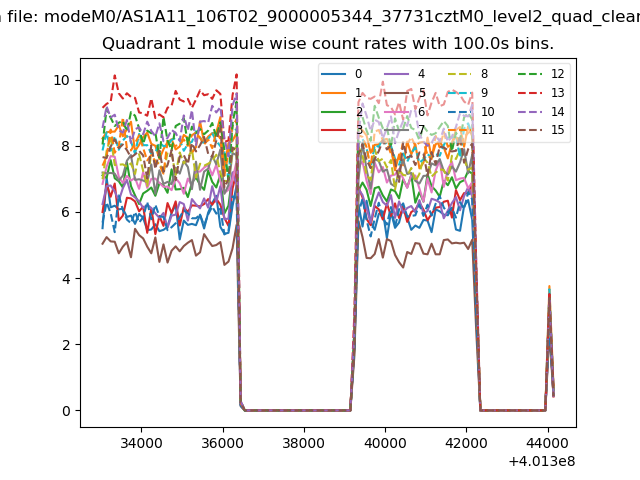
| Module-wise count rates for Quadrant A Data is divided into 100 sec bins |
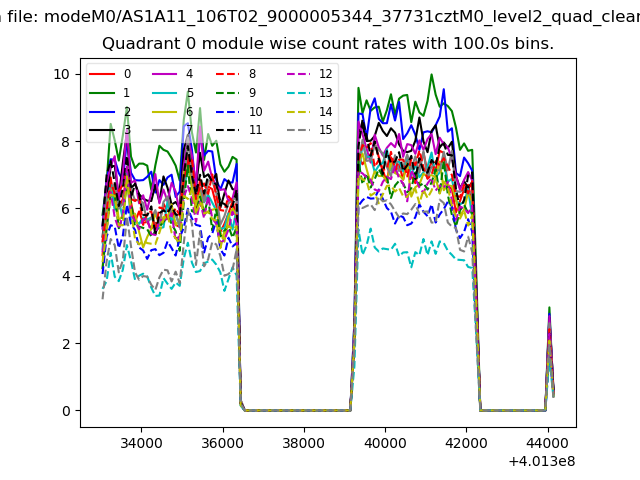 |
 |
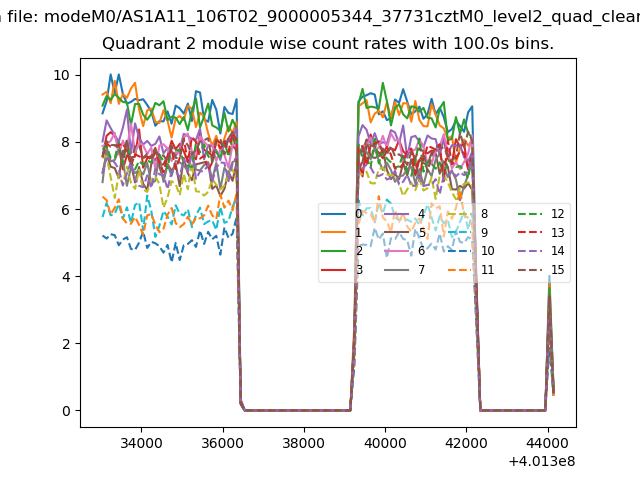
| Module-wise count rates for Quadrant B Data is divided into 100 sec bins |
 |
 |
| Module-wise count rates for Quadrant C Data is divided into 100 sec bins |
 |
 |
| Module-wise count rates for Quadrant D Data is divided into 100 sec bins |
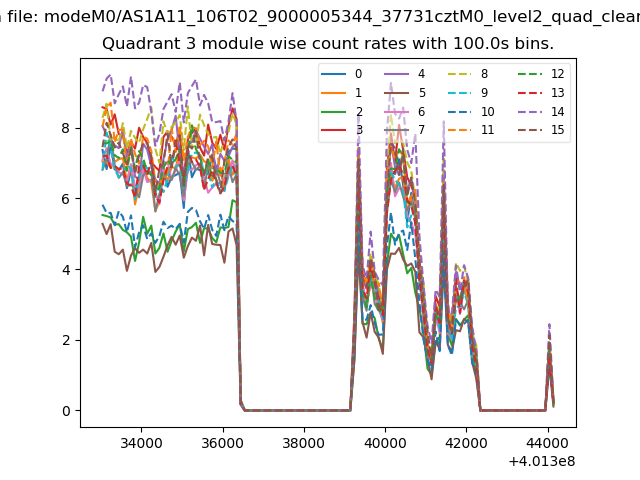 |
 |
| Parameter | Plot |
|---|---|
| CZT HV Monitor |  |
| D_VDD | 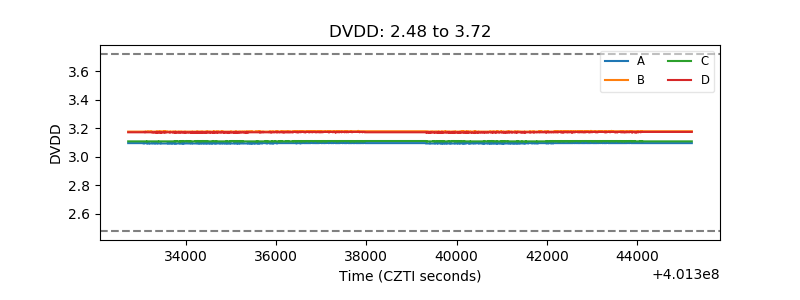 |
| Temperature 1 | 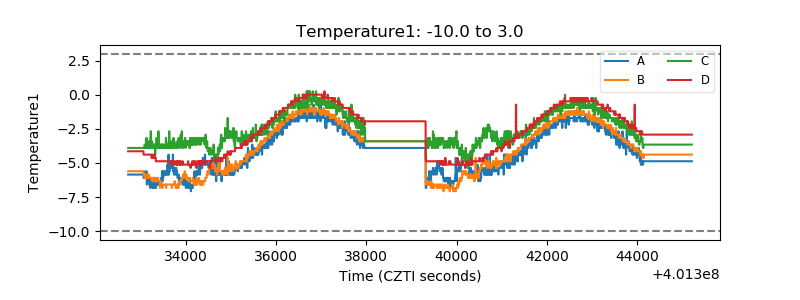 |
| Veto HV Monitor | 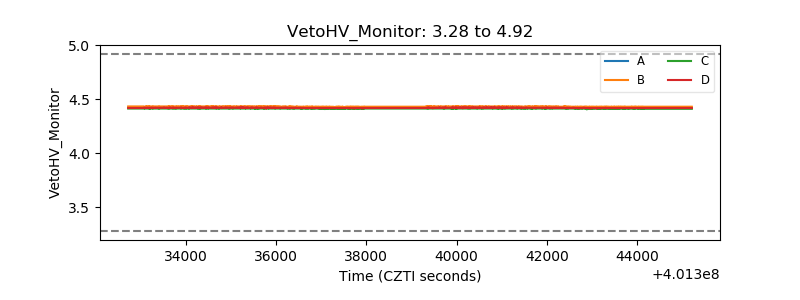 |
| Veto LLD | 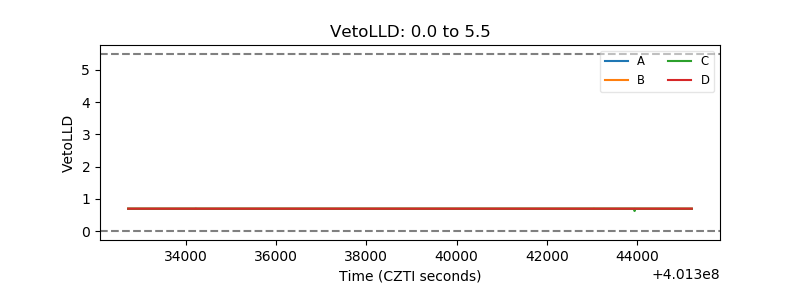 |
| Alpha Counter | 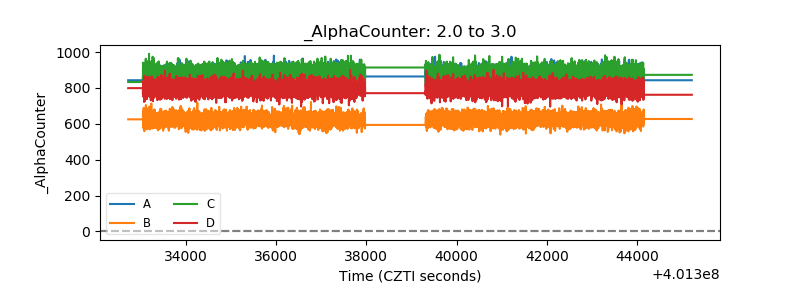 |
| _CPM_Rate | 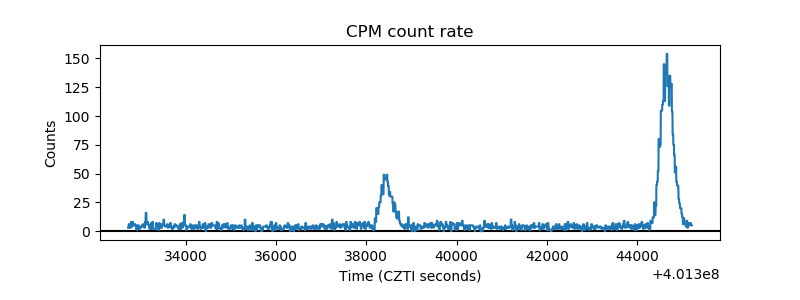 |
| CZT Counter | 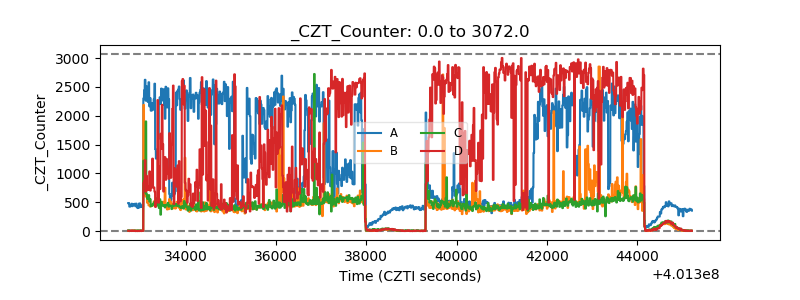 |
| +2.5 Volts monitor | 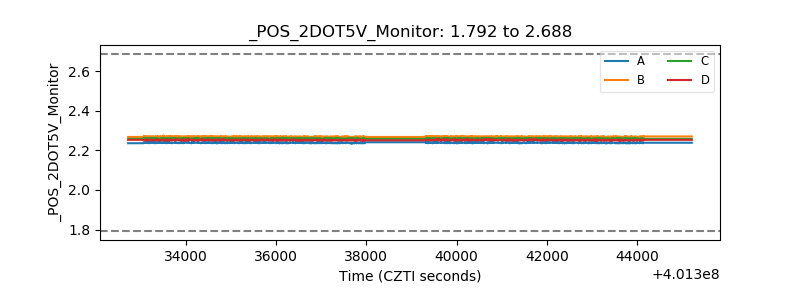 |
| +5 Volts monitor | 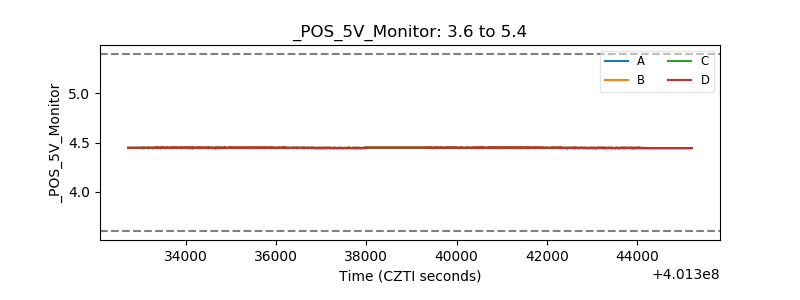 |
| _ROLL_ROT | 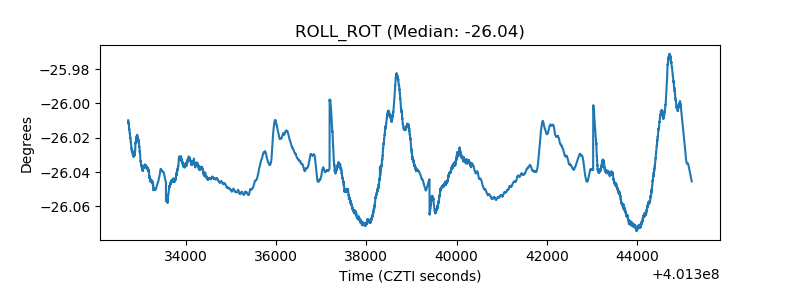 |
| _Roll_DEC | 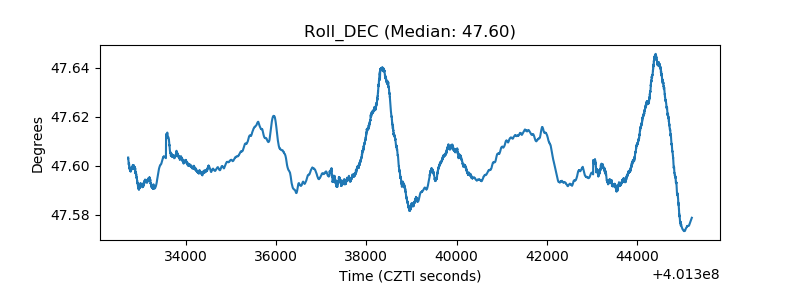 |
| _Roll_RA | 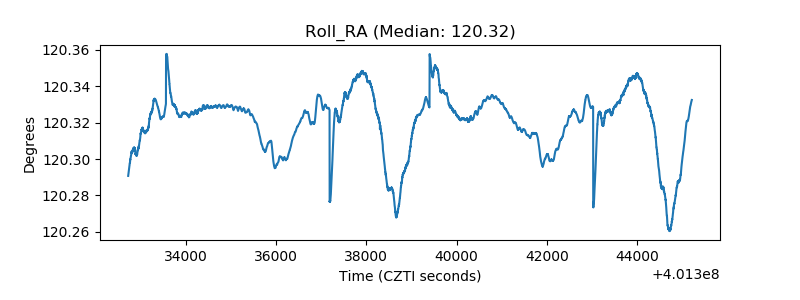 |
| Veto Counter | 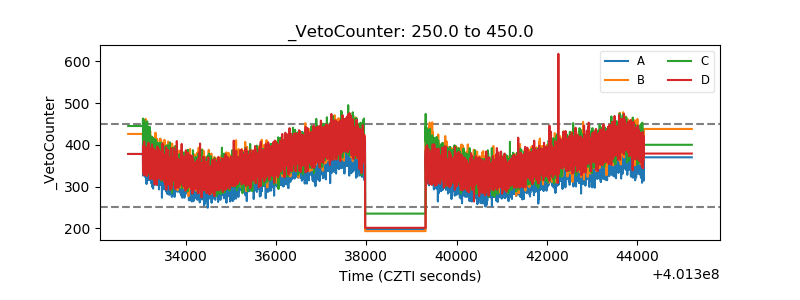 |