| Param | Original file | Final file |
|---|---|---|
| Filename | modeM0/AS1A11_106T02_9000005344_37732cztM0_level2.evt | modeM0/AS1A11_106T02_9000005344_37732cztM0_level2_quad_clean.evt |
| Size (bytes) | 757,054,080 | 67,518,720 |
| Size | 722.0 MB | 64.4 MB |
| Events in quadrant A | 7,771,442 | 329,164 |
| Events in quadrant B | 2,783,231 | 460,818 |
| Events in quadrant C | 2,860,897 | 461,257 |
| Events in quadrant D | 9,128,190 | 394,326 |
| Mode M9 | |||
|---|---|---|---|
| Quadrant | BADHDUFLAG | Total packets | Discarded packets |
| A | 0 | 20 | 0 |
| B | 0 | 20 | 0 |
| C | 0 | 20 | 0 |
| D | 0 | 21 | 0 |
| Mode SS | |||
|---|---|---|---|
| Quadrant | BADHDUFLAG | Total packets | Discarded packets |
| A | 0 | 116 | 0 |
| B | 0 | 116 | 0 |
| C | 0 | 116 | 0 |
| D | 0 | 116 | 0 |
| Mode M0 | |||
|---|---|---|---|
| Quadrant | BADHDUFLAG | Total packets | Discarded packets |
| A | 0 | 27074 | 3 |
| B | 0 | 12182 | 2 |
| C | 0 | 12104 | 2 |
| D | 0 | 31027 | 2 |
| Quadrant | Total seconds | Saturated seconds | Saturation percentage |
|---|---|---|---|
| A | 5686 | 1677 | 29.493493% |
| B | 5686 | 52 | 0.914527% |
| C | 5686 | 33 | 0.580373% |
| D | 5686 | 2017 | 35.473092% |
Noise dominated data is calculated using 1-second bins in cleaned event files. If a bin has >2000 counts, and if more than 50% of those come from <1% of pixels, then it is considered to be noise-dominated and hence unusable.
| Quadrant | # 1 sec bins | Bins with >0 counts | Bins with >2000 counts | High rate bins dominated by noise | Noise dominated (total time) | Noise dominated (detector-on time) | Marked lightcurve |
|---|---|---|---|---|---|---|---|
| A | 7239 | 5687 | 1674 | 1674 | 23.12% | 29.44% | 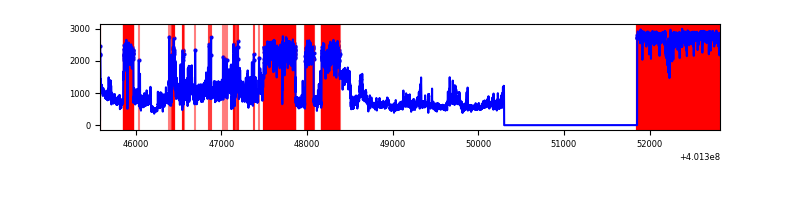 |
| B | 7238 | 5685 | 28 | 28 | 0.39% | 0.49% | 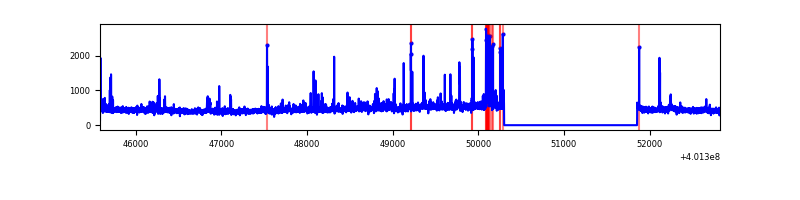 |
| C | 7238 | 5685 | 31 | 31 | 0.43% | 0.55% | 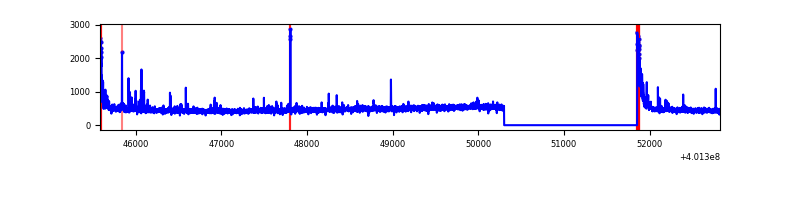 |
| D | 7238 | 5685 | 2197 | 2197 | 30.35% | 38.65% | 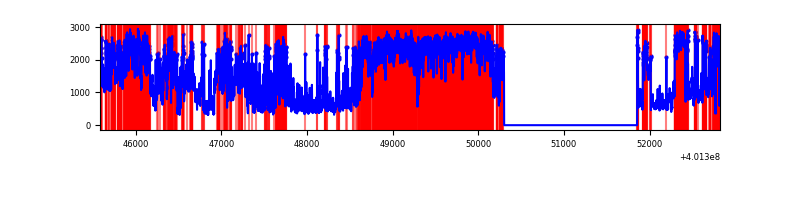 |
Top three noisy pixels from each quadrant. If the there are fewer than three noisy pixels in the level2.evt file, extra rows are filled as -1
| Pixel properties | Quadrant properties | ||||||
|---|---|---|---|---|---|---|---|
| Quadrant | DetID | PixID | Counts | Sigma | Mean | Median | Sigma |
| A | 15 | 222 | 5328088 | 50606.51 | 524 | 514 | 105.3 |
| A | 10 | 83 | 253099 | 2399.3 | 524 | 514 | 105.3 |
| A | 9 | 143 | 76735 | 724.02 | 524 | 514 | 105.3 |
| B | 5 | 255 | 152396 | 1279.02 | 619 | 602 | 118.7 |
| B | 5 | 172 | 44687 | 371.46 | 619 | 602 | 118.7 |
| B | 0 | 229 | 31412 | 259.61 | 619 | 602 | 118.7 |
| C | 15 | 214 | 242417 | 1698.54 | 607 | 609 | 142.4 |
| C | 0 | 10 | 141440 | 989.24 | 607 | 609 | 142.4 |
| C | 14 | 254 | 27943 | 192.0 | 607 | 609 | 142.4 |
| D | 12 | 227 | 5015900 | 39545.31 | 519 | 505 | 126.8 |
| D | 2 | 249 | 1131431 | 8917.11 | 519 | 505 | 126.8 |
| D | 5 | 222 | 407308 | 3207.55 | 519 | 505 | 126.8 |
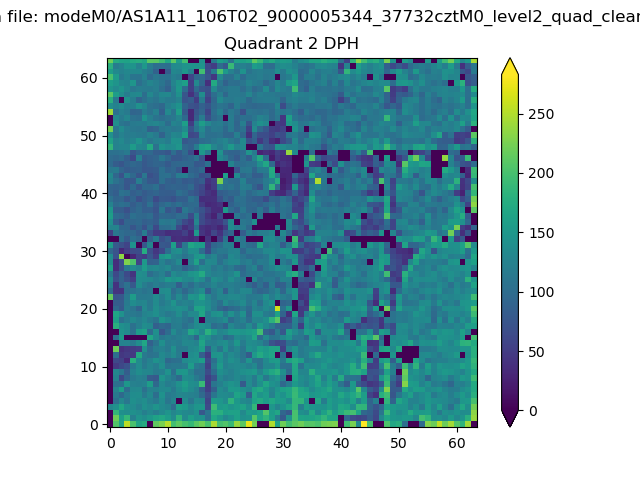
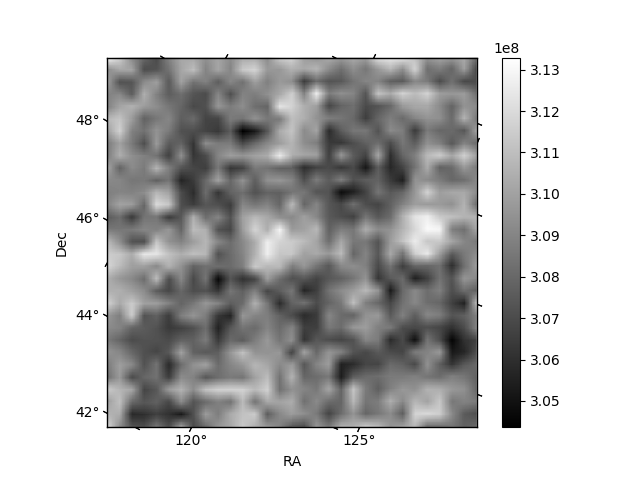
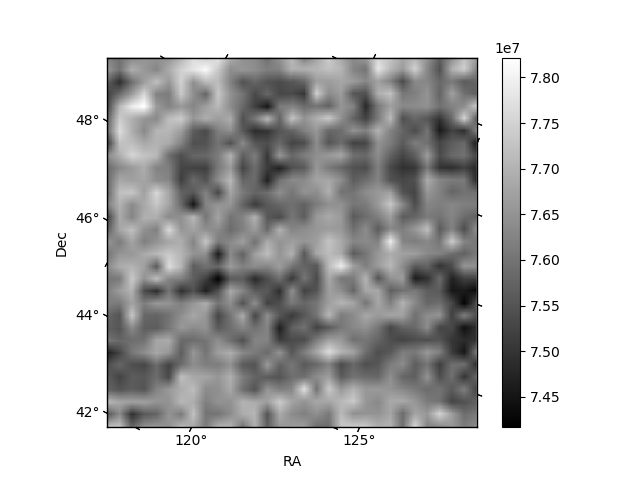
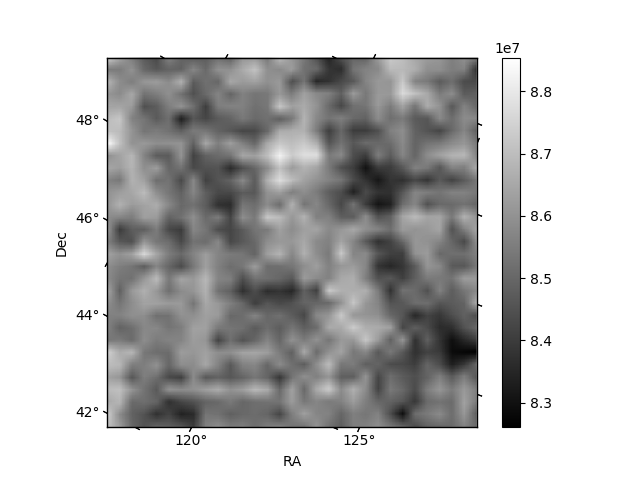
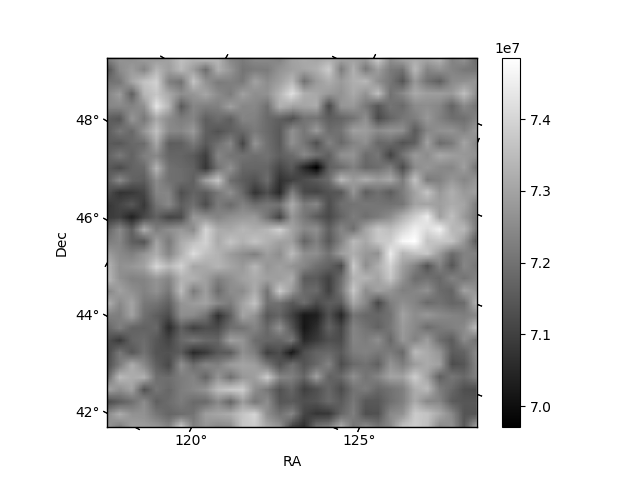
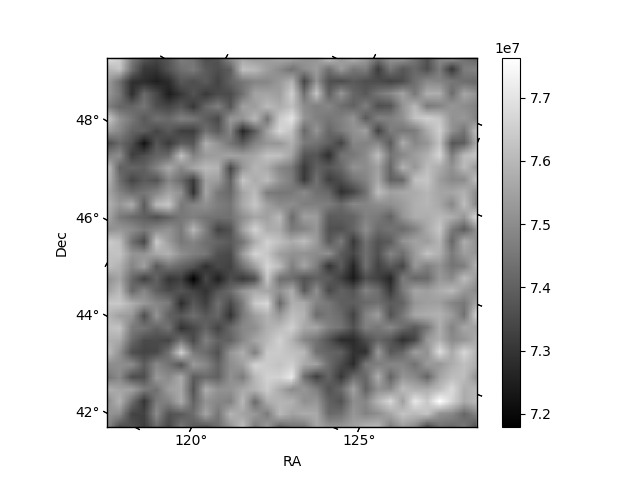
Histogram calculated using DETX and DETY for each event in the final _common_clean file
| Quadrant A | 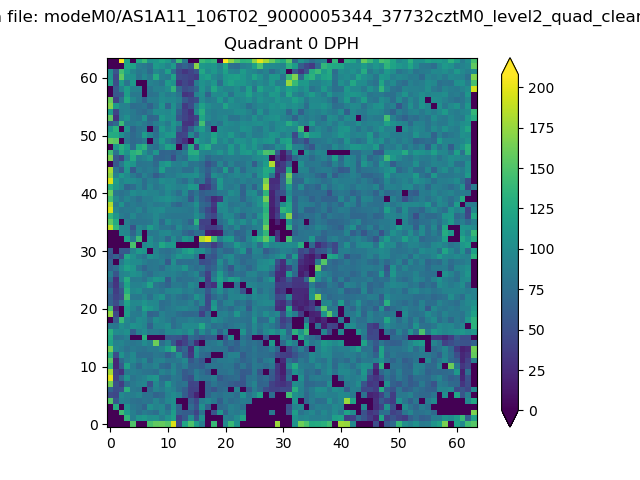 |
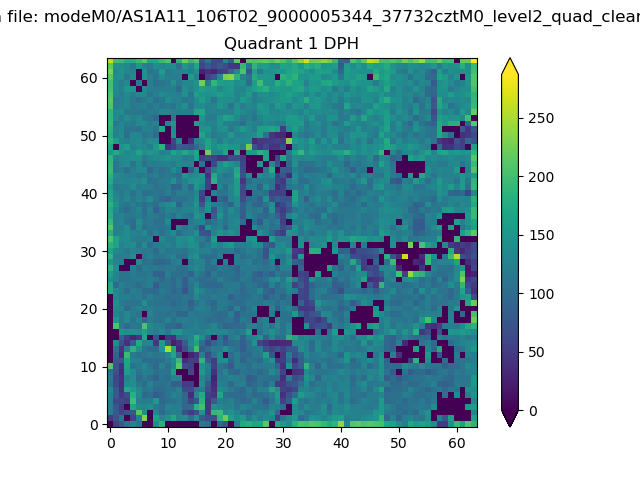 |
Quadrant B |
|---|---|---|---|
| Quadrant D | 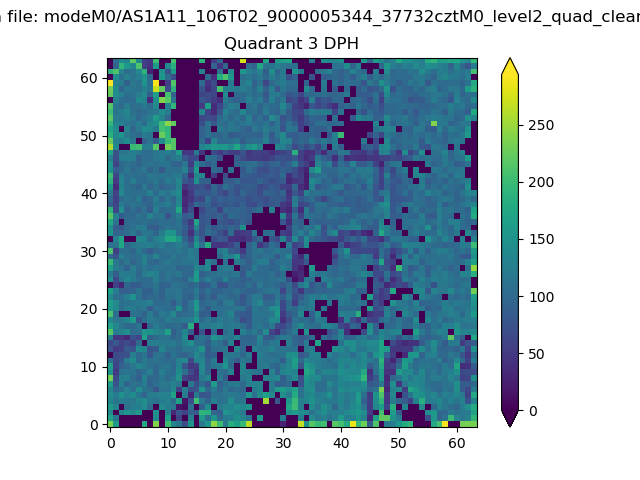 |
 |
Quadrant C |
| Plot type | Count rate plots | Images |
|---|---|---|
| Comparison with Poisson distribution Blue bars denote a histogram of data divided into 1 sec bins. Red curve is a Poisson curve with rate = median count rate of data. |
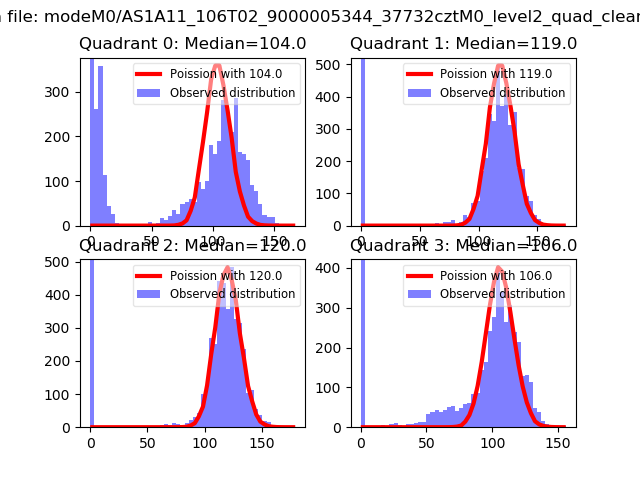 |
 |
| Quadrant-wise count rates Data is divided into 100 sec bins |
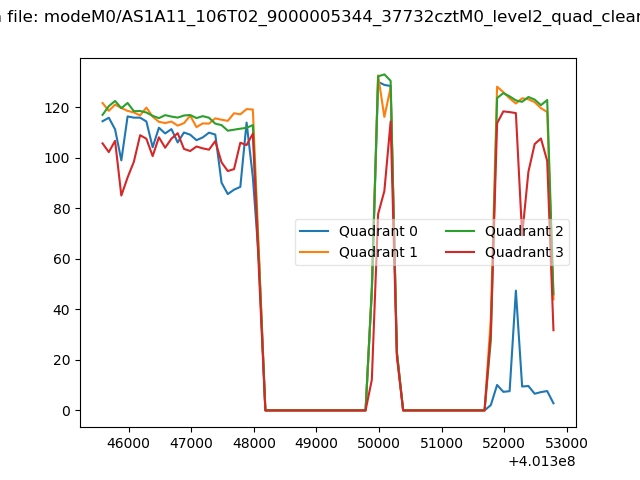 |
|
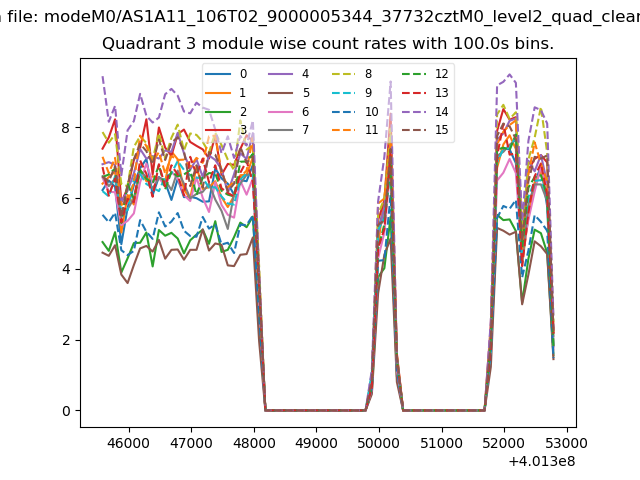
| Module-wise count rates for Quadrant A Data is divided into 100 sec bins |
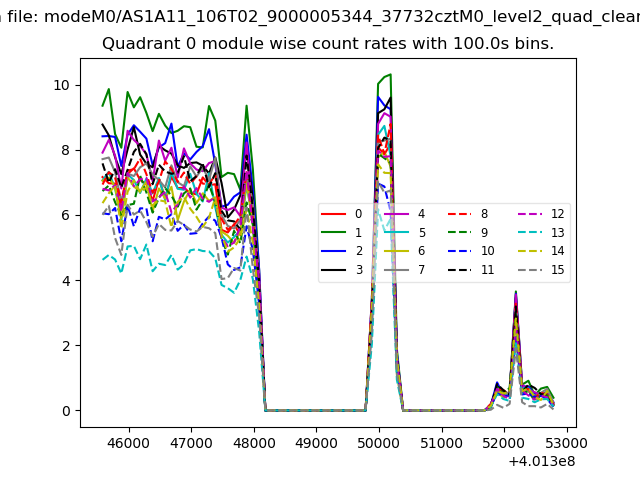 |
 |
| Module-wise count rates for Quadrant B Data is divided into 100 sec bins |
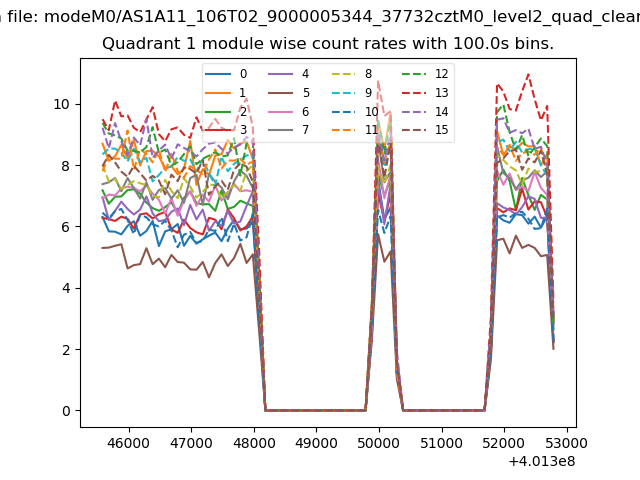 |
 |
| Module-wise count rates for Quadrant C Data is divided into 100 sec bins |
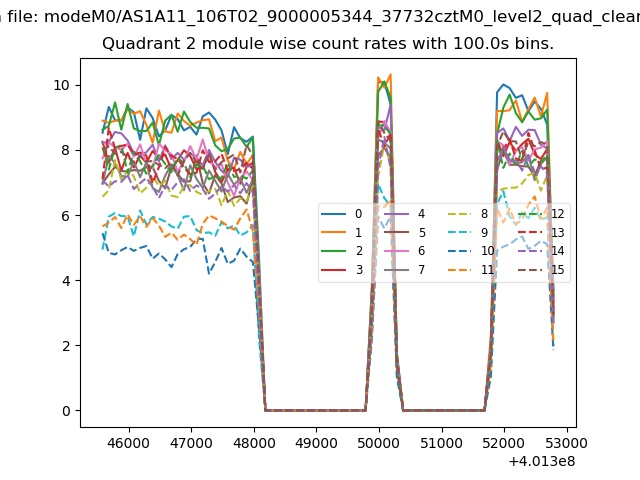 |
 |
| Module-wise count rates for Quadrant D Data is divided into 100 sec bins |
 |
 |
| Parameter | Plot |
|---|---|
| CZT HV Monitor | 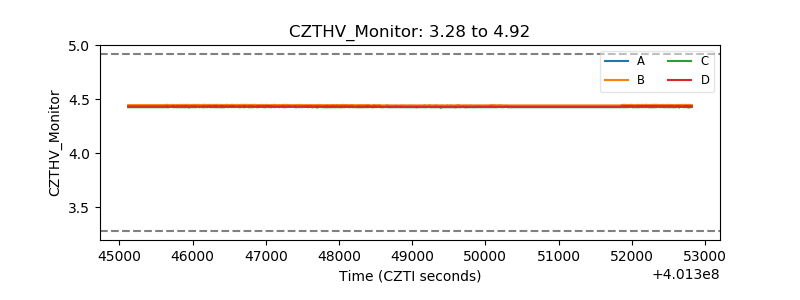 |
| D_VDD | 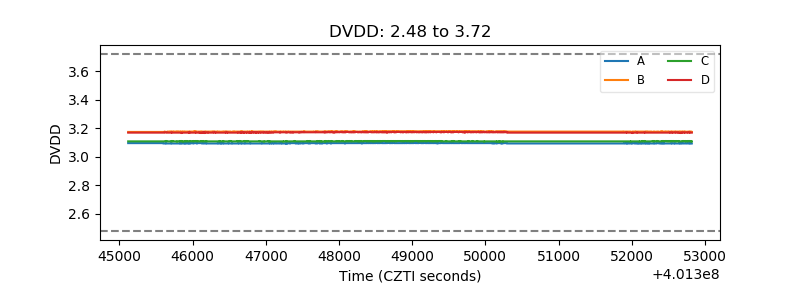 |
| Temperature 1 | 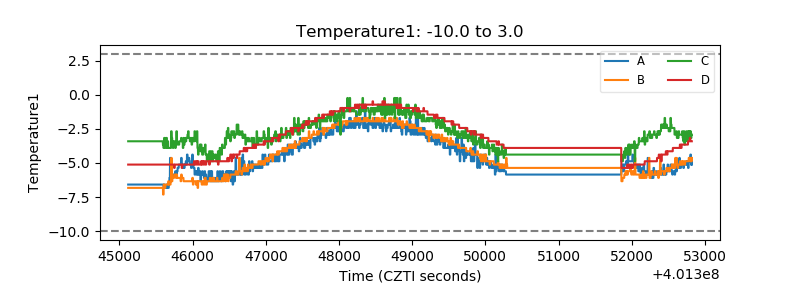 |
| Veto HV Monitor | 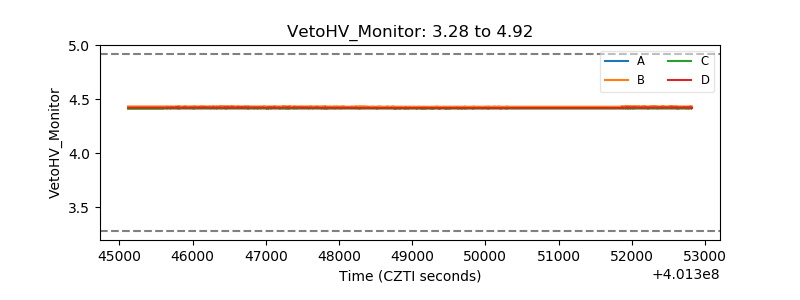 |
| Veto LLD | 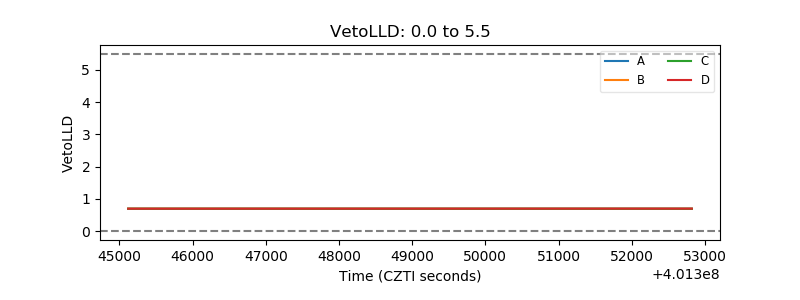 |
| Alpha Counter | 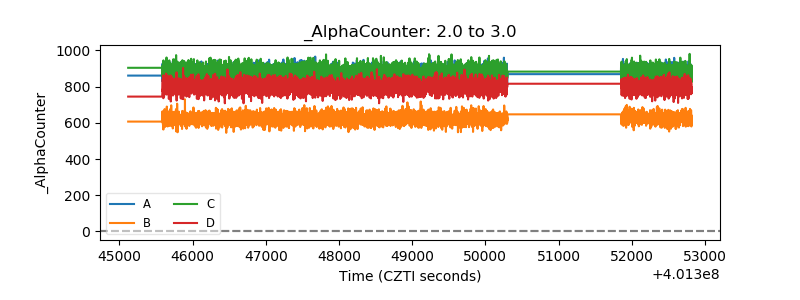 |
| _CPM_Rate | 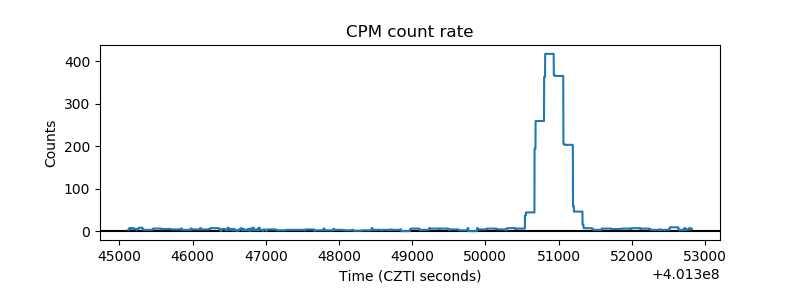 |
| CZT Counter | 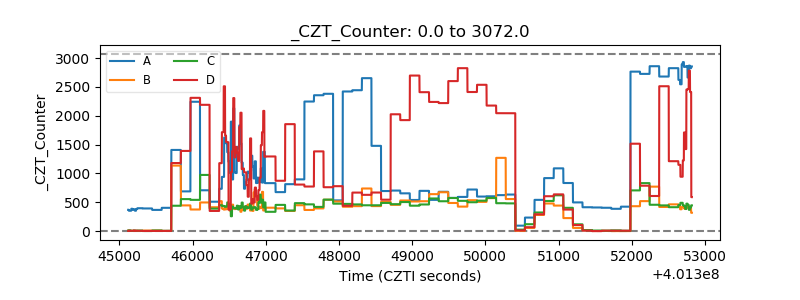 |
| +2.5 Volts monitor | 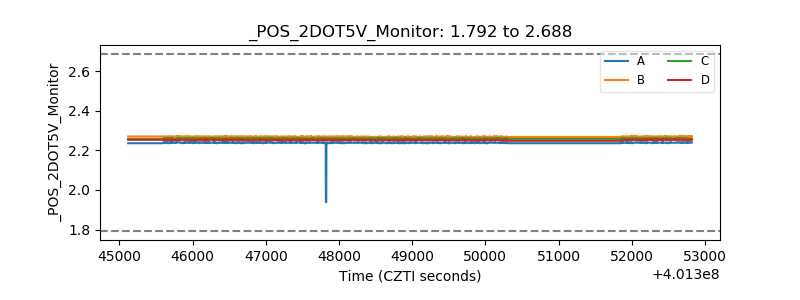 |
| +5 Volts monitor | 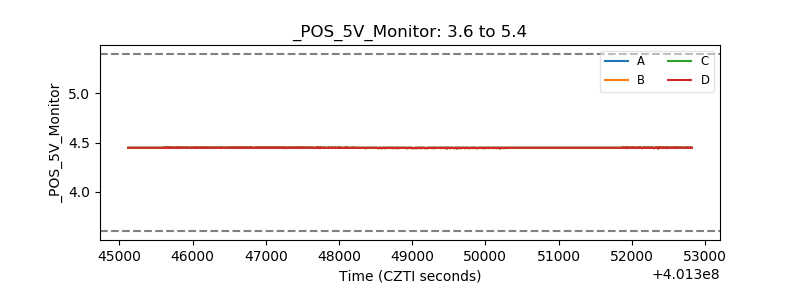 |
| _ROLL_ROT | 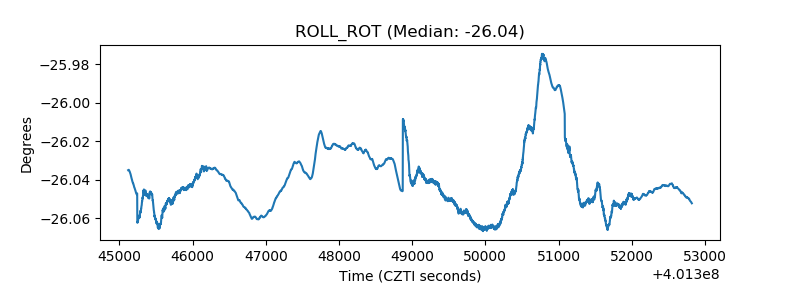 |
| _Roll_DEC | 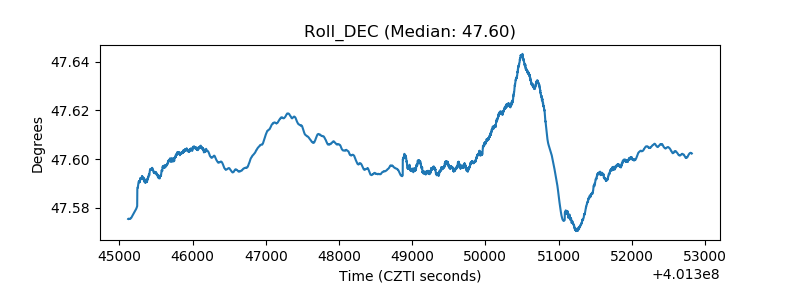 |
| _Roll_RA | 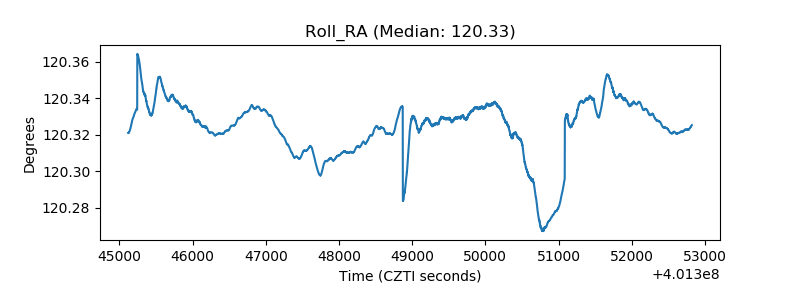 |
| Veto Counter | 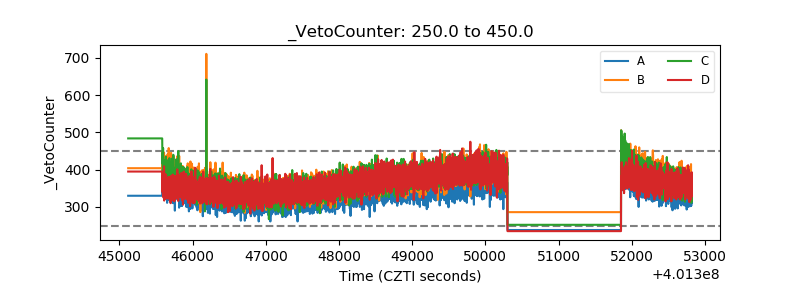 |