| Param | Original file | Final file |
|---|---|---|
| Filename | modeM0/AS1A11_106T02_9000005344_37733cztM0_level2.evt | modeM0/AS1A11_106T02_9000005344_37733cztM0_level2_quad_clean.evt |
| Size (bytes) | 734,613,120 | 58,988,160 |
| Size | 700.6 MB | 56.3 MB |
| Events in quadrant A | 8,009,914 | 266,822 |
| Events in quadrant B | 2,630,882 | 411,102 |
| Events in quadrant C | 2,559,393 | 410,340 |
| Events in quadrant D | 8,701,098 | 336,936 |
| Mode M9 | |||
|---|---|---|---|
| Quadrant | BADHDUFLAG | Total packets | Discarded packets |
| A | 0 | 17 | 0 |
| B | 0 | 17 | 0 |
| C | 0 | 17 | 0 |
| D | 0 | 17 | 0 |
| Mode SS | |||
|---|---|---|---|
| Quadrant | BADHDUFLAG | Total packets | Discarded packets |
| A | 0 | 104 | 0 |
| B | 0 | 104 | 0 |
| C | 0 | 104 | 0 |
| D | 0 | 104 | 0 |
| Mode M0 | |||
|---|---|---|---|
| Quadrant | BADHDUFLAG | Total packets | Discarded packets |
| A | 0 | 27192 | 2 |
| B | 0 | 11203 | 1 |
| C | 0 | 10776 | 1 |
| D | 0 | 29313 | 1 |
| Quadrant | Total seconds | Saturated seconds | Saturation percentage |
|---|---|---|---|
| A | 5135 | 2176 | 42.375852% |
| B | 5135 | 58 | 1.129503% |
| C | 5135 | 30 | 0.584226% |
| D | 5135 | 2398 | 46.699124% |
Noise dominated data is calculated using 1-second bins in cleaned event files. If a bin has >2000 counts, and if more than 50% of those come from <1% of pixels, then it is considered to be noise-dominated and hence unusable.
| Quadrant | # 1 sec bins | Bins with >0 counts | Bins with >2000 counts | High rate bins dominated by noise | Noise dominated (total time) | Noise dominated (detector-on time) | Marked lightcurve |
|---|---|---|---|---|---|---|---|
| A | 6808 | 5136 | 2145 | 2145 | 31.51% | 41.76% | 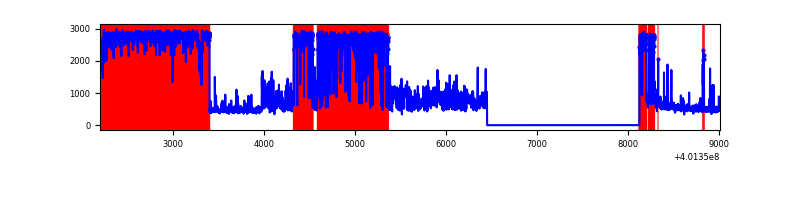 |
| B | 6808 | 5135 | 51 | 51 | 0.75% | 0.99% | 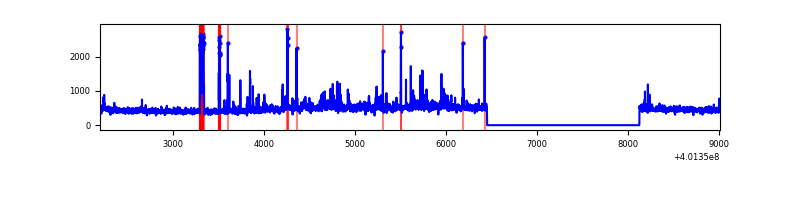 |
| C | 6808 | 5135 | 28 | 28 | 0.41% | 0.55% | 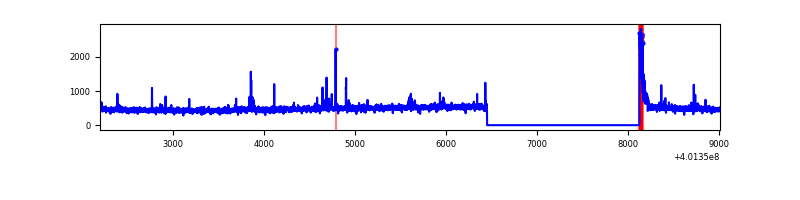 |
| D | 6808 | 5135 | 2461 | 2461 | 36.15% | 47.93% | 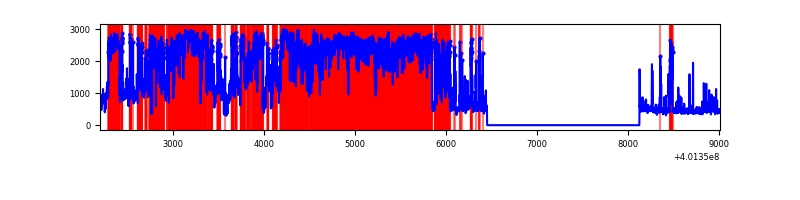 |
Top three noisy pixels from each quadrant. If the there are fewer than three noisy pixels in the level2.evt file, extra rows are filled as -1
| Pixel properties | Quadrant properties | ||||||
|---|---|---|---|---|---|---|---|
| Quadrant | DetID | PixID | Counts | Sigma | Mean | Median | Sigma |
| A | 15 | 222 | 6266407 | 79489.15 | 384 | 376 | 78.8 |
| A | 10 | 83 | 170527 | 2158.49 | 384 | 376 | 78.8 |
| A | 9 | 143 | 55721 | 702.09 | 384 | 376 | 78.8 |
| B | 5 | 255 | 148954 | 1354.35 | 569 | 554 | 109.6 |
| B | 5 | 172 | 120251 | 1092.4 | 569 | 554 | 109.6 |
| B | 4 | 232 | 38779 | 348.85 | 569 | 554 | 109.6 |
| C | 15 | 214 | 216724 | 1663.84 | 558 | 560 | 129.9 |
| C | 0 | 10 | 92606 | 708.49 | 558 | 560 | 129.9 |
| C | 14 | 254 | 23177 | 174.08 | 558 | 560 | 129.9 |
| D | 12 | 227 | 4599936 | 44305.22 | 426 | 414 | 103.8 |
| D | 2 | 249 | 1926933 | 18557.33 | 426 | 414 | 103.8 |
| D | 5 | 222 | 102140 | 979.88 | 426 | 414 | 103.8 |
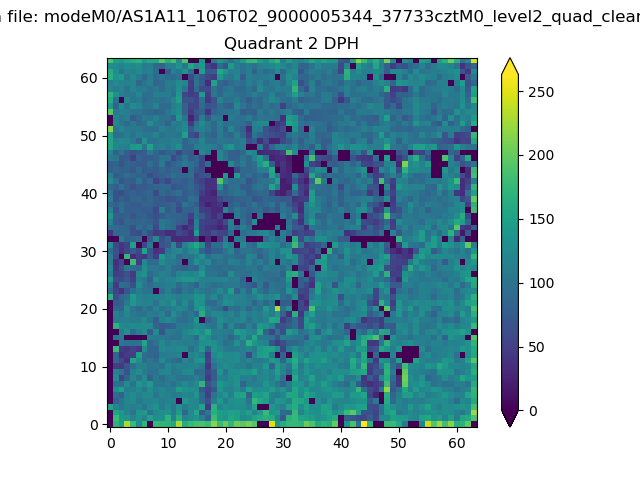
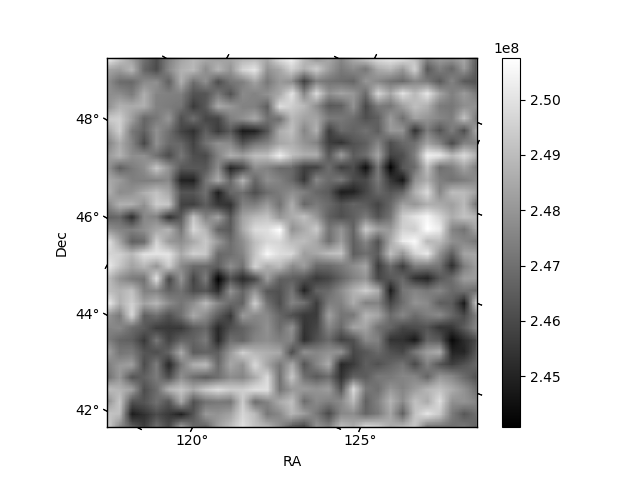
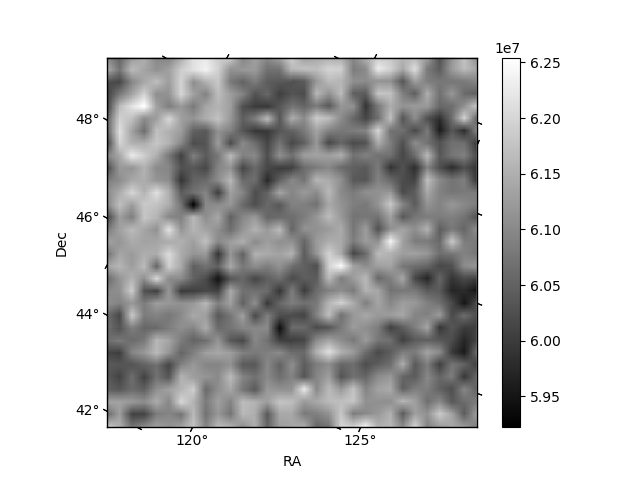
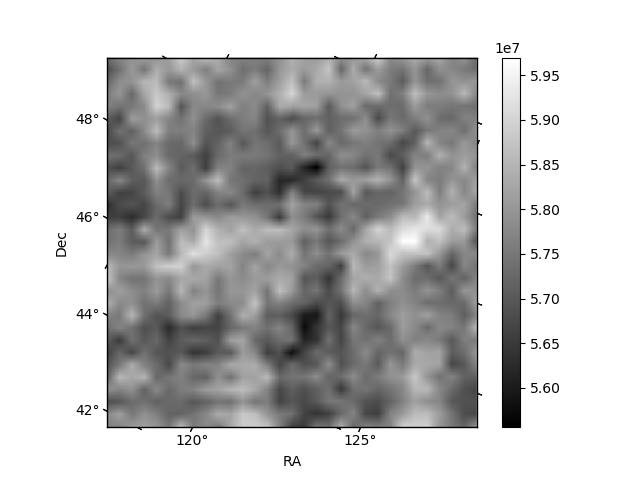
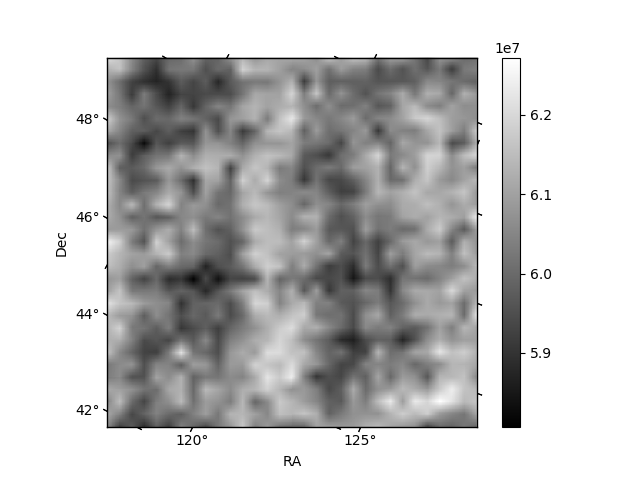
Histogram calculated using DETX and DETY for each event in the final _common_clean file
| Quadrant A | 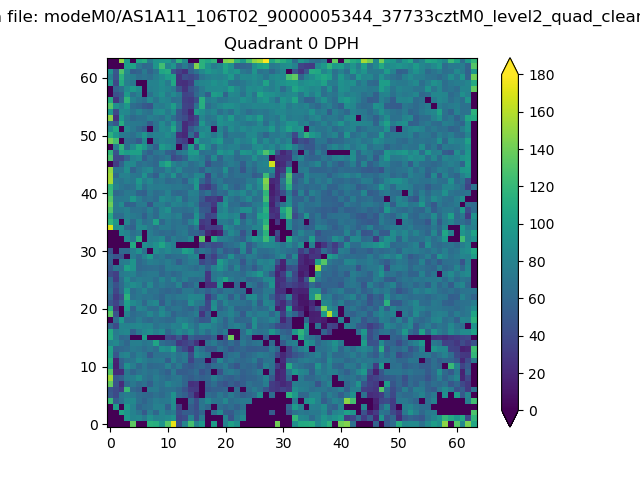 |
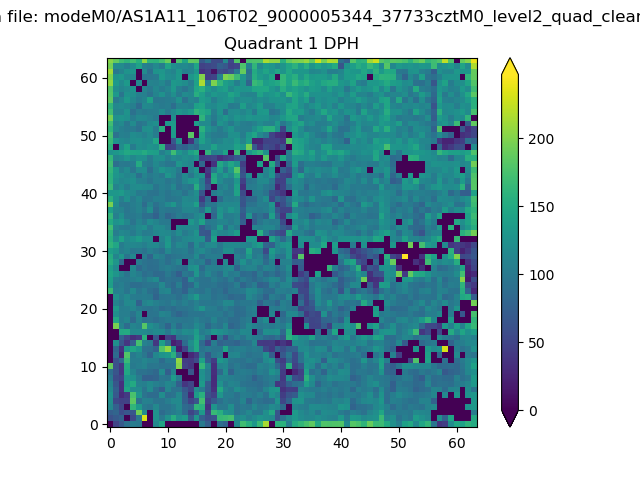 |
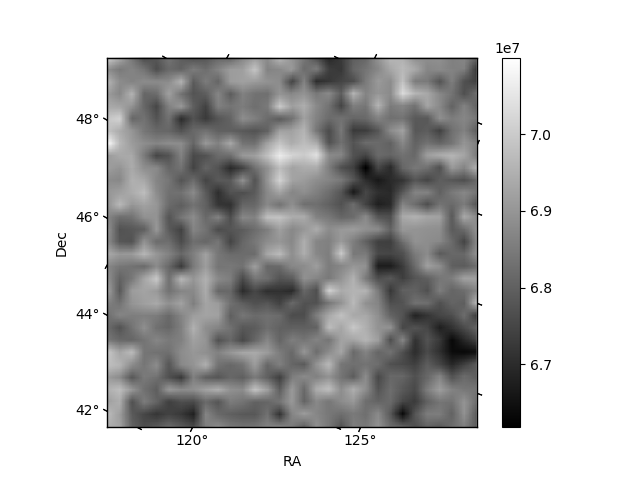
Quadrant B |
|---|---|---|---|
| Quadrant D | 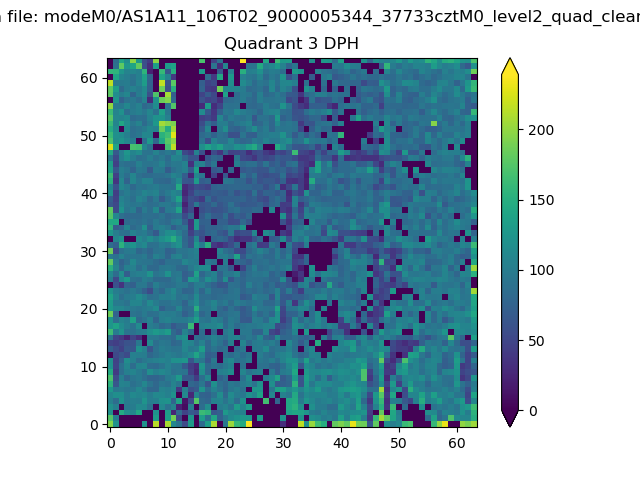 |
 |
Quadrant C |
| Plot type | Count rate plots | Images |
|---|---|---|
| Comparison with Poisson distribution Blue bars denote a histogram of data divided into 1 sec bins. Red curve is a Poisson curve with rate = median count rate of data. |
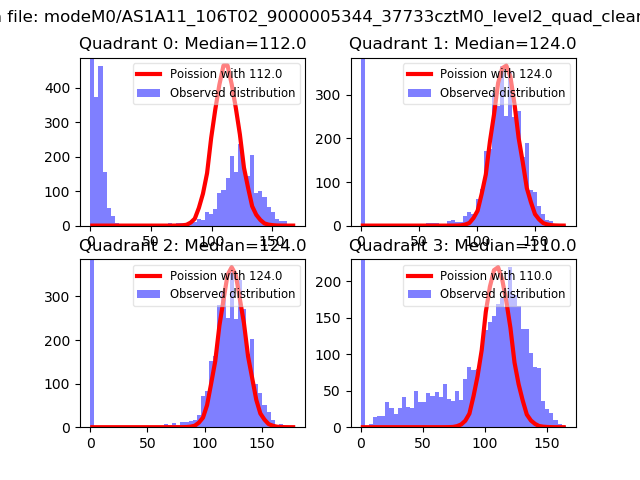 |
 |
| Quadrant-wise count rates Data is divided into 100 sec bins |
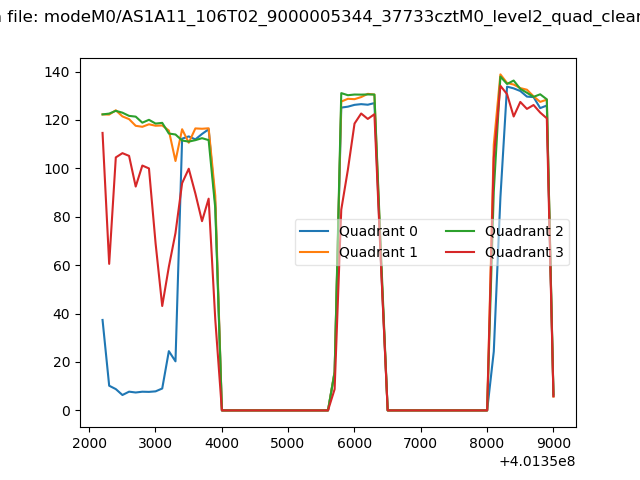 |
|
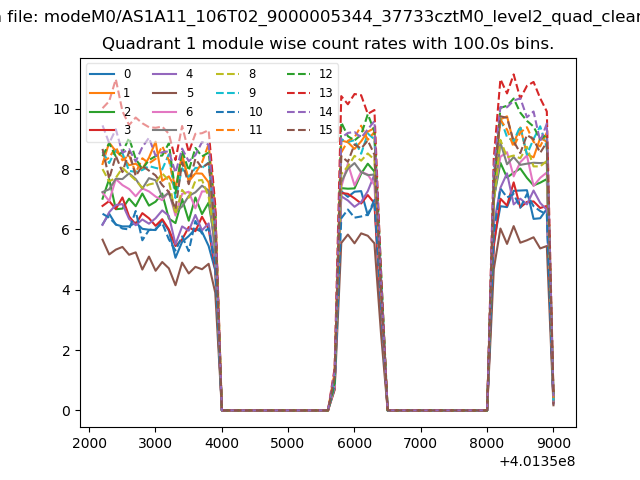
| Module-wise count rates for Quadrant A Data is divided into 100 sec bins |
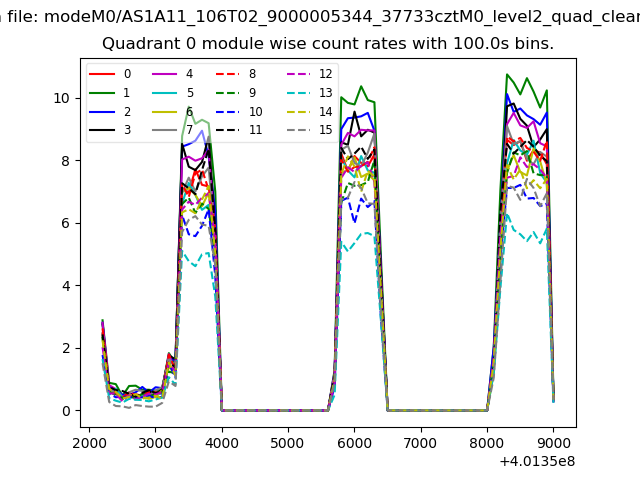 |
 |
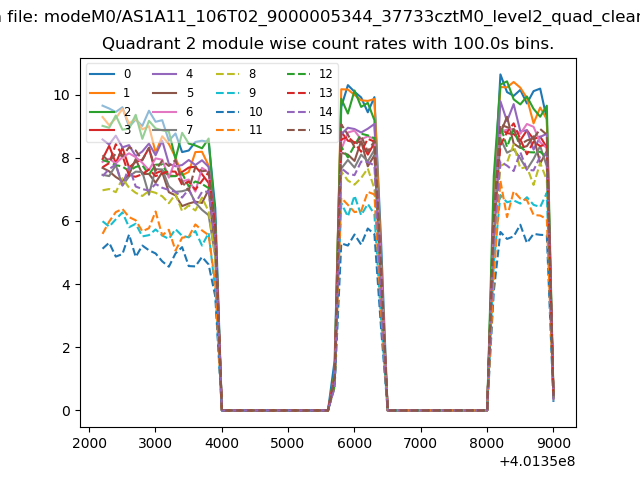
| Module-wise count rates for Quadrant B Data is divided into 100 sec bins |
 |
 |
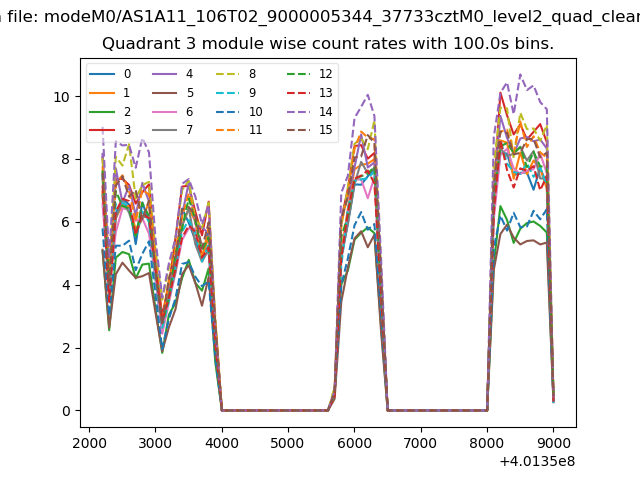
| Module-wise count rates for Quadrant C Data is divided into 100 sec bins |
 |
 |
| Module-wise count rates for Quadrant D Data is divided into 100 sec bins |
 |
 |
| Parameter | Plot |
|---|---|
| CZT HV Monitor |  |
| D_VDD | 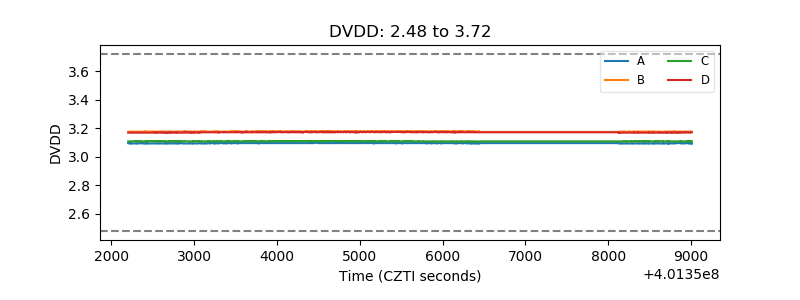 |
| Temperature 1 | 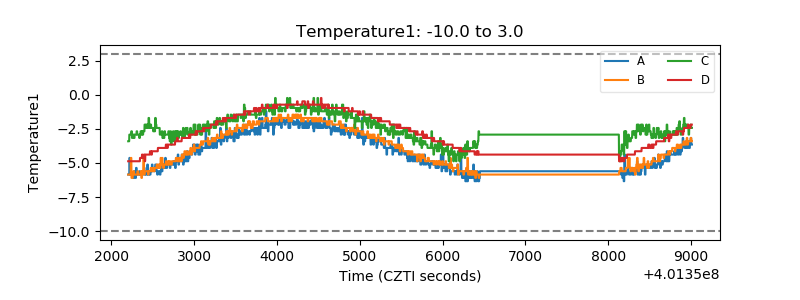 |
| Veto HV Monitor | 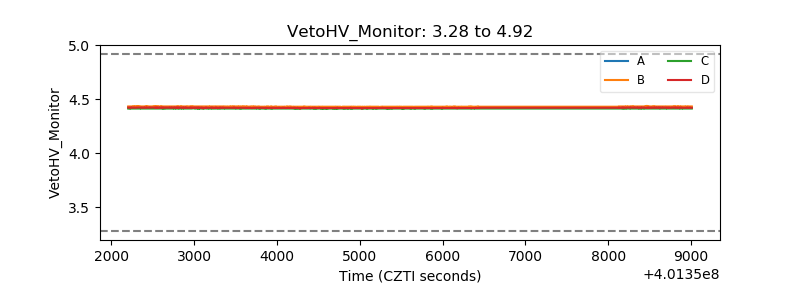 |
| Veto LLD | 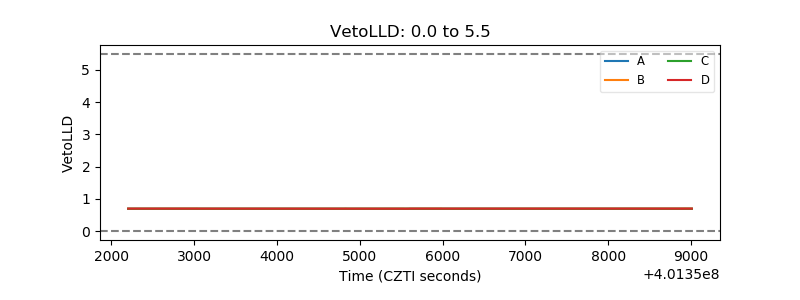 |
| Alpha Counter | 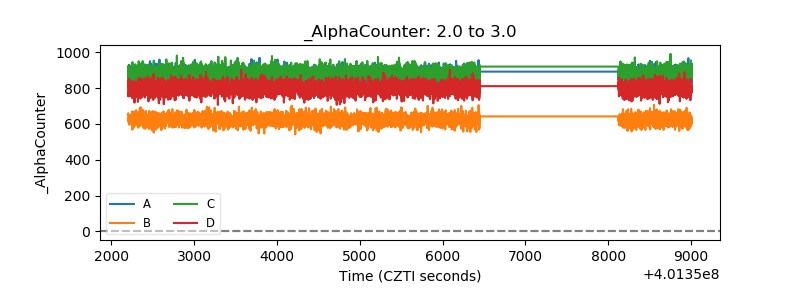 |
| _CPM_Rate | 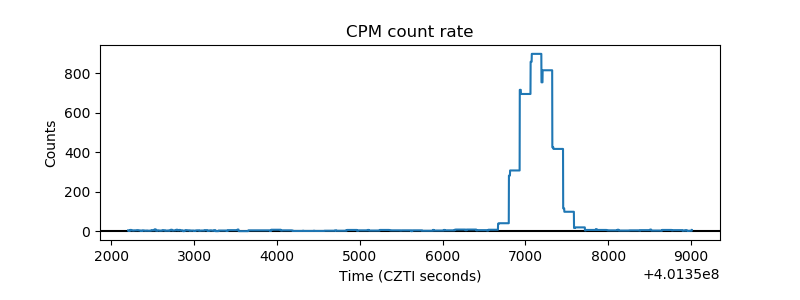 |
| CZT Counter | 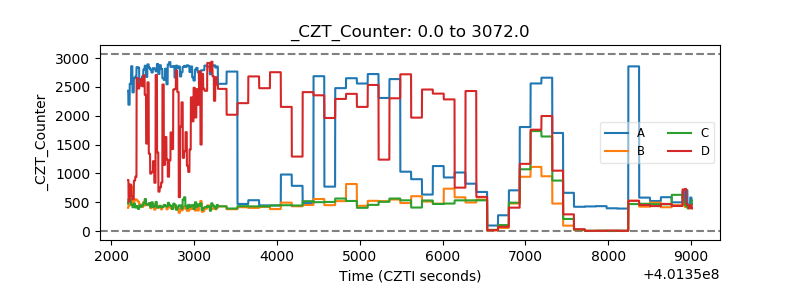 |
| +2.5 Volts monitor | 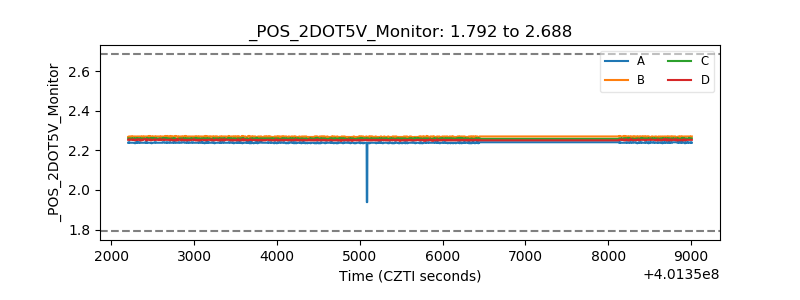 |
| +5 Volts monitor | 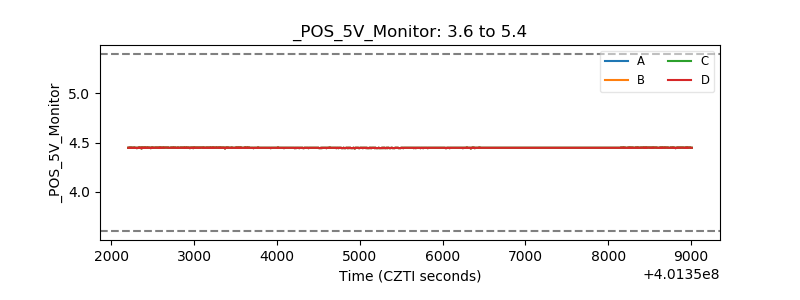 |
| _ROLL_ROT | 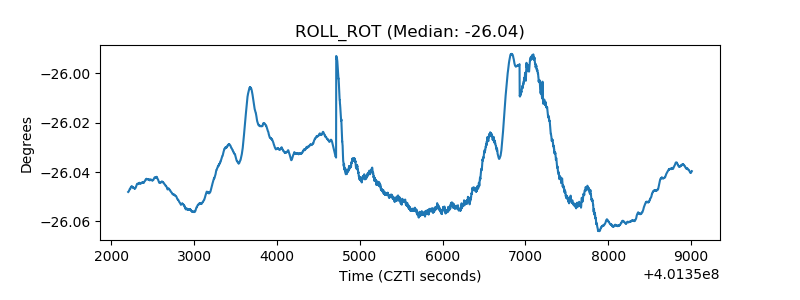 |
| _Roll_DEC | 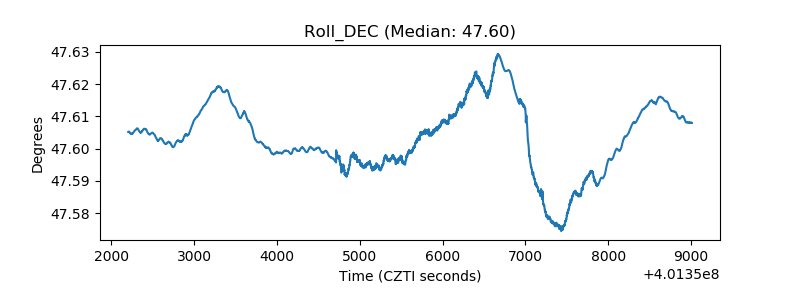 |
| _Roll_RA | 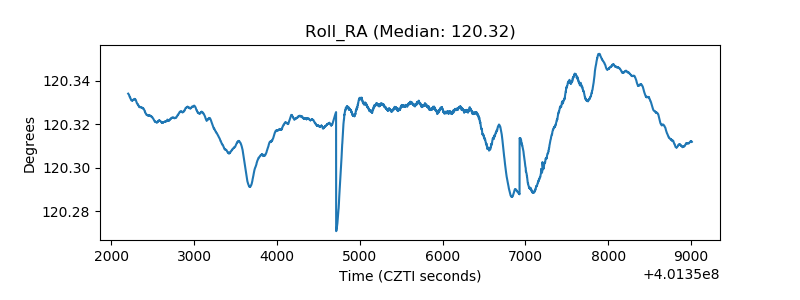 |
| Veto Counter | 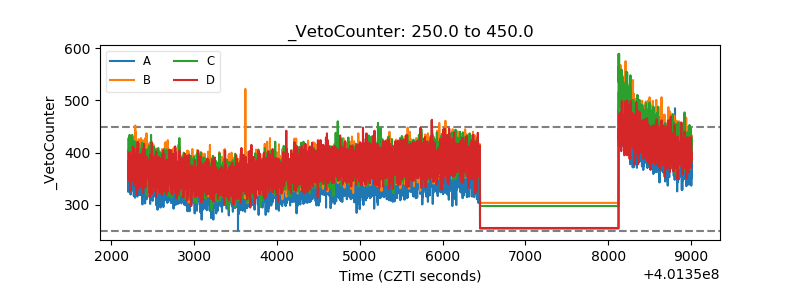 |