| Param | Original file | Final file |
|---|---|---|
| Filename | modeM0/AS1A11_106T02_9000005344_37735cztM0_level2.evt | modeM0/AS1A11_106T02_9000005344_37735cztM0_level2_quad_clean.evt |
| Size (bytes) | 664,058,880 | 64,851,840 |
| Size | 633.3 MB | 61.8 MB |
| Events in quadrant A | 6,003,135 | 291,802 |
| Events in quadrant B | 2,910,542 | 459,478 |
| Events in quadrant C | 2,786,465 | 457,455 |
| Events in quadrant D | 8,052,382 | 382,559 |
| Mode M9 | |||
|---|---|---|---|
| Quadrant | BADHDUFLAG | Total packets | Discarded packets |
| A | 0 | 24 | 0 |
| B | 0 | 24 | 0 |
| C | 0 | 24 | 0 |
| D | 0 | 25 | 0 |
| Mode SS | |||
|---|---|---|---|
| Quadrant | BADHDUFLAG | Total packets | Discarded packets |
| A | 0 | 108 | 0 |
| B | 0 | 108 | 0 |
| C | 0 | 108 | 0 |
| D | 0 | 108 | 0 |
| Mode M0 | |||
|---|---|---|---|
| Quadrant | BADHDUFLAG | Total packets | Discarded packets |
| A | 0 | 21141 | 3 |
| B | 0 | 12000 | 2 |
| C | 0 | 11413 | 2 |
| D | 0 | 27585 | 2 |
| Quadrant | Total seconds | Saturated seconds | Saturation percentage |
|---|---|---|---|
| A | 5303 | 1418 | 26.739581% |
| B | 5303 | 91 | 1.716010% |
| C | 5303 | 56 | 1.056006% |
| D | 5303 | 1875 | 35.357345% |
Noise dominated data is calculated using 1-second bins in cleaned event files. If a bin has >2000 counts, and if more than 50% of those come from <1% of pixels, then it is considered to be noise-dominated and hence unusable.
| Quadrant | # 1 sec bins | Bins with >0 counts | Bins with >2000 counts | High rate bins dominated by noise | Noise dominated (total time) | Noise dominated (detector-on time) | Marked lightcurve |
|---|---|---|---|---|---|---|---|
| A | 7096 | 5304 | 1411 | 1411 | 19.88% | 26.60% | 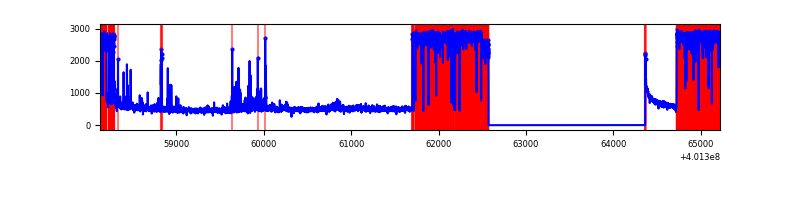 |
| B | 7095 | 5302 | 70 | 70 | 0.99% | 1.32% | 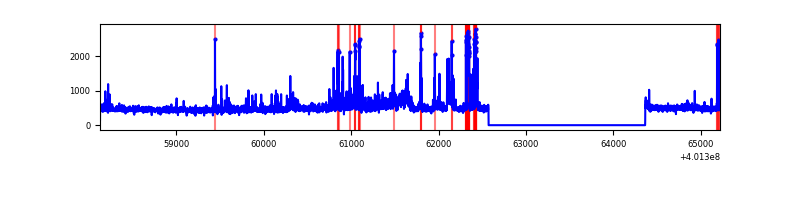 |
| C | 7095 | 5302 | 56 | 56 | 0.79% | 1.06% | 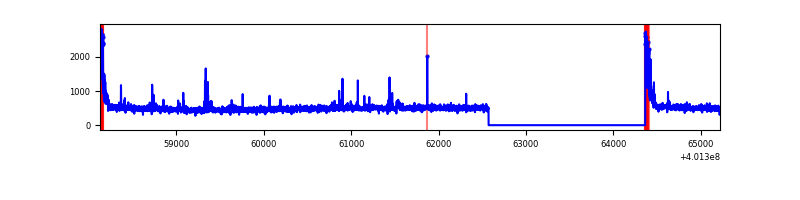 |
| D | 7095 | 5302 | 1917 | 1917 | 27.02% | 36.16% | 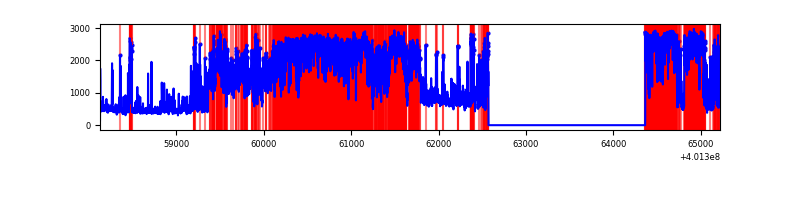 |
Top three noisy pixels from each quadrant. If the there are fewer than three noisy pixels in the level2.evt file, extra rows are filled as -1
| Pixel properties | Quadrant properties | ||||||
|---|---|---|---|---|---|---|---|
| Quadrant | DetID | PixID | Counts | Sigma | Mean | Median | Sigma |
| A | 15 | 222 | 3782018 | 38960.45 | 480 | 471 | 97.1 |
| A | 10 | 83 | 267547 | 2751.63 | 480 | 471 | 97.1 |
| A | 9 | 143 | 59155 | 604.61 | 480 | 471 | 97.1 |
| B | 5 | 255 | 171541 | 1502.31 | 602 | 586 | 113.8 |
| B | 4 | 81 | 118729 | 1038.21 | 602 | 586 | 113.8 |
| B | 0 | 189 | 108266 | 946.26 | 602 | 586 | 113.8 |
| C | 15 | 214 | 229297 | 1663.53 | 592 | 597 | 137.5 |
| C | 0 | 10 | 190653 | 1382.44 | 592 | 597 | 137.5 |
| C | 0 | 207 | 22165 | 156.88 | 592 | 597 | 137.5 |
| D | 7 | 223 | 2182334 | 17407.28 | 513 | 497 | 125.3 |
| D | 12 | 227 | 1518211 | 12108.73 | 513 | 497 | 125.3 |
| D | 2 | 249 | 1392601 | 11106.58 | 513 | 497 | 125.3 |
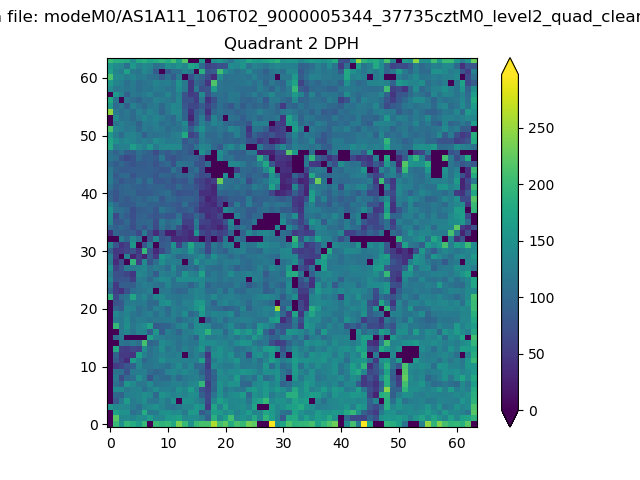
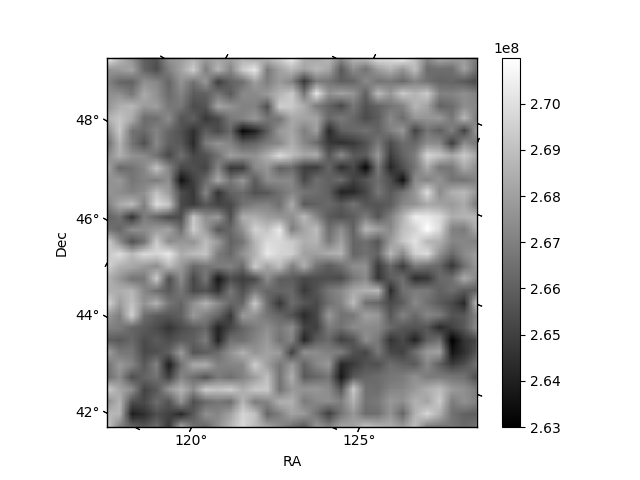
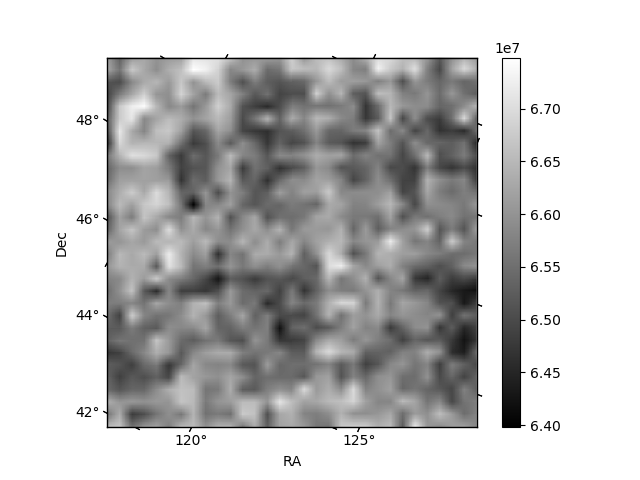
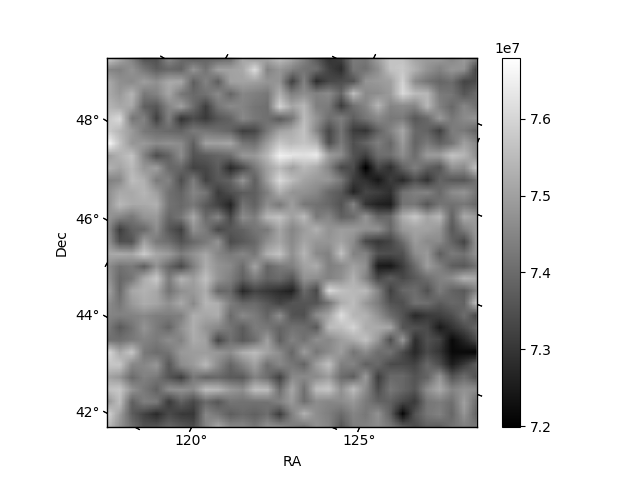
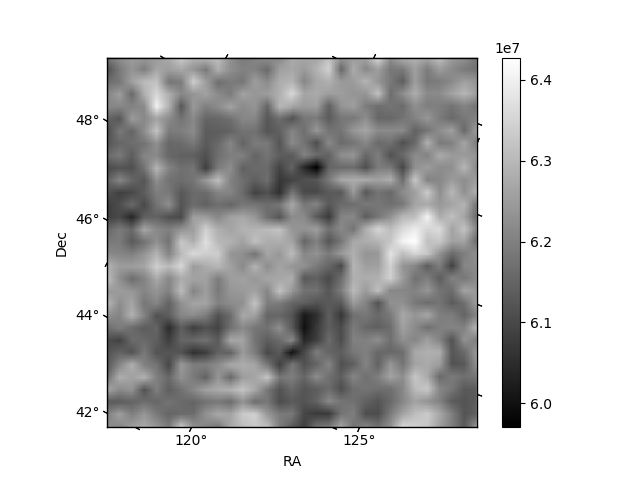
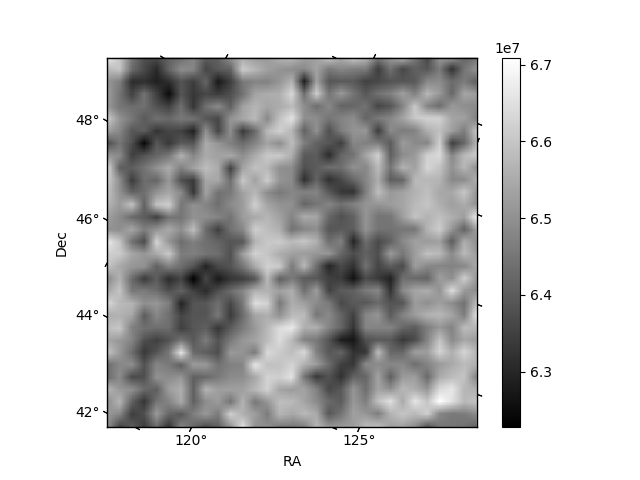
Histogram calculated using DETX and DETY for each event in the final _common_clean file
| Quadrant A | 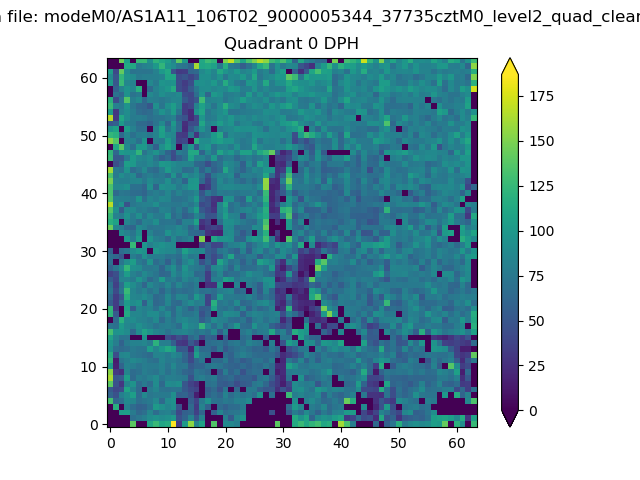 |
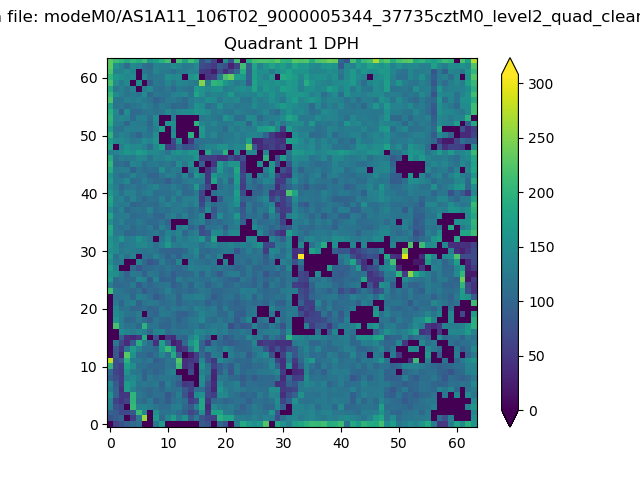 |
Quadrant B |
|---|---|---|---|
| Quadrant D | 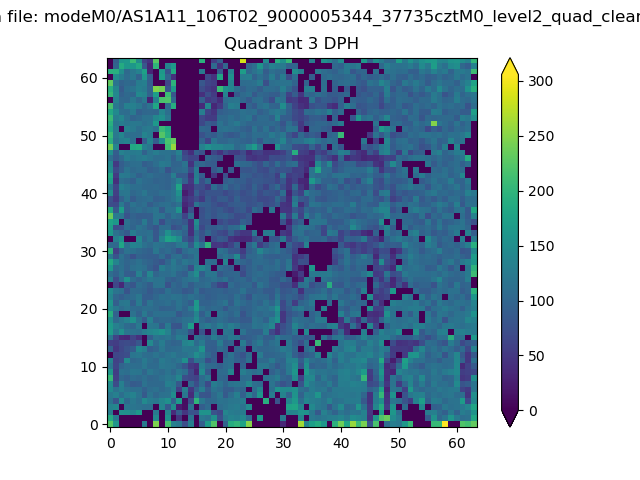 |
 |
Quadrant C |
| Plot type | Count rate plots | Images |
|---|---|---|
| Comparison with Poisson distribution Blue bars denote a histogram of data divided into 1 sec bins. Red curve is a Poisson curve with rate = median count rate of data. |
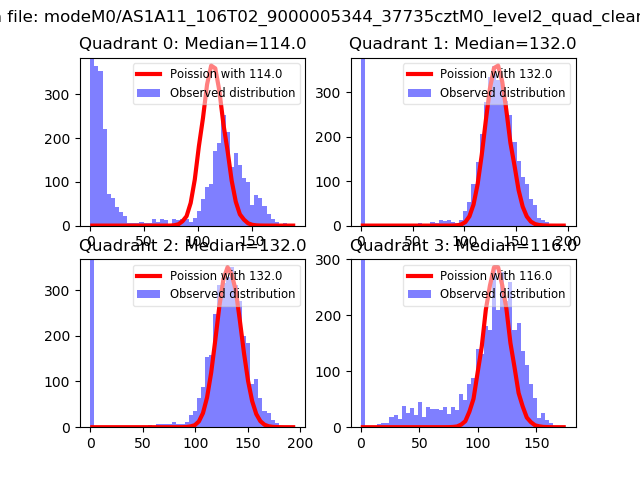 |
 |
| Quadrant-wise count rates Data is divided into 100 sec bins |
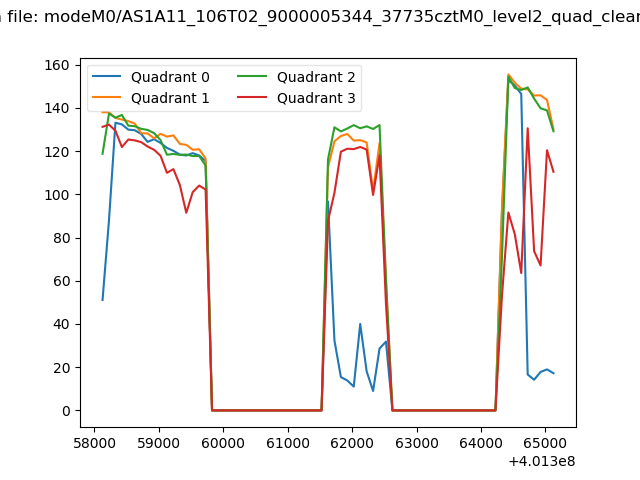 |
|
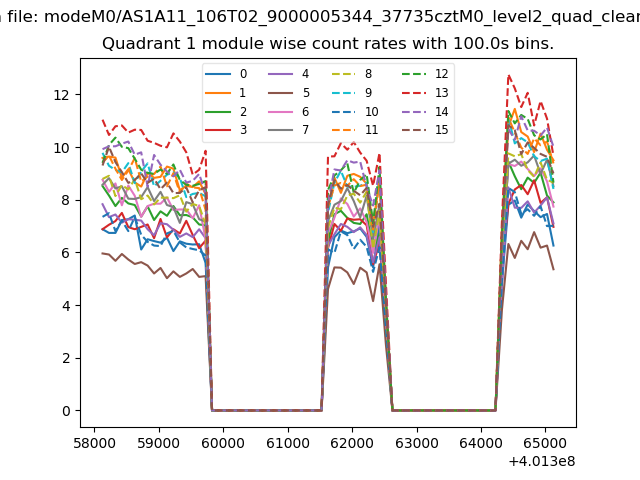
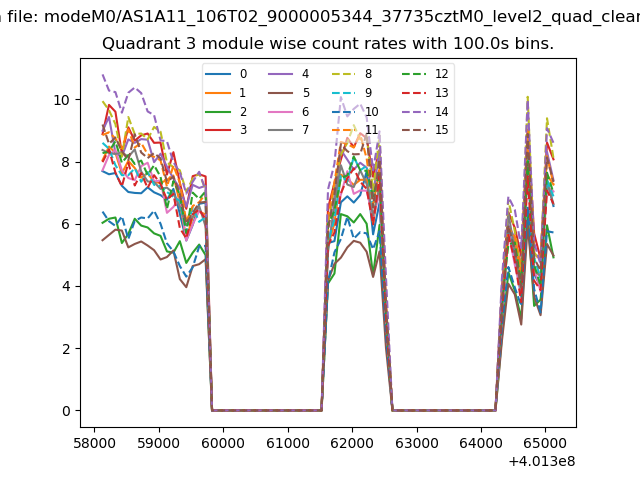
| Module-wise count rates for Quadrant A Data is divided into 100 sec bins |
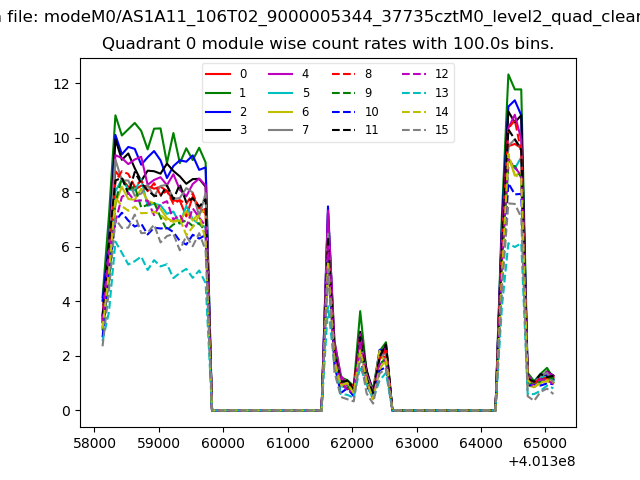 |
 |
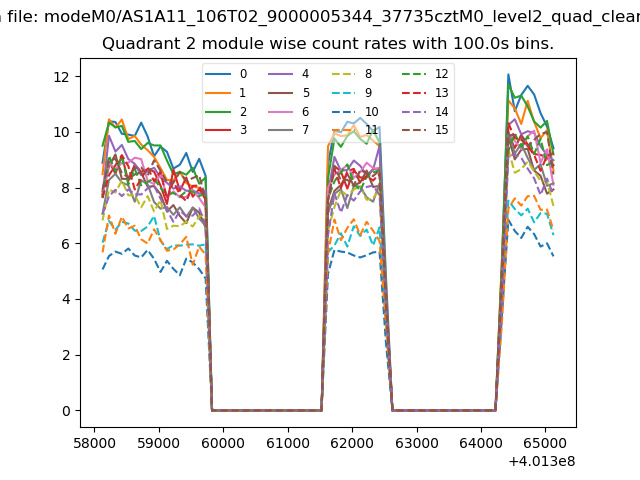
| Module-wise count rates for Quadrant B Data is divided into 100 sec bins |
 |
 |
| Module-wise count rates for Quadrant C Data is divided into 100 sec bins |
 |
 |
| Module-wise count rates for Quadrant D Data is divided into 100 sec bins |
 |
 |
| Parameter | Plot |
|---|---|
| CZT HV Monitor | 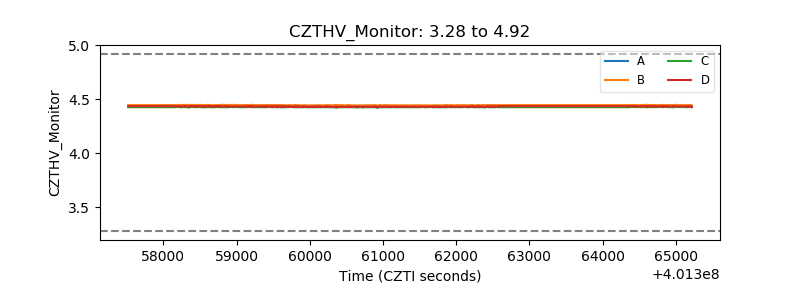 |
| D_VDD | 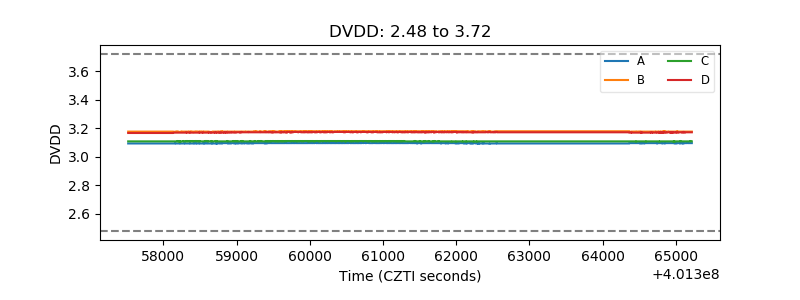 |
| Temperature 1 | 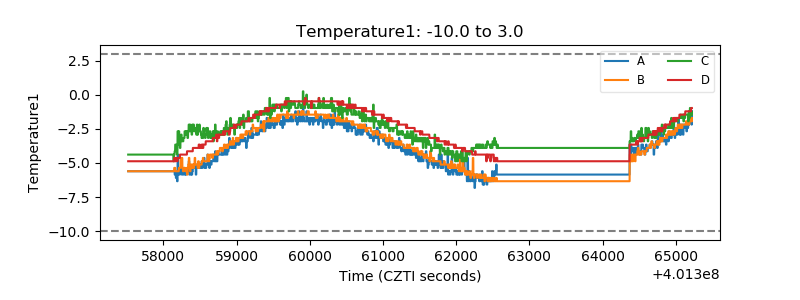 |
| Veto HV Monitor | 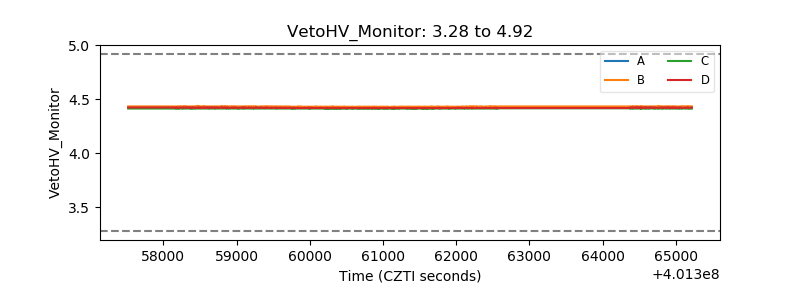 |
| Veto LLD | 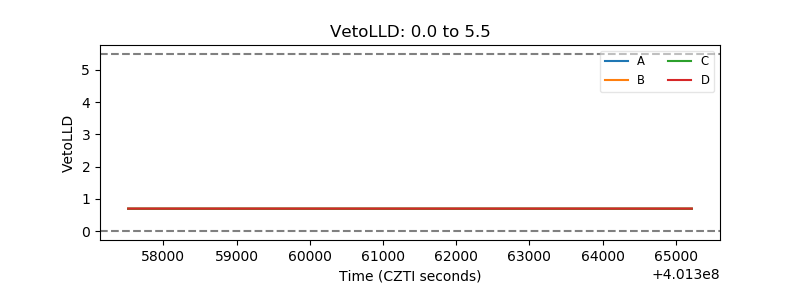 |
| Alpha Counter | 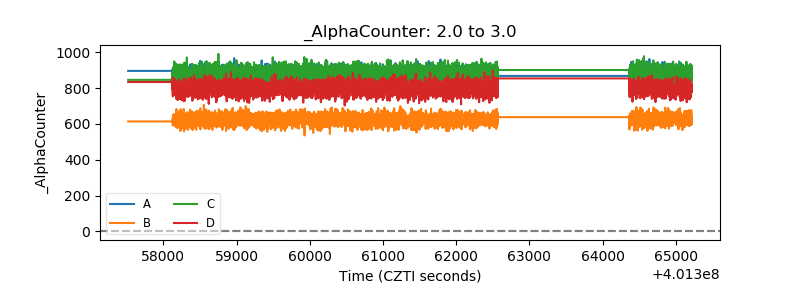 |
| _CPM_Rate | 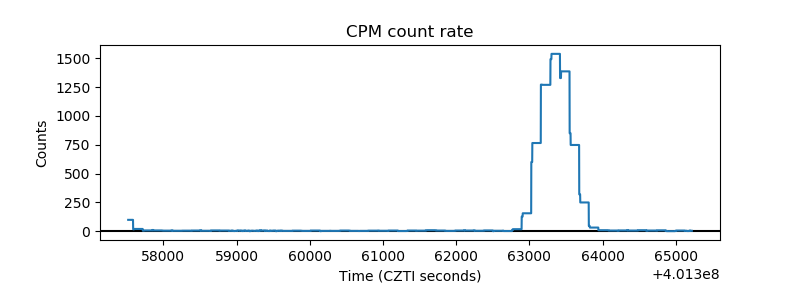 |
| CZT Counter | 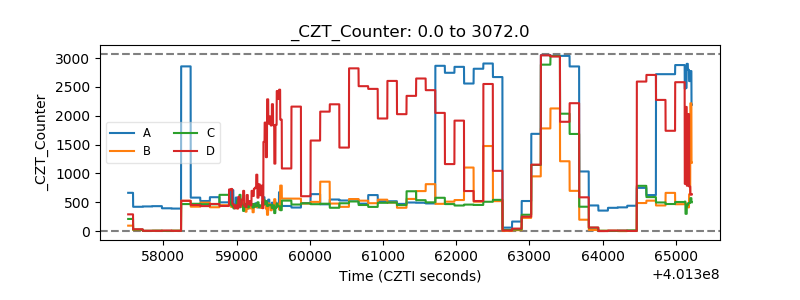 |
| +2.5 Volts monitor | 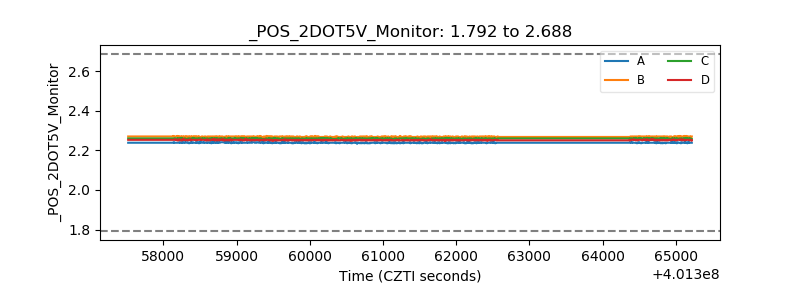 |
| +5 Volts monitor | 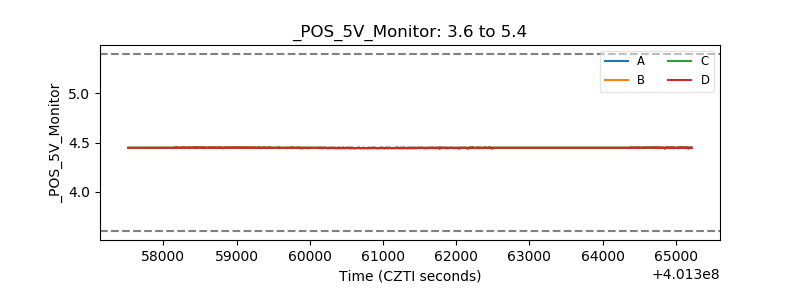 |
| _ROLL_ROT | 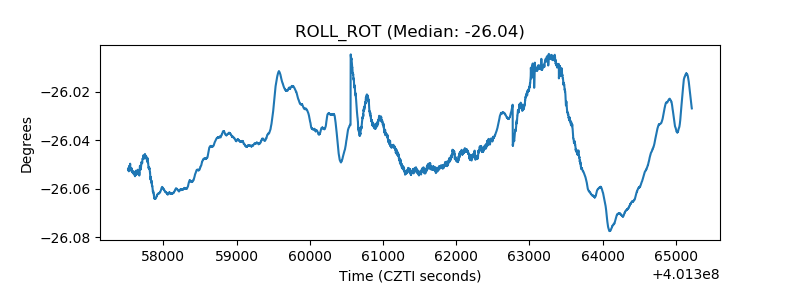 |
| _Roll_DEC | 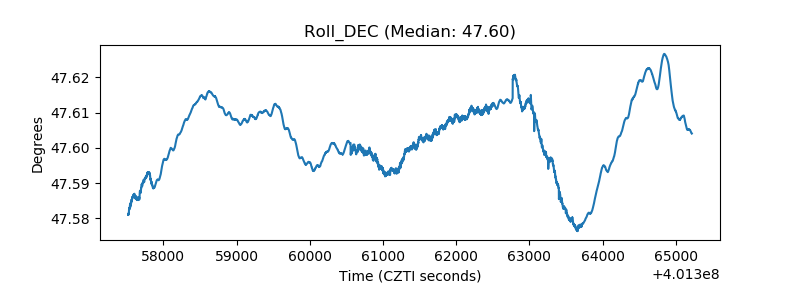 |
| _Roll_RA | 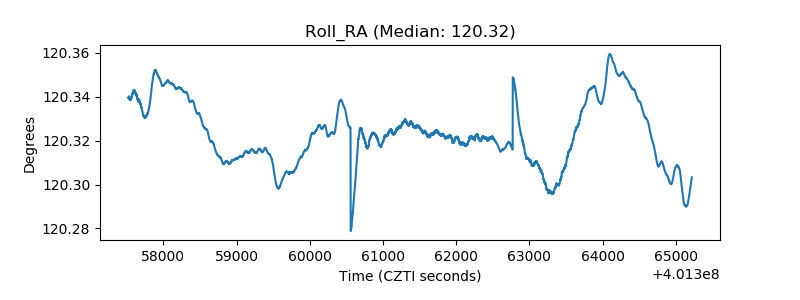 |
| Veto Counter | 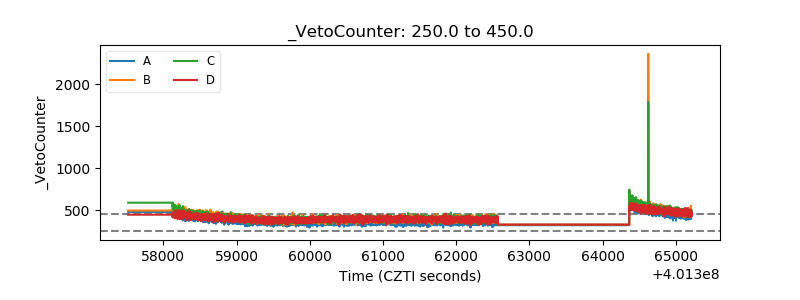 |