| Param | Original file | Final file |
|---|---|---|
| Filename | modeM0/AS1A11_106T02_9000005344_37736cztM0_level2.evt | modeM0/AS1A11_106T02_9000005344_37736cztM0_level2_quad_clean.evt |
| Size (bytes) | 755,732,160 | 64,365,120 |
| Size | 720.7 MB | 61.4 MB |
| Events in quadrant A | 8,832,646 | 226,856 |
| Events in quadrant B | 3,170,339 | 479,313 |
| Events in quadrant C | 2,886,447 | 481,527 |
| Events in quadrant D | 7,645,084 | 393,436 |
| Mode M9 | |||
|---|---|---|---|
| Quadrant | BADHDUFLAG | Total packets | Discarded packets |
| A | 0 | 21 | 0 |
| B | 0 | 21 | 0 |
| C | 0 | 21 | 0 |
| D | 0 | 22 | 0 |
| Mode SS | |||
|---|---|---|---|
| Quadrant | BADHDUFLAG | Total packets | Discarded packets |
| A | 0 | 106 | 0 |
| B | 0 | 106 | 0 |
| C | 0 | 106 | 0 |
| D | 0 | 106 | 0 |
| Mode M0 | |||
|---|---|---|---|
| Quadrant | BADHDUFLAG | Total packets | Discarded packets |
| A | 0 | 29585 | 3 |
| B | 0 | 12535 | 2 |
| C | 0 | 11448 | 2 |
| D | 0 | 26255 | 2 |
| Quadrant | Total seconds | Saturated seconds | Saturation percentage |
|---|---|---|---|
| A | 5230 | 2696 | 51.548757% |
| B | 5230 | 171 | 3.269598% |
| C | 5230 | 41 | 0.783939% |
| D | 5230 | 1876 | 35.869981% |
Noise dominated data is calculated using 1-second bins in cleaned event files. If a bin has >2000 counts, and if more than 50% of those come from <1% of pixels, then it is considered to be noise-dominated and hence unusable.
| Quadrant | # 1 sec bins | Bins with >0 counts | Bins with >2000 counts | High rate bins dominated by noise | Noise dominated (total time) | Noise dominated (detector-on time) | Marked lightcurve |
|---|---|---|---|---|---|---|---|
| A | 7143 | 5230 | 2663 | 2663 | 37.28% | 50.92% | 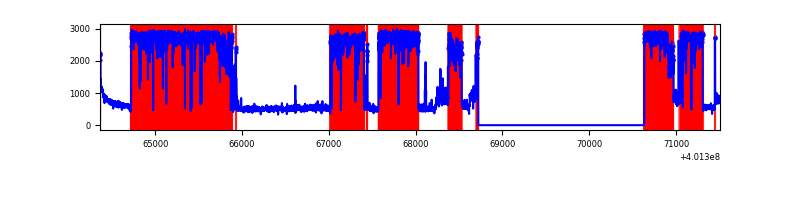 |
| B | 7142 | 5229 | 143 | 143 | 2.00% | 2.73% | 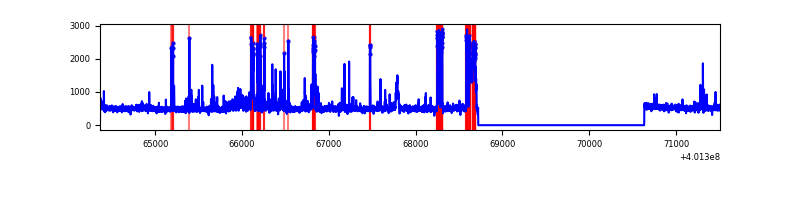 |
| C | 7142 | 5229 | 43 | 43 | 0.60% | 0.82% | 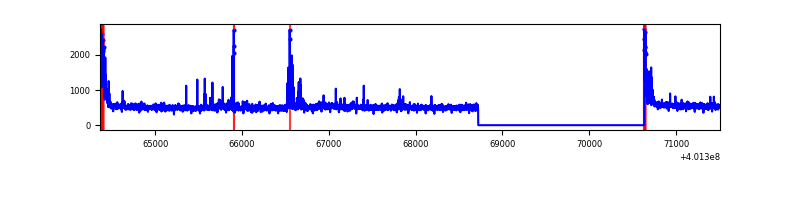 |
| D | 7142 | 5229 | 1869 | 1869 | 26.17% | 35.74% | 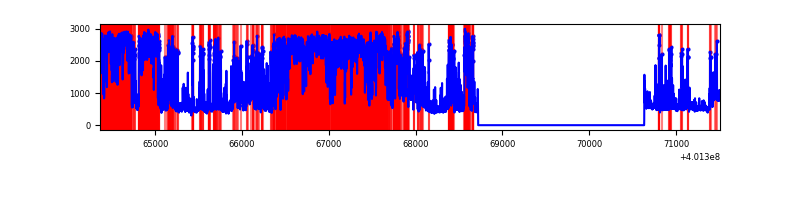 |
Top three noisy pixels from each quadrant. If the there are fewer than three noisy pixels in the level2.evt file, extra rows are filled as -1
| Pixel properties | Quadrant properties | ||||||
|---|---|---|---|---|---|---|---|
| Quadrant | DetID | PixID | Counts | Sigma | Mean | Median | Sigma |
| A | 15 | 222 | 7079035 | 92737.27 | 378 | 371 | 76.3 |
| A | 10 | 83 | 215826 | 2822.67 | 378 | 371 | 76.3 |
| A | 9 | 143 | 36283 | 470.48 | 378 | 371 | 76.3 |
| B | 4 | 81 | 309960 | 2698.66 | 613 | 597 | 114.6 |
| B | 5 | 172 | 107945 | 936.43 | 613 | 597 | 114.6 |
| B | 5 | 255 | 96363 | 835.39 | 613 | 597 | 114.6 |
| C | 15 | 214 | 227504 | 1622.21 | 611 | 617 | 139.9 |
| C | 0 | 10 | 158847 | 1131.32 | 611 | 617 | 139.9 |
| C | 1 | 23 | 46720 | 329.63 | 611 | 617 | 139.9 |
| D | 2 | 249 | 2662396 | 21049.59 | 520 | 507 | 126.5 |
| D | 12 | 227 | 2221961 | 17566.73 | 520 | 507 | 126.5 |
| D | 2 | 153 | 220014 | 1735.81 | 520 | 507 | 126.5 |
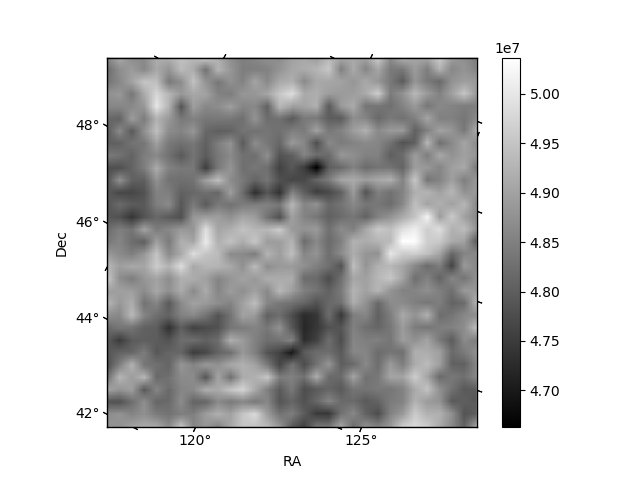
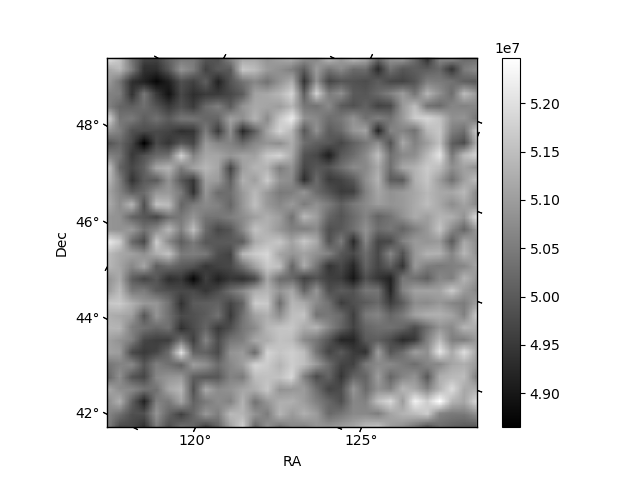
Histogram calculated using DETX and DETY for each event in the final _common_clean file
| Quadrant A | 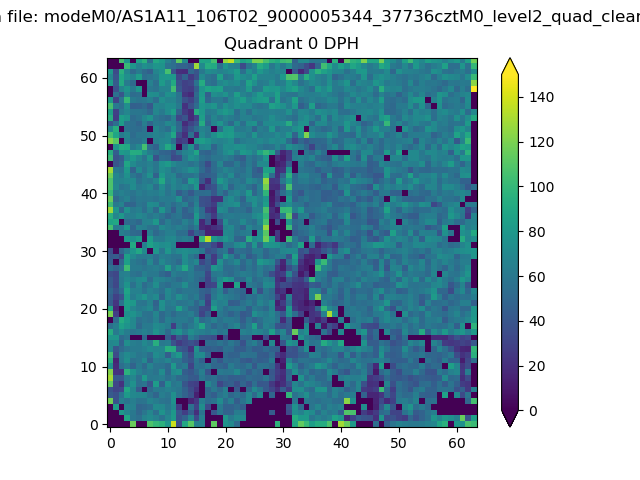 |
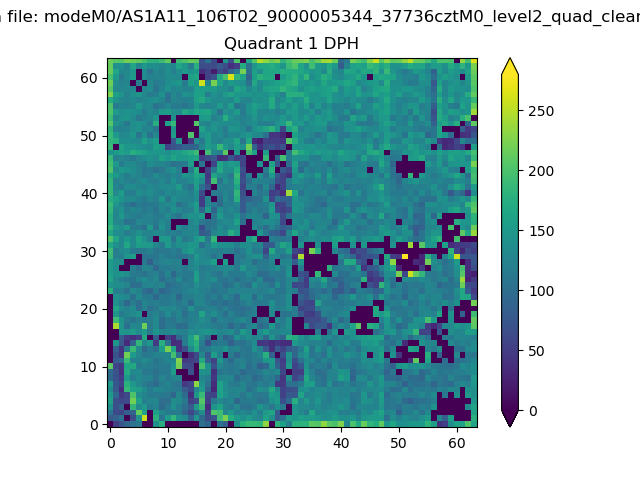 |
Quadrant B |
|---|---|---|---|
| Quadrant D | 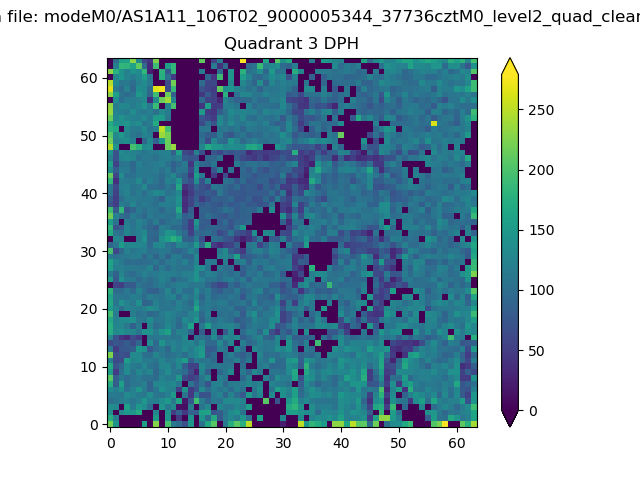 |
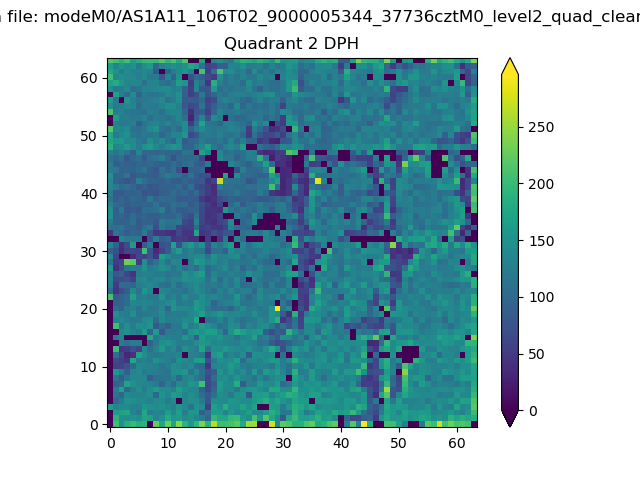 |
Quadrant C |
| Plot type | Count rate plots | Images |
|---|---|---|
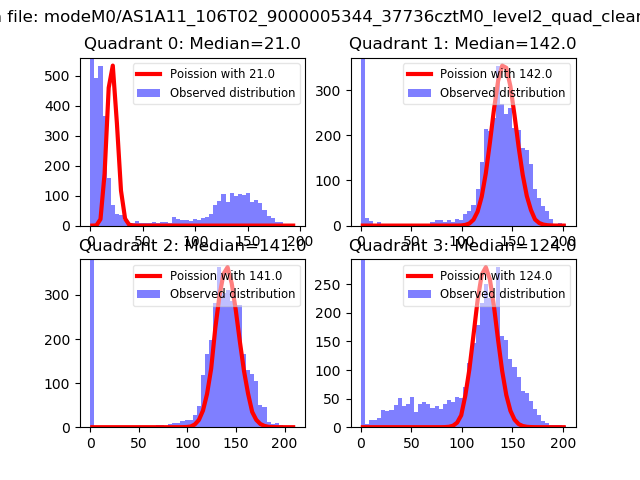
| Comparison with Poisson distribution Blue bars denote a histogram of data divided into 1 sec bins. Red curve is a Poisson curve with rate = median count rate of data. |
 |
 |
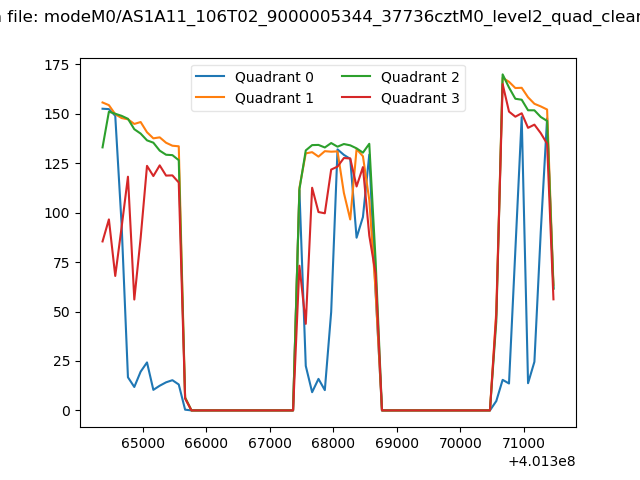
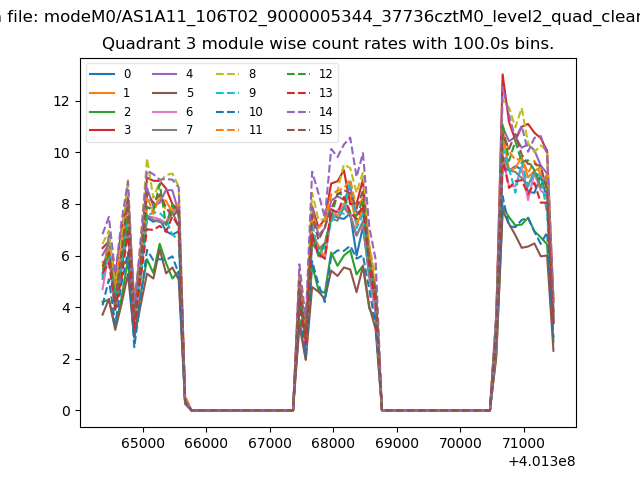
| Quadrant-wise count rates Data is divided into 100 sec bins |
 |
|
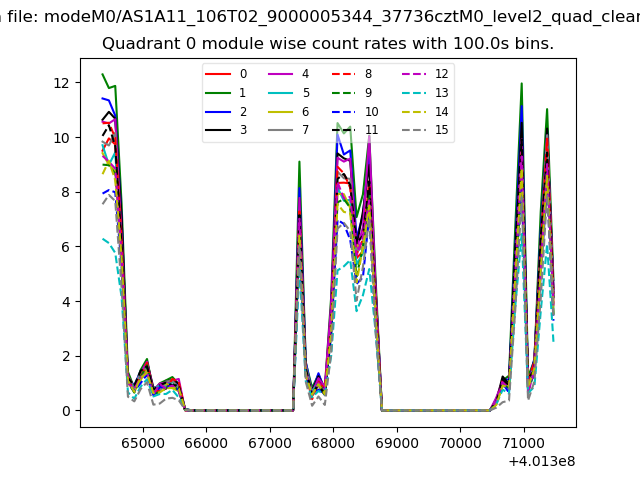
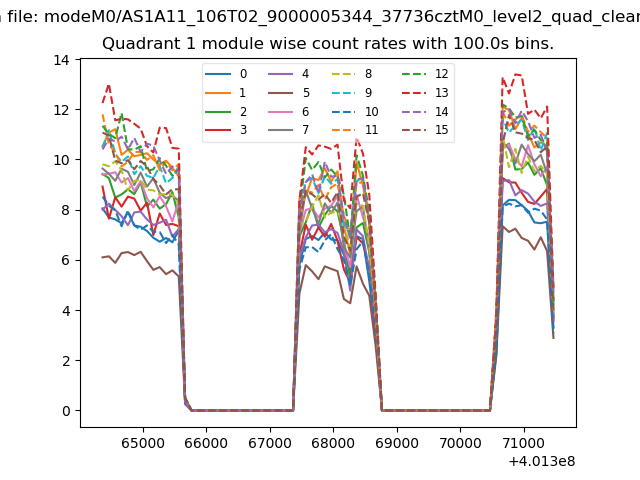
| Module-wise count rates for Quadrant A Data is divided into 100 sec bins |
 |
 |
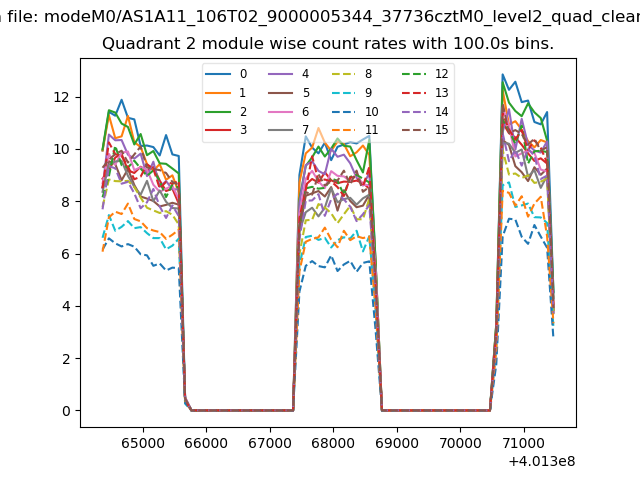
| Module-wise count rates for Quadrant B Data is divided into 100 sec bins |
 |
 |
| Module-wise count rates for Quadrant C Data is divided into 100 sec bins |
 |
 |
| Module-wise count rates for Quadrant D Data is divided into 100 sec bins |
 |
 |
| Parameter | Plot |
|---|---|
| CZT HV Monitor | 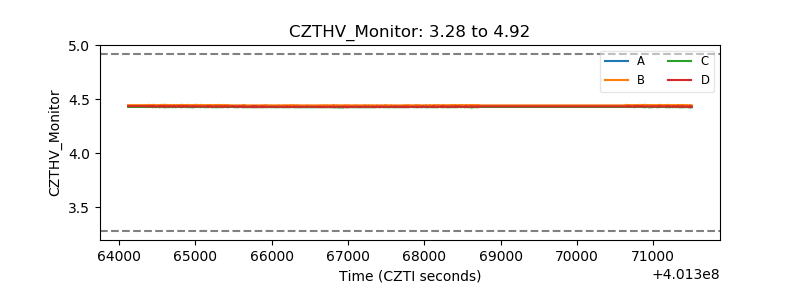 |
| D_VDD | 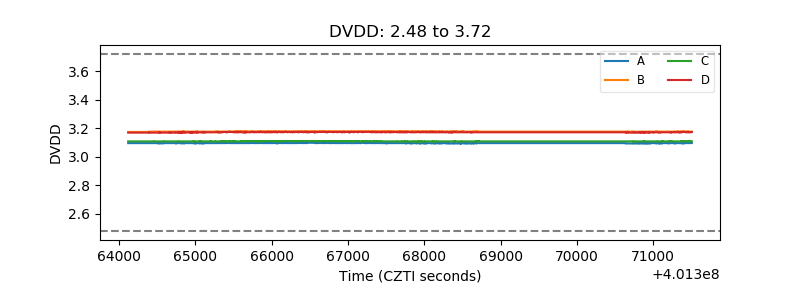 |
| Temperature 1 | 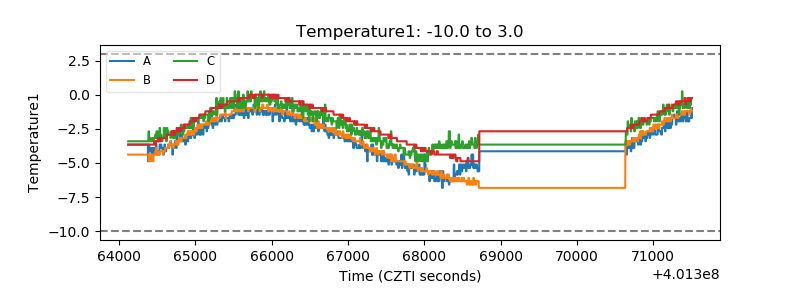 |
| Veto HV Monitor | 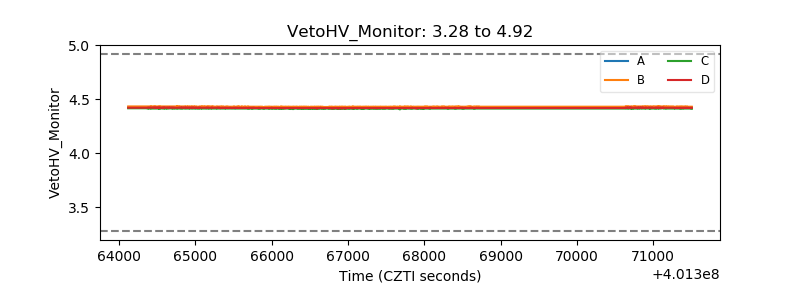 |
| Veto LLD | 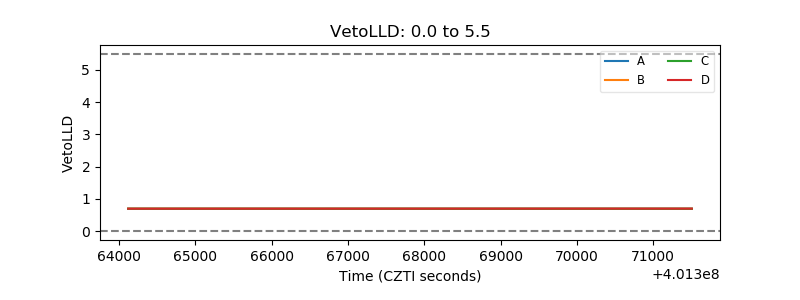 |
| Alpha Counter | 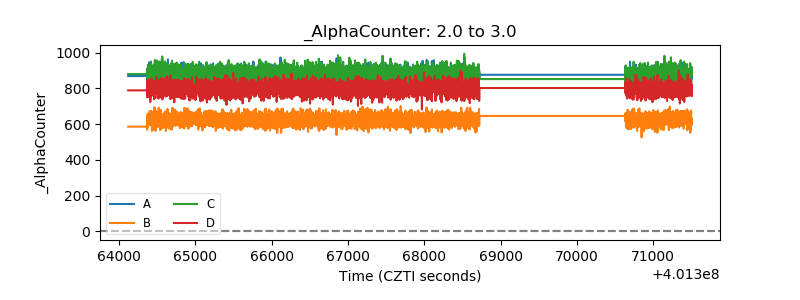 |
| _CPM_Rate | 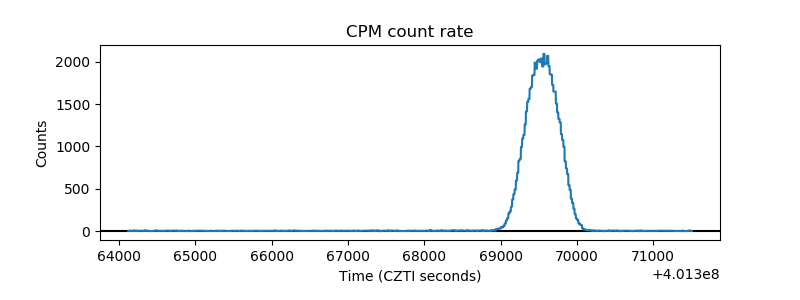 |
| CZT Counter | 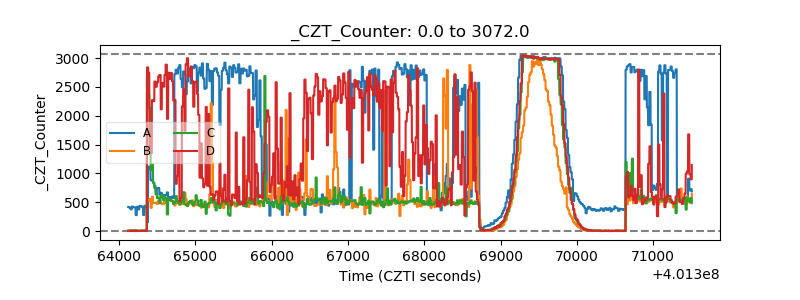 |
| +2.5 Volts monitor | 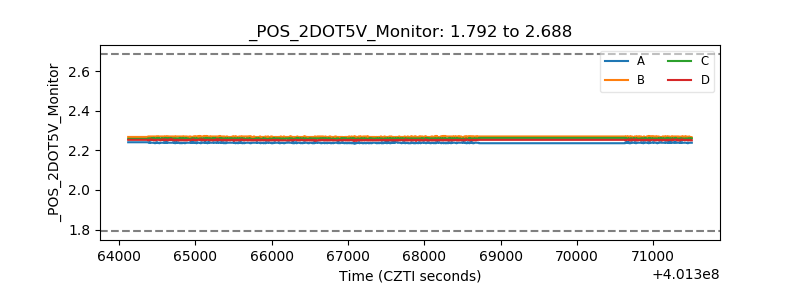 |
| +5 Volts monitor | 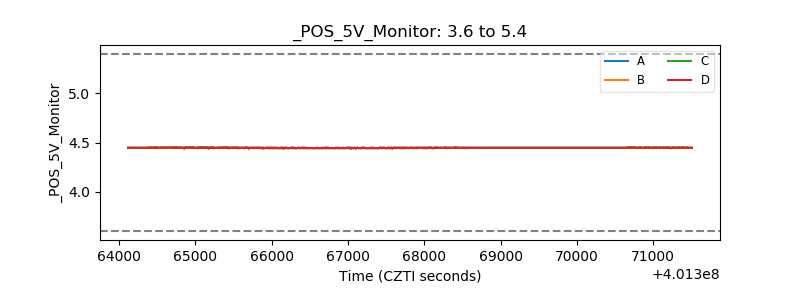 |
| _ROLL_ROT |  |
| _Roll_DEC | 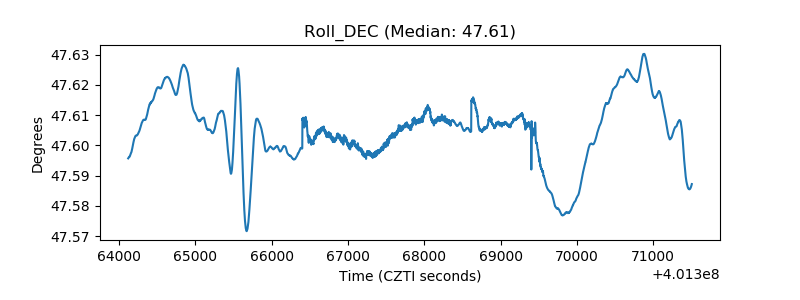 |
| _Roll_RA | 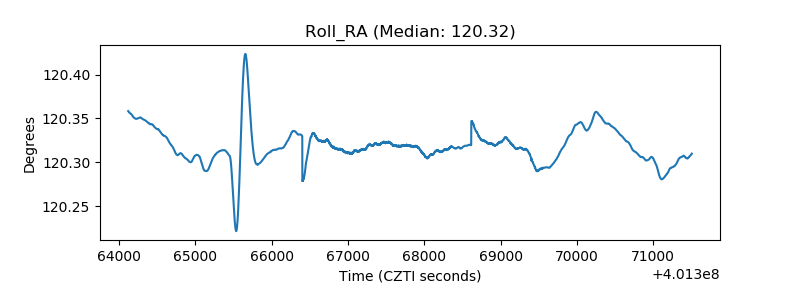 |
| Veto Counter | 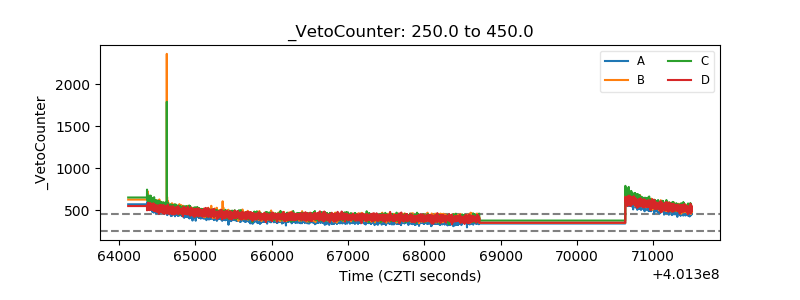 |