| Param | Original file | Final file |
|---|---|---|
| Filename | modeM0/AS1A11_106T02_9000005344_37738cztM0_level2.evt | modeM0/AS1A11_106T02_9000005344_37738cztM0_level2_quad_clean.evt |
| Size (bytes) | 481,590,720 | 56,396,160 |
| Size | 459.3 MB | 53.8 MB |
| Events in quadrant A | 3,666,581 | 339,751 |
| Events in quadrant B | 3,112,095 | 340,131 |
| Events in quadrant C | 2,987,712 | 345,240 |
| Events in quadrant D | 4,463,504 | 315,078 |
| Mode M9 | |||
|---|---|---|---|
| Quadrant | BADHDUFLAG | Total packets | Discarded packets |
| A | 0 | 30 | 0 |
| B | 0 | 30 | 0 |
| C | 0 | 30 | 0 |
| D | 0 | 31 | 0 |
| Mode SS | |||
|---|---|---|---|
| Quadrant | BADHDUFLAG | Total packets | Discarded packets |
| A | 0 | 108 | 0 |
| B | 0 | 108 | 0 |
| C | 0 | 108 | 0 |
| D | 0 | 108 | 0 |
| Mode M0 | |||
|---|---|---|---|
| Quadrant | BADHDUFLAG | Total packets | Discarded packets |
| A | 0 | 14327 | 3 |
| B | 0 | 12342 | 2 |
| C | 0 | 11755 | 2 |
| D | 0 | 16667 | 2 |
| Quadrant | Total seconds | Saturated seconds | Saturation percentage |
|---|---|---|---|
| A | 5236 | 102 | 1.948052% |
| B | 5236 | 99 | 1.890756% |
| C | 5236 | 62 | 1.184110% |
| D | 5236 | 392 | 7.486631% |
Noise dominated data is calculated using 1-second bins in cleaned event files. If a bin has >2000 counts, and if more than 50% of those come from <1% of pixels, then it is considered to be noise-dominated and hence unusable.
| Quadrant | # 1 sec bins | Bins with >0 counts | Bins with >2000 counts | High rate bins dominated by noise | Noise dominated (total time) | Noise dominated (detector-on time) | Marked lightcurve |
|---|---|---|---|---|---|---|---|
| A | 7330 | 5236 | 93 | 93 | 1.27% | 1.78% | 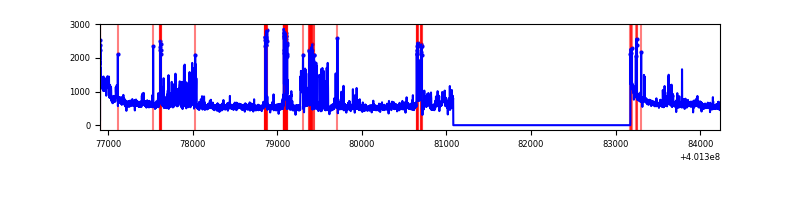 |
| B | 7329 | 5235 | 85 | 85 | 1.16% | 1.62% | 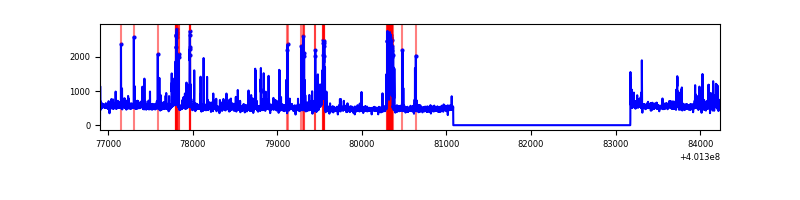 |
| C | 7329 | 5235 | 56 | 56 | 0.76% | 1.07% | 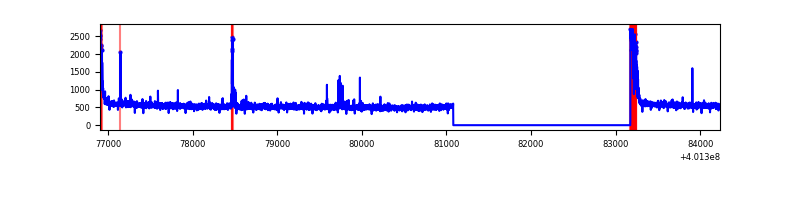 |
| D | 7329 | 5235 | 379 | 379 | 5.17% | 7.24% | 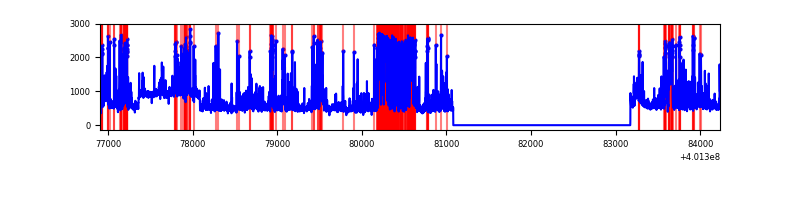 |
Top three noisy pixels from each quadrant. If the there are fewer than three noisy pixels in the level2.evt file, extra rows are filled as -1
| Pixel properties | Quadrant properties | ||||||
|---|---|---|---|---|---|---|---|
| Quadrant | DetID | PixID | Counts | Sigma | Mean | Median | Sigma |
| A | 15 | 222 | 700818 | 5329.58 | 659 | 649 | 131.4 |
| A | 10 | 83 | 353689 | 2687.28 | 659 | 649 | 131.4 |
| A | 12 | 189 | 15339 | 111.82 | 659 | 649 | 131.4 |
| B | 4 | 81 | 154157 | 1283.92 | 648 | 633 | 119.6 |
| B | 5 | 255 | 122034 | 1015.27 | 648 | 633 | 119.6 |
| B | 4 | 232 | 59023 | 488.31 | 648 | 633 | 119.6 |
| C | 15 | 214 | 224395 | 1523.88 | 643 | 649 | 146.8 |
| C | 0 | 10 | 177442 | 1204.09 | 643 | 649 | 146.8 |
| C | 14 | 254 | 29797 | 198.52 | 643 | 649 | 146.8 |
| D | 2 | 249 | 959921 | 6280.59 | 634 | 618 | 152.7 |
| D | 10 | 203 | 281577 | 1839.45 | 634 | 618 | 152.7 |
| D | 13 | 249 | 252690 | 1650.32 | 634 | 618 | 152.7 |
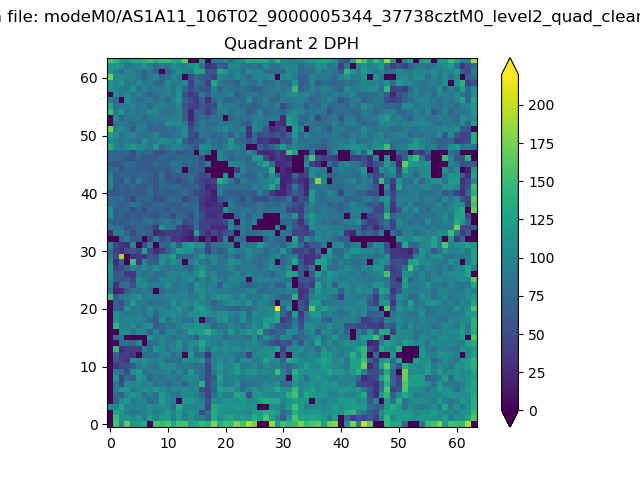
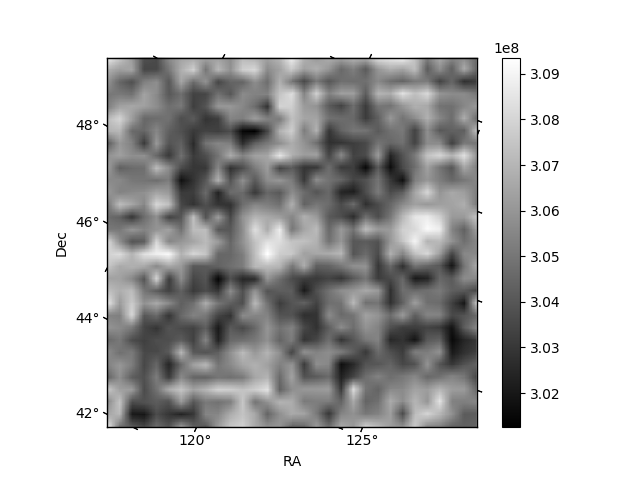
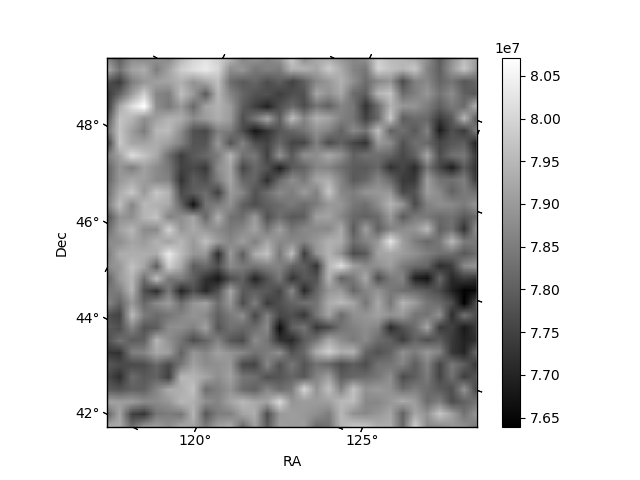
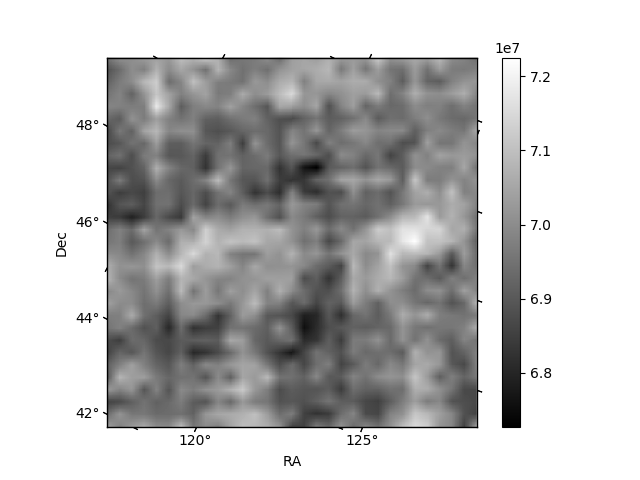
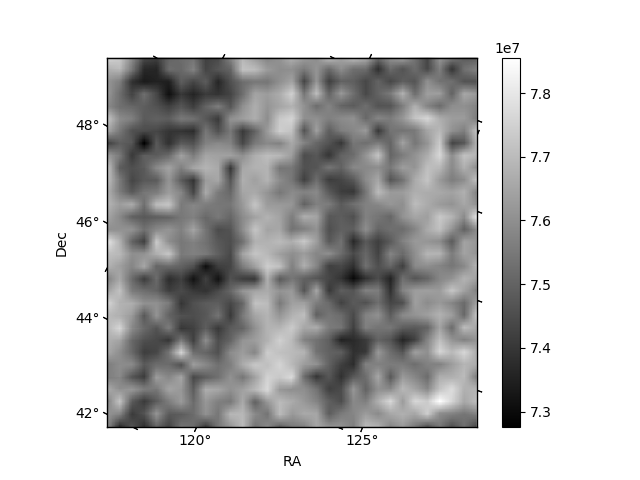
Histogram calculated using DETX and DETY for each event in the final _common_clean file
| Quadrant A | 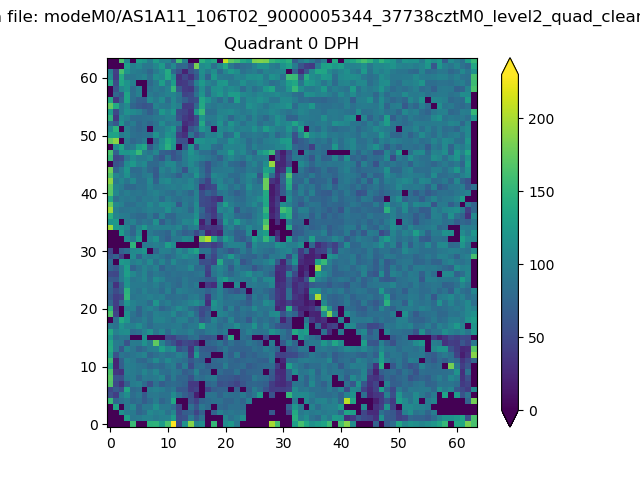 |
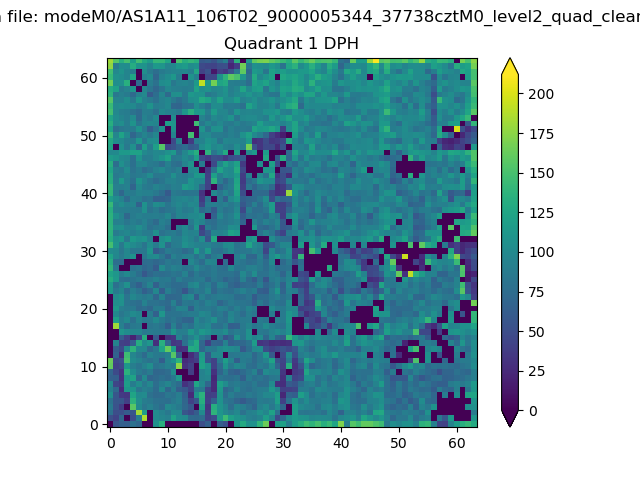 |
Quadrant B |
|---|---|---|---|
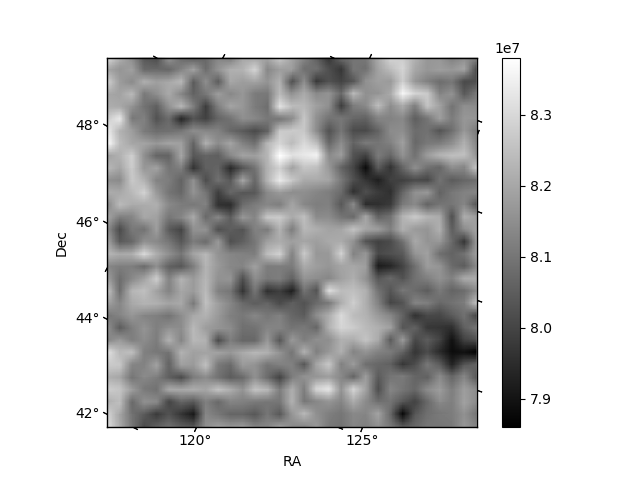
| Quadrant D | 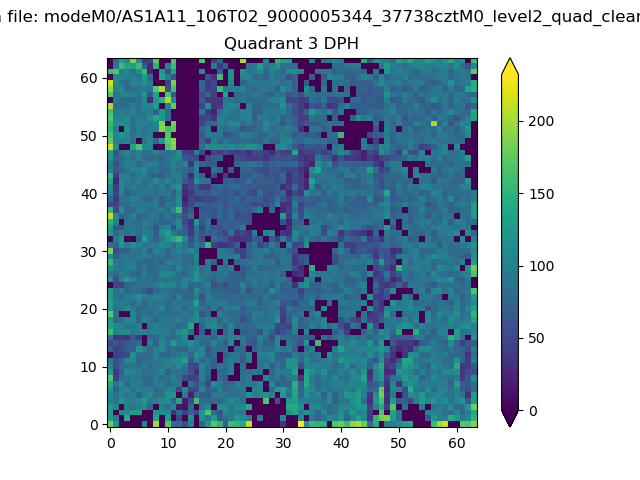 |
 |
Quadrant C |
| Plot type | Count rate plots | Images |
|---|---|---|
| Comparison with Poisson distribution Blue bars denote a histogram of data divided into 1 sec bins. Red curve is a Poisson curve with rate = median count rate of data. |
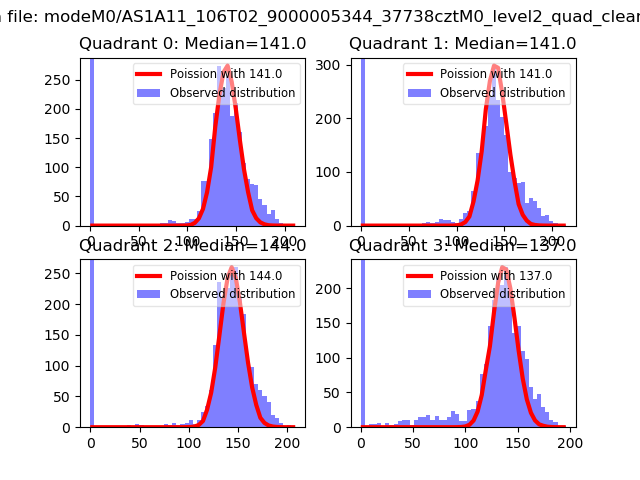 |
 |
| Quadrant-wise count rates Data is divided into 100 sec bins |
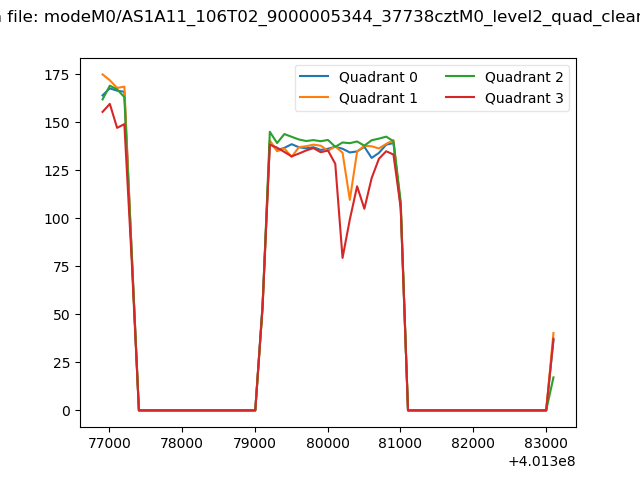 |
|
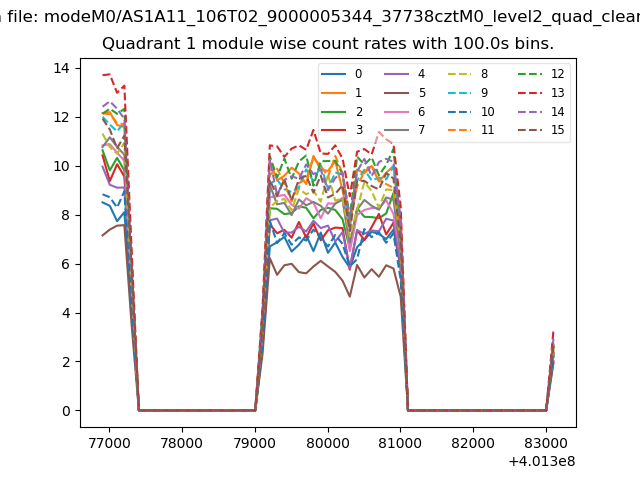
| Module-wise count rates for Quadrant A Data is divided into 100 sec bins |
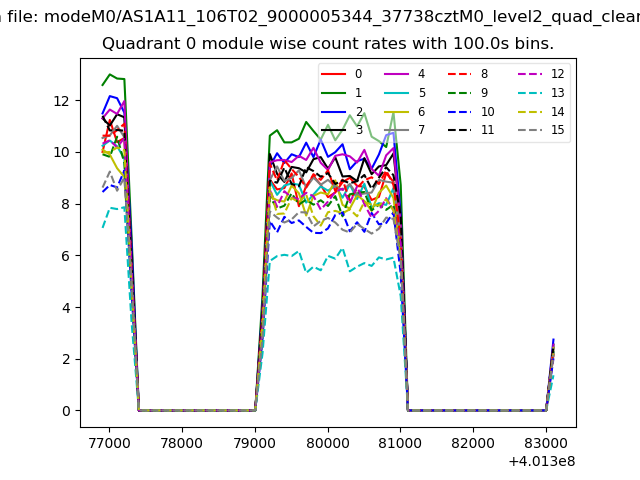 |
 |
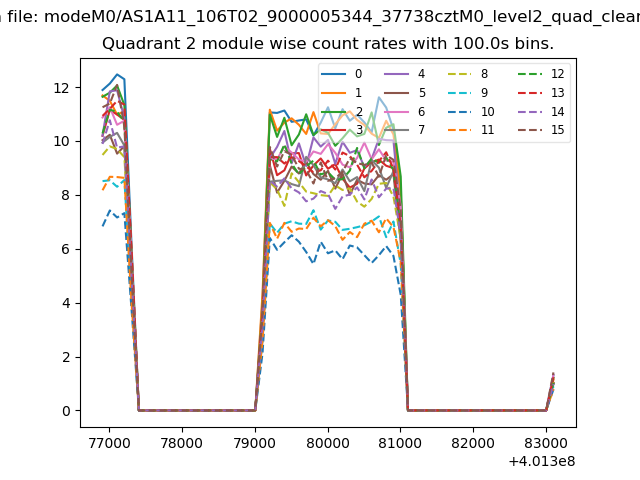
| Module-wise count rates for Quadrant B Data is divided into 100 sec bins |
 |
 |
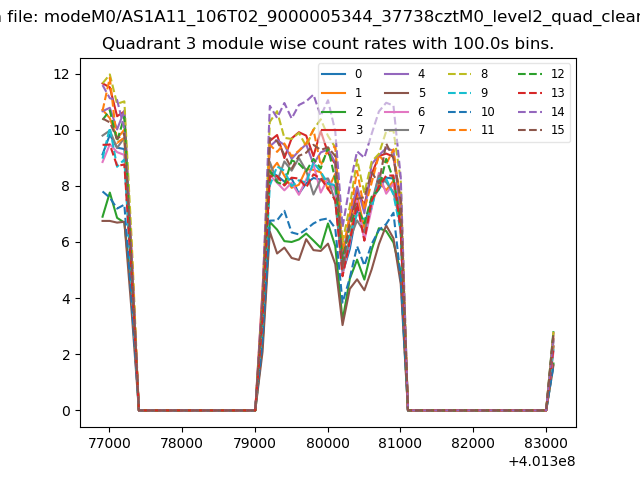
| Module-wise count rates for Quadrant C Data is divided into 100 sec bins |
 |
 |
| Module-wise count rates for Quadrant D Data is divided into 100 sec bins |
 |
 |
| Parameter | Plot |
|---|---|
| CZT HV Monitor | 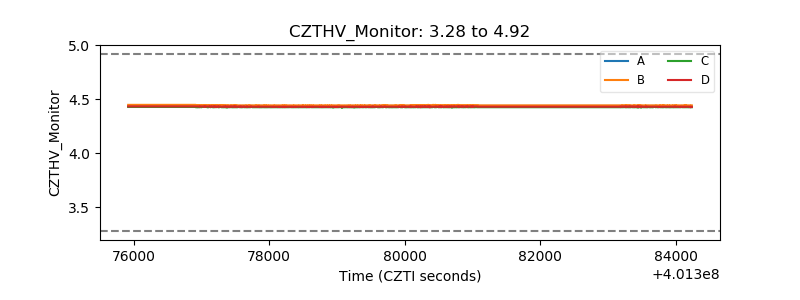 |
| D_VDD | 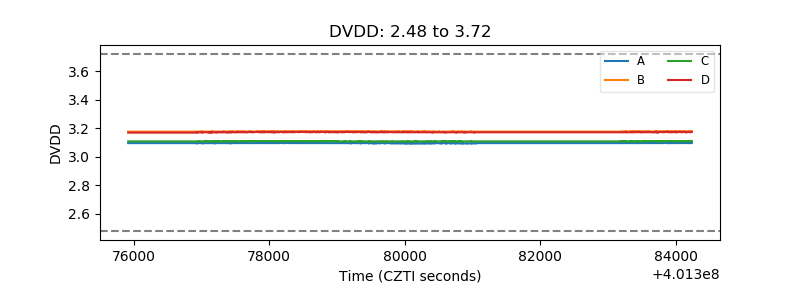 |
| Temperature 1 | 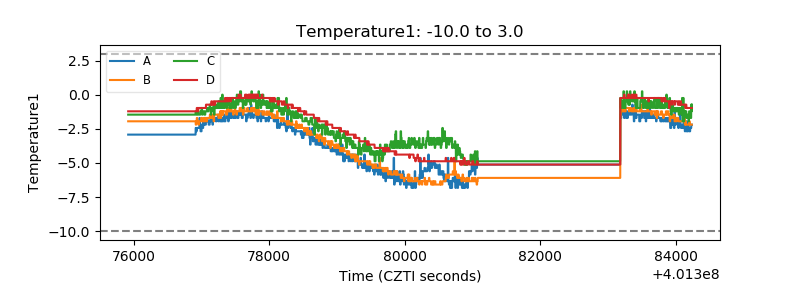 |
| Veto HV Monitor | 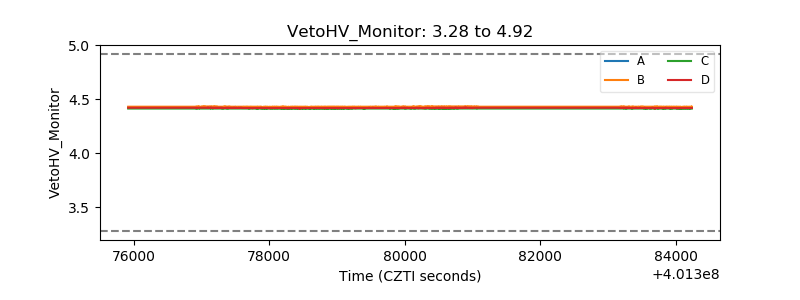 |
| Veto LLD | 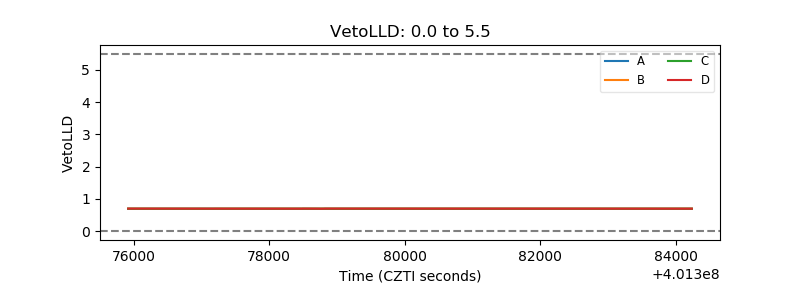 |
| Alpha Counter | 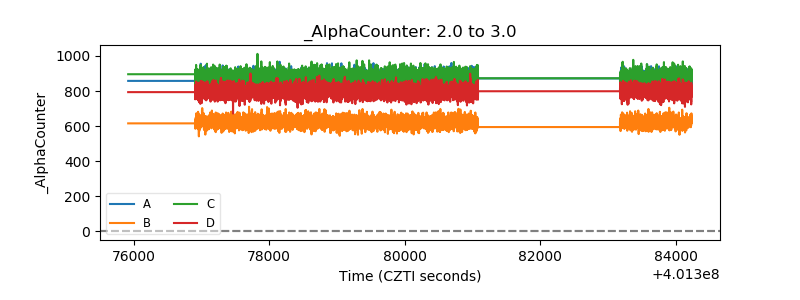 |
| _CPM_Rate | 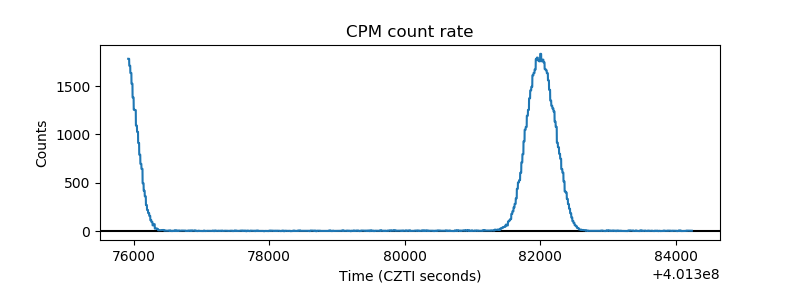 |
| CZT Counter | 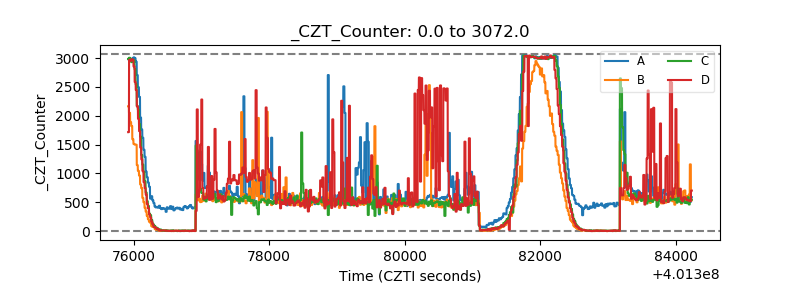 |
| +2.5 Volts monitor | 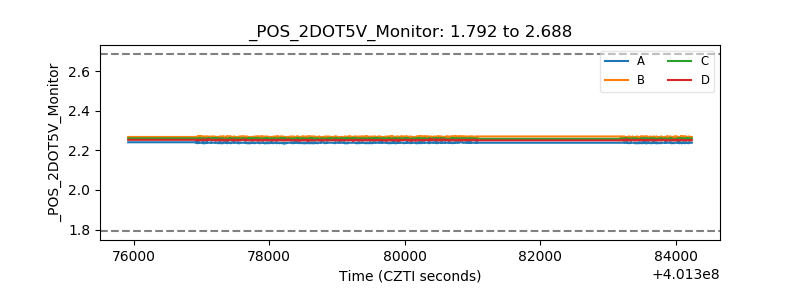 |
| +5 Volts monitor | 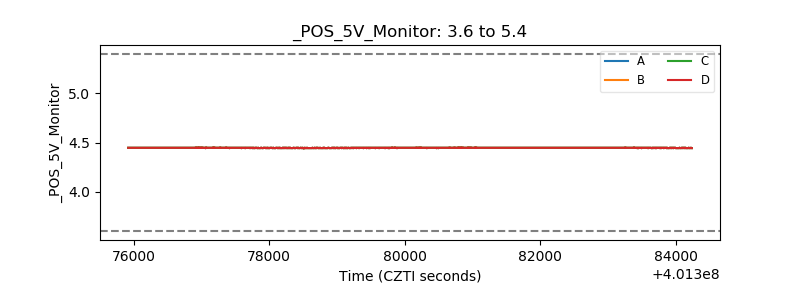 |
| _ROLL_ROT | 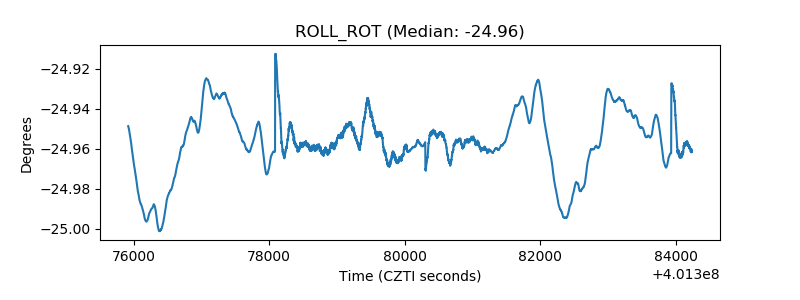 |
| _Roll_DEC | 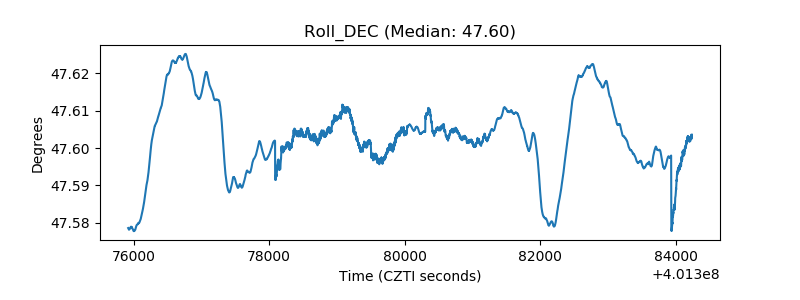 |
| _Roll_RA | 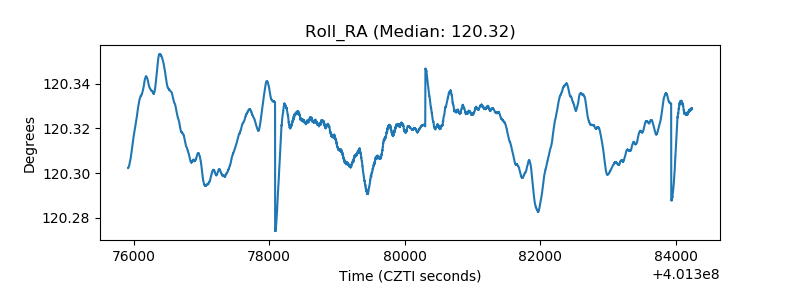 |
| Veto Counter | 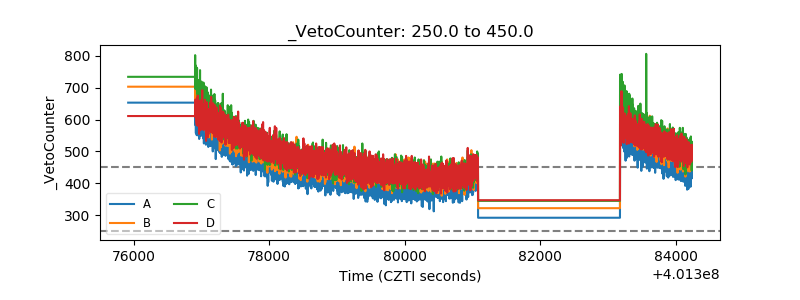 |