| Param | Original file | Final file |
|---|---|---|
| Filename | modeM0/AS1A11_106T02_9000005344_37739cztM0_level2.evt | modeM0/AS1A11_106T02_9000005344_37739cztM0_level2_quad_clean.evt |
| Size (bytes) | 484,116,480 | 53,343,360 |
| Size | 461.7 MB | 50.9 MB |
| Events in quadrant A | 4,127,805 | 314,058 |
| Events in quadrant B | 2,931,928 | 315,590 |
| Events in quadrant C | 3,009,390 | 322,456 |
| Events in quadrant D | 4,246,149 | 304,820 |
| Mode M9 | |||
|---|---|---|---|
| Quadrant | BADHDUFLAG | Total packets | Discarded packets |
| A | 0 | 22 | 0 |
| B | 0 | 22 | 0 |
| C | 0 | 22 | 0 |
| D | 0 | 23 | 0 |
| Mode SS | |||
|---|---|---|---|
| Quadrant | BADHDUFLAG | Total packets | Discarded packets |
| A | 0 | 104 | 0 |
| B | 0 | 104 | 0 |
| C | 0 | 104 | 0 |
| D | 0 | 104 | 0 |
| Mode M0 | |||
|---|---|---|---|
| Quadrant | BADHDUFLAG | Total packets | Discarded packets |
| A | 0 | 15557 | 3 |
| B | 0 | 11837 | 2 |
| C | 0 | 11745 | 2 |
| D | 0 | 15953 | 2 |
| Quadrant | Total seconds | Saturated seconds | Saturation percentage |
|---|---|---|---|
| A | 5108 | 401 | 7.850431% |
| B | 5108 | 45 | 0.880971% |
| C | 5108 | 139 | 2.721222% |
| D | 5108 | 358 | 7.008614% |
Noise dominated data is calculated using 1-second bins in cleaned event files. If a bin has >2000 counts, and if more than 50% of those come from <1% of pixels, then it is considered to be noise-dominated and hence unusable.
| Quadrant | # 1 sec bins | Bins with >0 counts | Bins with >2000 counts | High rate bins dominated by noise | Noise dominated (total time) | Noise dominated (detector-on time) | Marked lightcurve |
|---|---|---|---|---|---|---|---|
| A | 7230 | 5107 | 385 | 385 | 5.33% | 7.54% | 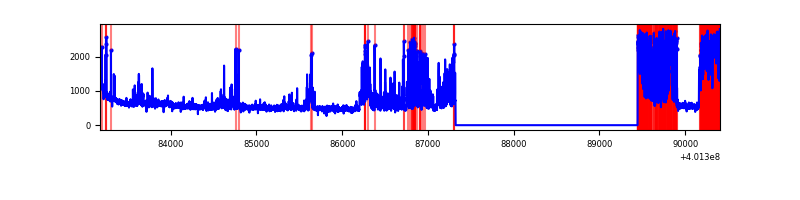 |
| B | 7231 | 5108 | 31 | 31 | 0.43% | 0.61% | 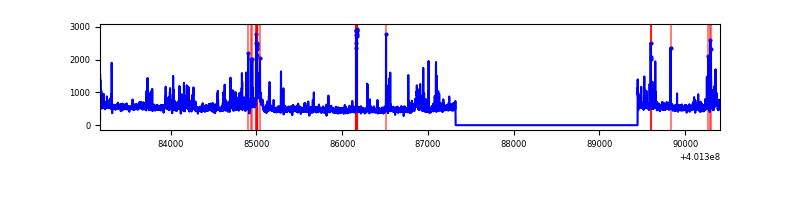 |
| C | 7231 | 5108 | 127 | 127 | 1.76% | 2.49% | 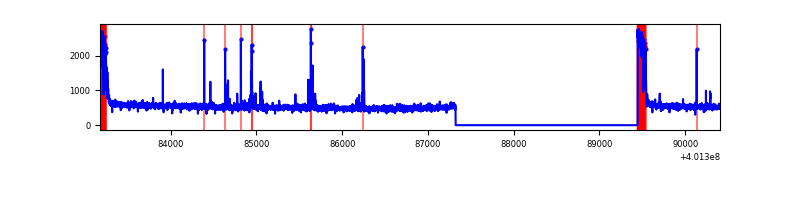 |
| D | 7231 | 5108 | 358 | 358 | 4.95% | 7.01% | 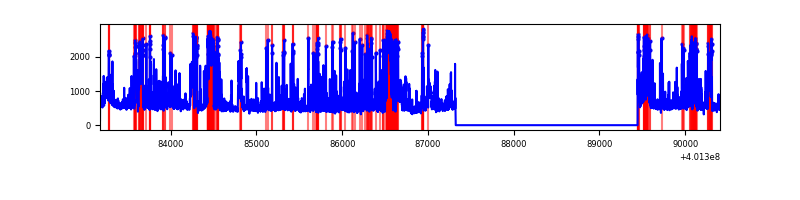 |
Top three noisy pixels from each quadrant. If the there are fewer than three noisy pixels in the level2.evt file, extra rows are filled as -1
| Pixel properties | Quadrant properties | ||||||
|---|---|---|---|---|---|---|---|
| Quadrant | DetID | PixID | Counts | Sigma | Mean | Median | Sigma |
| A | 15 | 222 | 1422467 | 11613.58 | 607 | 598 | 122.4 |
| A | 10 | 83 | 329861 | 2689.36 | 607 | 598 | 122.4 |
| A | 12 | 189 | 12052 | 93.55 | 607 | 598 | 122.4 |
| B | 5 | 255 | 118530 | 1026.21 | 616 | 600 | 114.9 |
| B | 4 | 232 | 92367 | 798.54 | 616 | 600 | 114.9 |
| B | 0 | 189 | 62704 | 540.42 | 616 | 600 | 114.9 |
| C | 0 | 10 | 326260 | 2349.12 | 606 | 612 | 138.6 |
| C | 15 | 214 | 216113 | 1554.55 | 606 | 612 | 138.6 |
| C | 0 | 207 | 40920 | 290.77 | 606 | 612 | 138.6 |
| D | 5 | 222 | 836503 | 5736.79 | 602 | 587 | 145.7 |
| D | 2 | 249 | 444397 | 3045.81 | 602 | 587 | 145.7 |
| D | 13 | 249 | 265720 | 1819.58 | 602 | 587 | 145.7 |
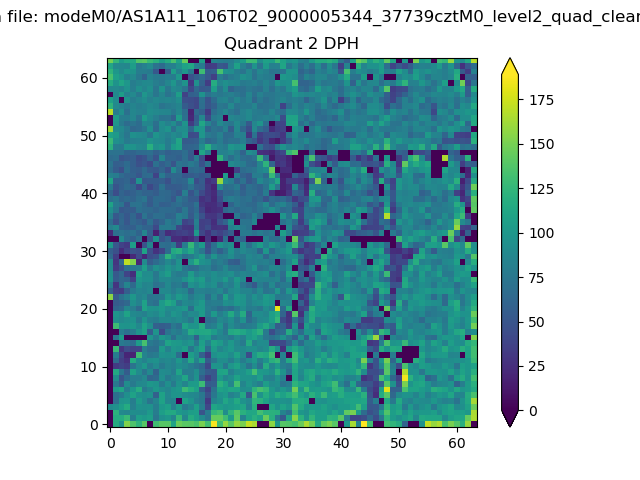
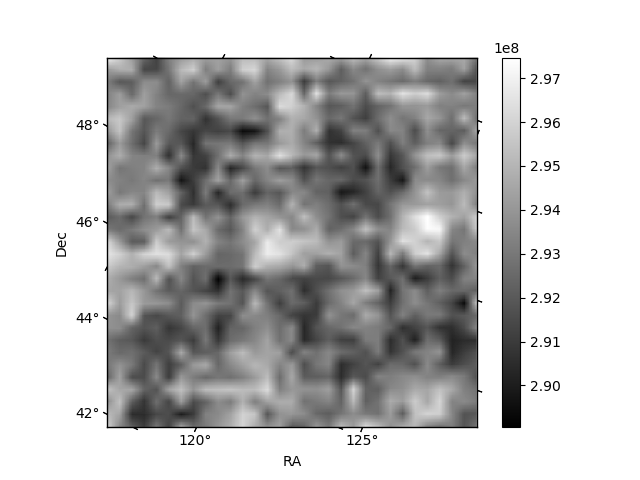
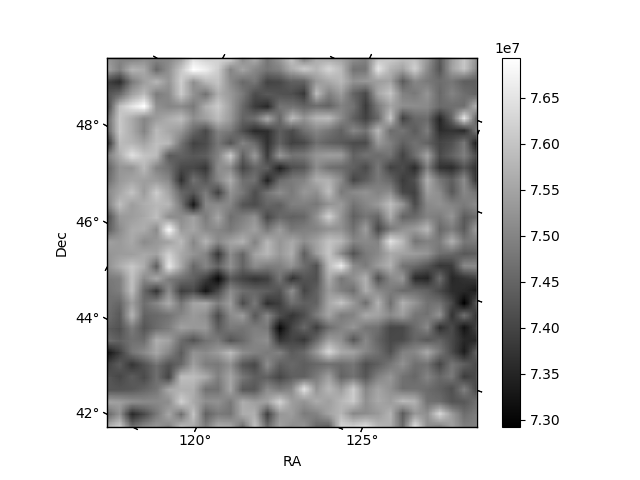
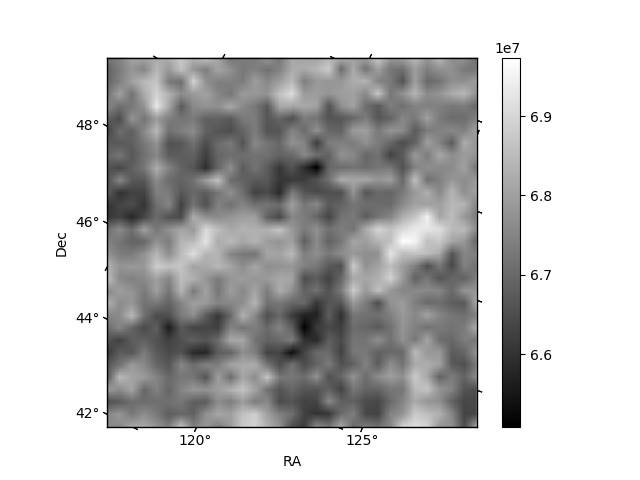
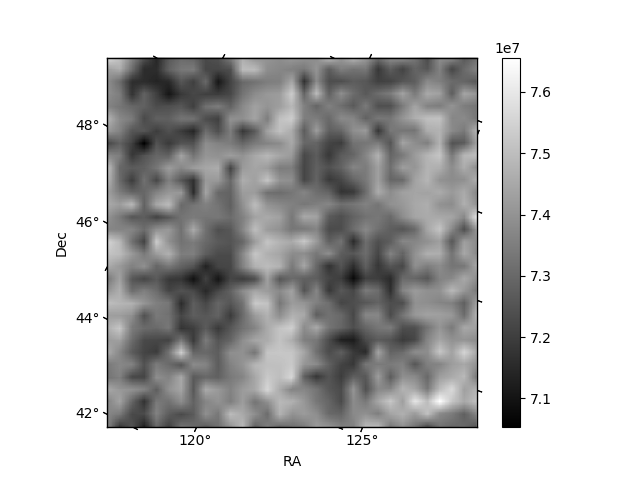
Histogram calculated using DETX and DETY for each event in the final _common_clean file
| Quadrant A | 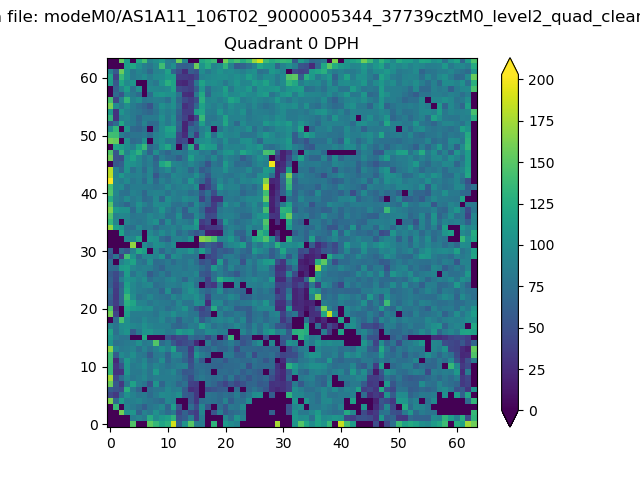 |
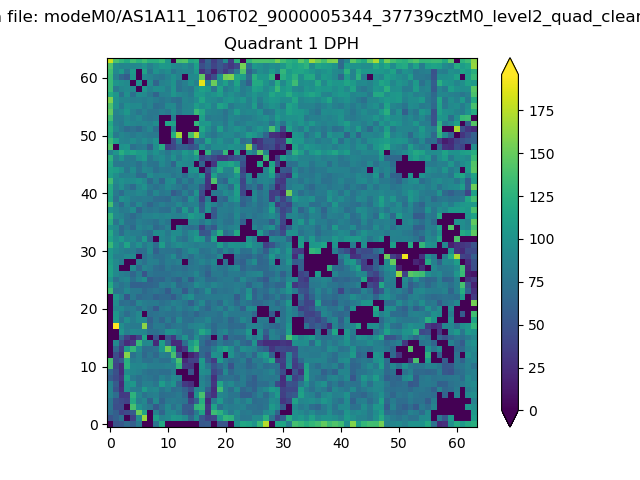 |
Quadrant B |
|---|---|---|---|
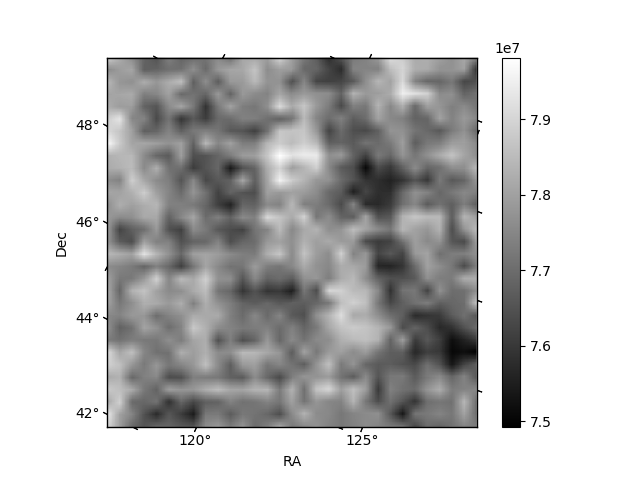
| Quadrant D | 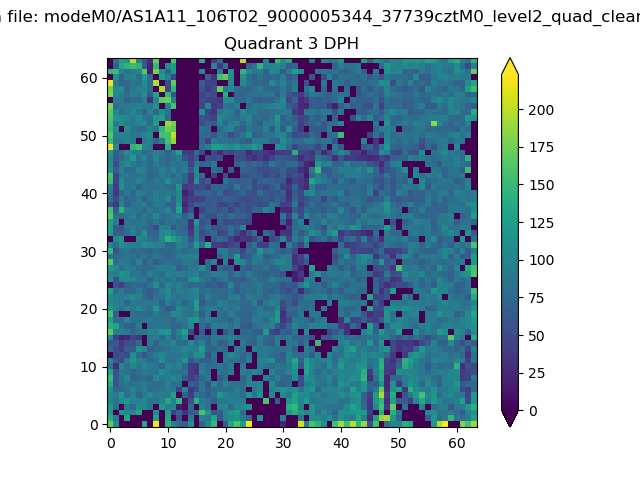 |
 |
Quadrant C |
| Plot type | Count rate plots | Images |
|---|---|---|
| Comparison with Poisson distribution Blue bars denote a histogram of data divided into 1 sec bins. Red curve is a Poisson curve with rate = median count rate of data. |
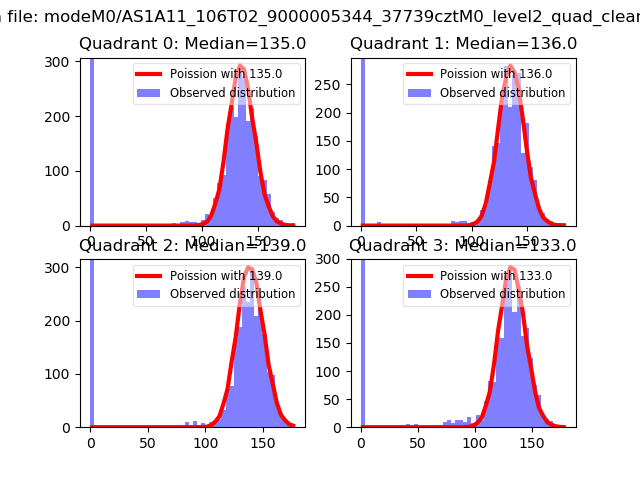 |
 |
| Quadrant-wise count rates Data is divided into 100 sec bins |
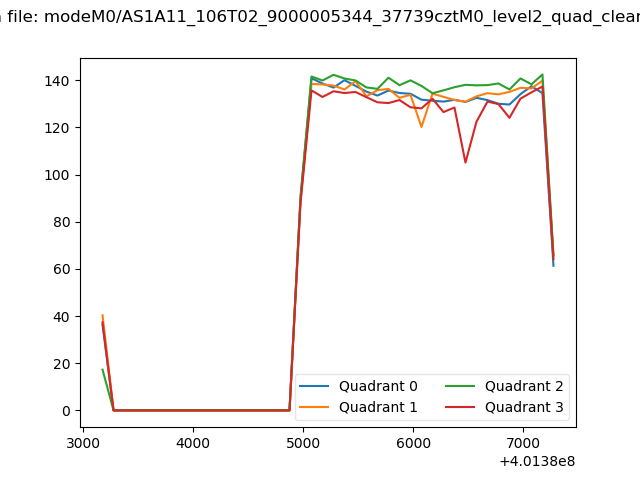 |
|
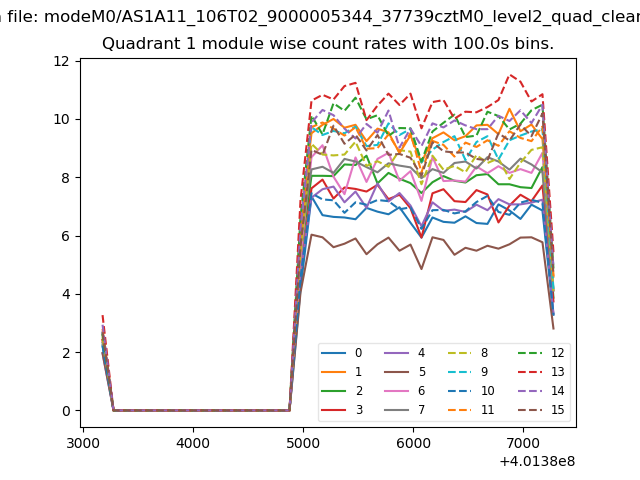
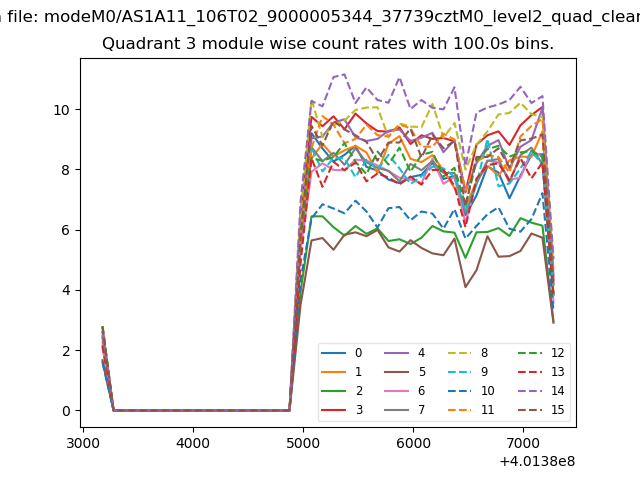
| Module-wise count rates for Quadrant A Data is divided into 100 sec bins |
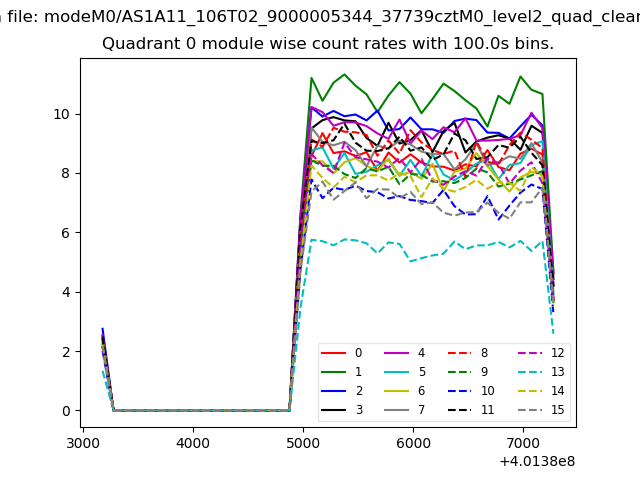 |
 |
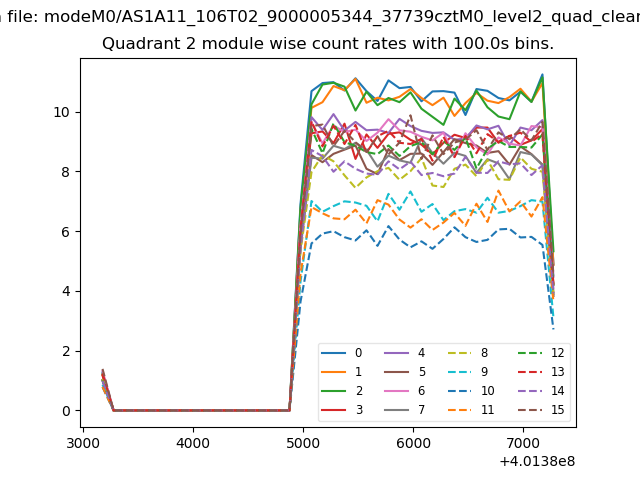
| Module-wise count rates for Quadrant B Data is divided into 100 sec bins |
 |
 |
| Module-wise count rates for Quadrant C Data is divided into 100 sec bins |
 |
 |
| Module-wise count rates for Quadrant D Data is divided into 100 sec bins |
 |
 |
| Parameter | Plot |
|---|---|
| CZT HV Monitor | 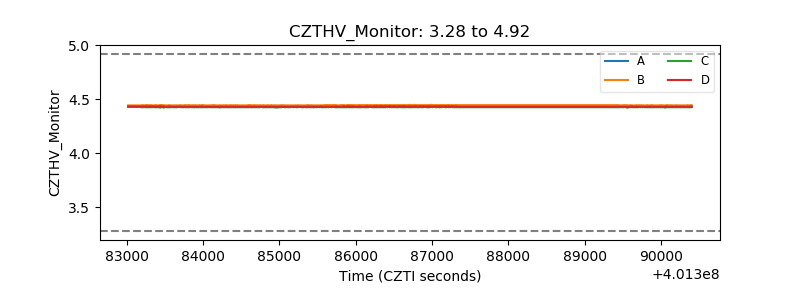 |
| D_VDD | 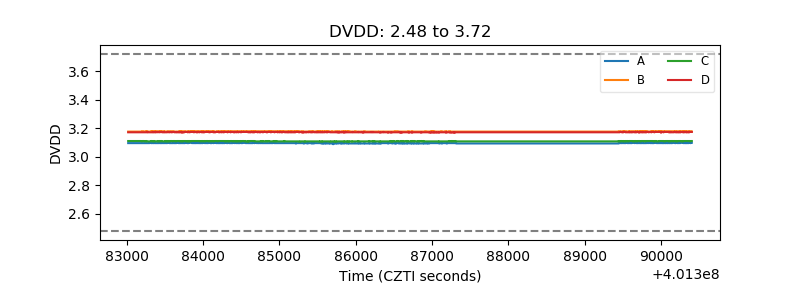 |
| Temperature 1 | 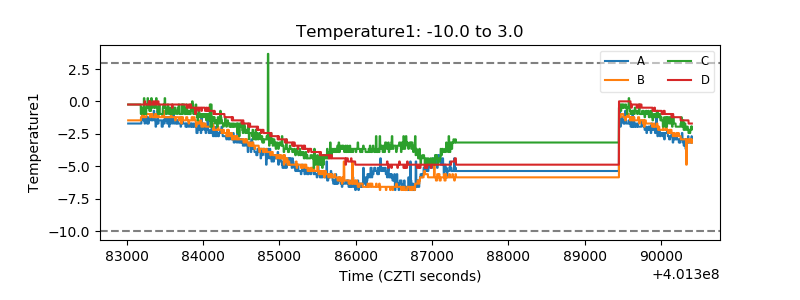 |
| Veto HV Monitor | 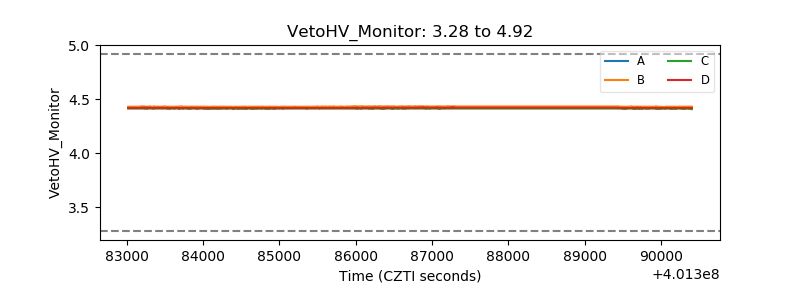 |
| Veto LLD | 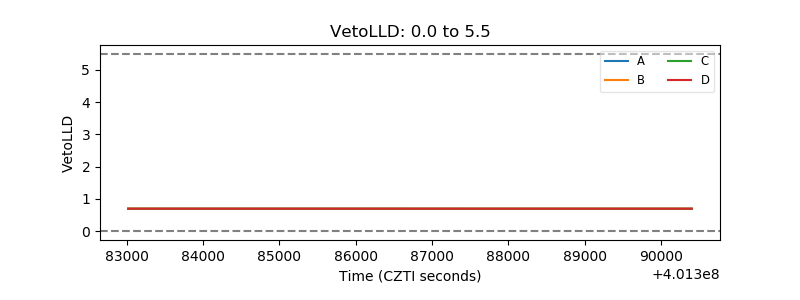 |
| Alpha Counter | 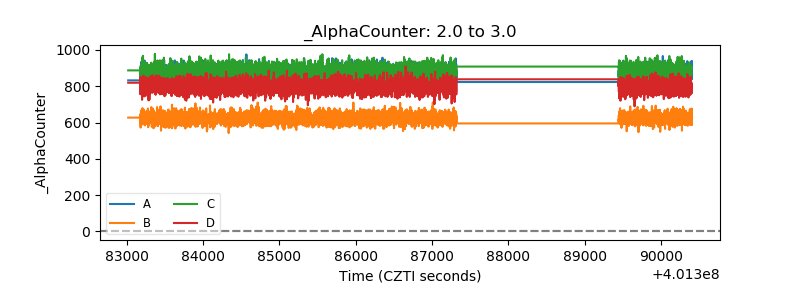 |
| _CPM_Rate | 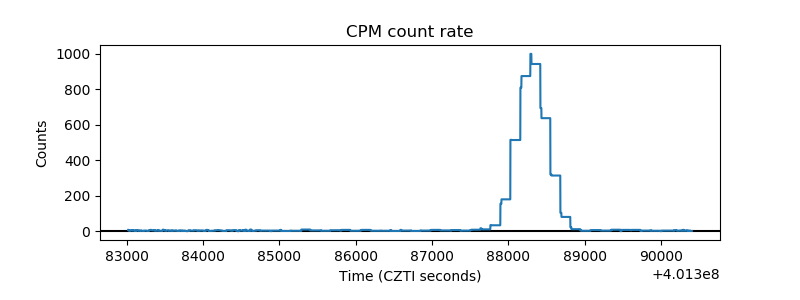 |
| CZT Counter | 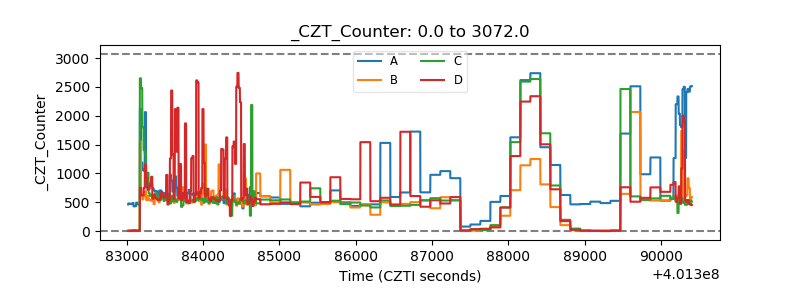 |
| +2.5 Volts monitor | 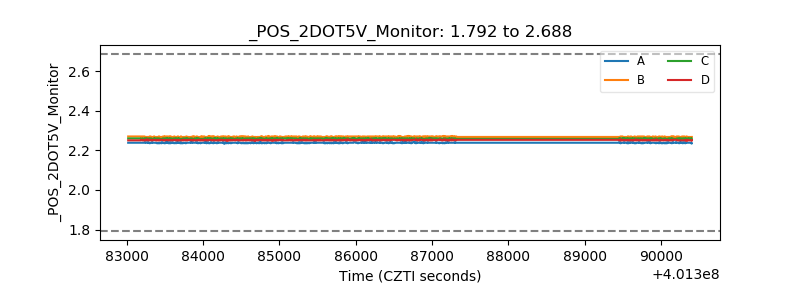 |
| +5 Volts monitor | 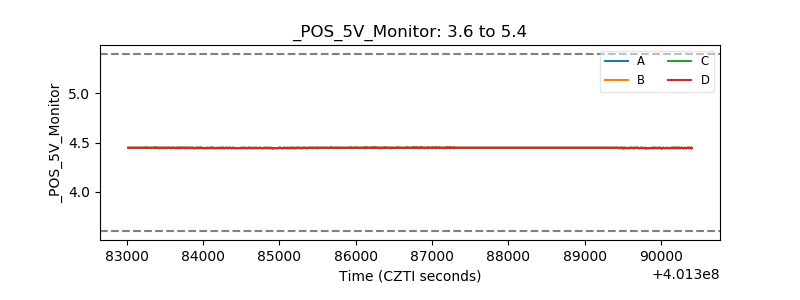 |
| _ROLL_ROT | 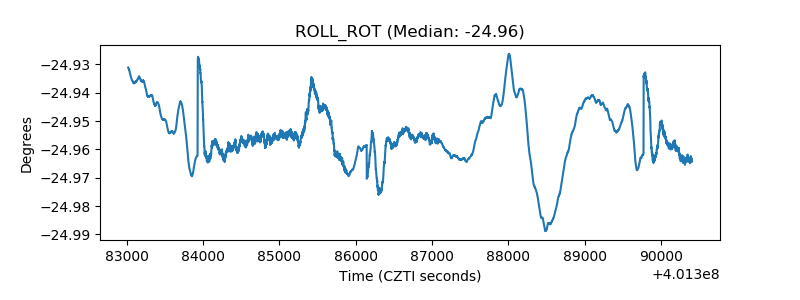 |
| _Roll_DEC | 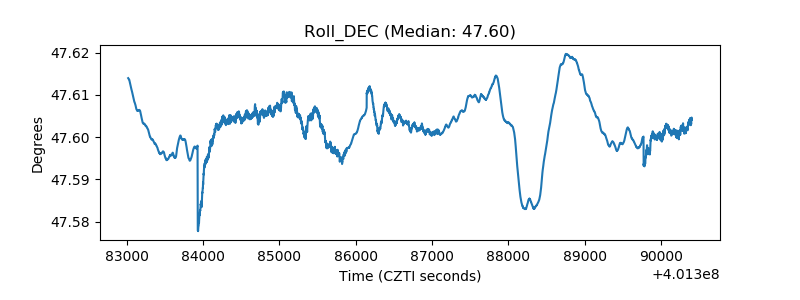 |
| _Roll_RA | 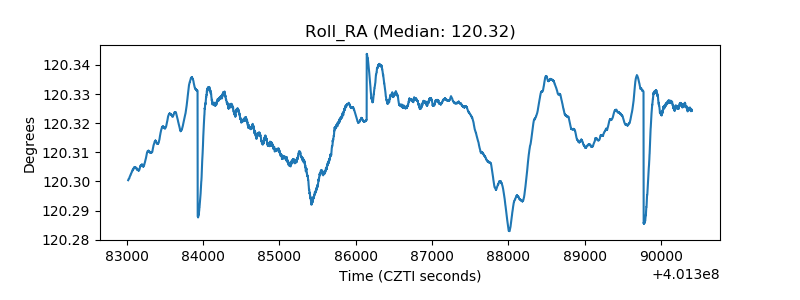 |
| Veto Counter | 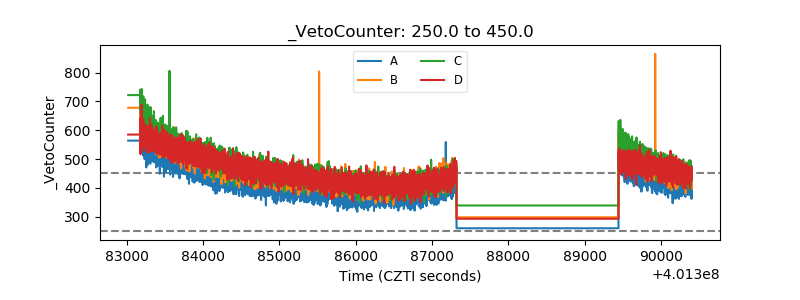 |