| Param | Original file | Final file |
|---|---|---|
| Filename | modeM0/AS1A11_106T02_9000005344_37740cztM0_level2.evt | modeM0/AS1A11_106T02_9000005344_37740cztM0_level2_quad_clean.evt |
| Size (bytes) | 456,958,080 | 60,071,040 |
| Size | 435.8 MB | 57.3 MB |
| Events in quadrant A | 4,460,559 | 362,647 |
| Events in quadrant B | 2,699,640 | 367,069 |
| Events in quadrant C | 2,891,776 | 376,026 |
| Events in quadrant D | 3,443,232 | 358,059 |
| Mode M9 | |||
|---|---|---|---|
| Quadrant | BADHDUFLAG | Total packets | Discarded packets |
| A | 0 | 22 | 0 |
| B | 0 | 22 | 0 |
| C | 0 | 22 | 0 |
| D | 0 | 23 | 0 |
| Mode SS | |||
|---|---|---|---|
| Quadrant | BADHDUFLAG | Total packets | Discarded packets |
| A | 0 | 104 | 0 |
| B | 0 | 104 | 0 |
| C | 0 | 104 | 0 |
| D | 0 | 104 | 0 |
| Mode M0 | |||
|---|---|---|---|
| Quadrant | BADHDUFLAG | Total packets | Discarded packets |
| A | 0 | 16458 | 3 |
| B | 0 | 11245 | 2 |
| C | 0 | 11533 | 2 |
| D | 0 | 13603 | 2 |
| Quadrant | Total seconds | Saturated seconds | Saturation percentage |
|---|---|---|---|
| A | 5061 | 624 | 12.329579% |
| B | 5061 | 51 | 1.007706% |
| C | 5061 | 158 | 3.121913% |
| D | 5061 | 179 | 3.536850% |
Noise dominated data is calculated using 1-second bins in cleaned event files. If a bin has >2000 counts, and if more than 50% of those come from <1% of pixels, then it is considered to be noise-dominated and hence unusable.
| Quadrant | # 1 sec bins | Bins with >0 counts | Bins with >2000 counts | High rate bins dominated by noise | Noise dominated (total time) | Noise dominated (detector-on time) | Marked lightcurve |
|---|---|---|---|---|---|---|---|
| A | 7093 | 5061 | 606 | 606 | 8.54% | 11.97% | 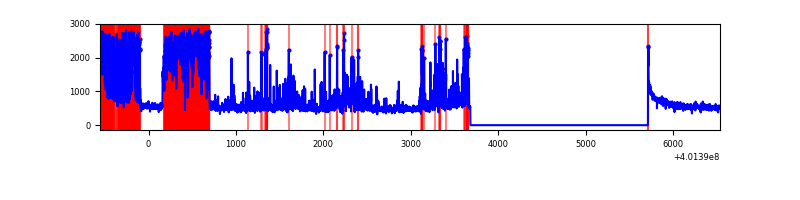 |
| B | 7093 | 5062 | 34 | 34 | 0.48% | 0.67% | 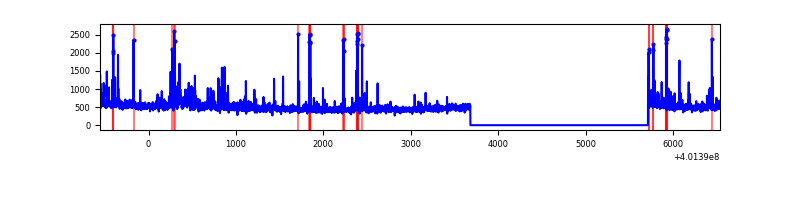 |
| C | 7092 | 5060 | 143 | 143 | 2.02% | 2.83% | 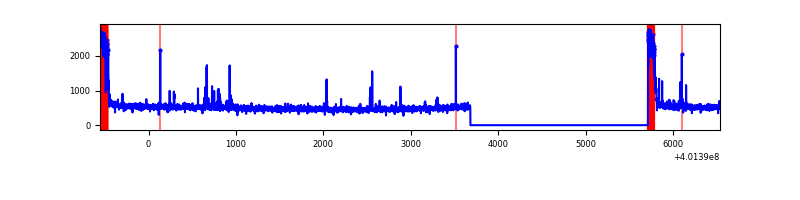 |
| D | 7093 | 5061 | 157 | 157 | 2.21% | 3.10% | 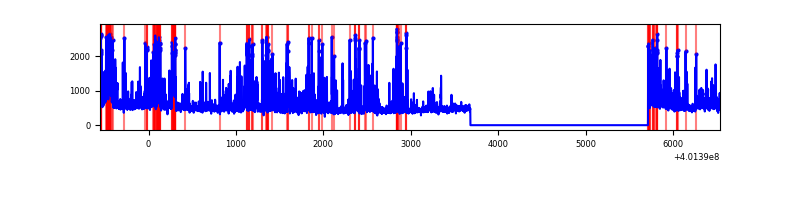 |
Top three noisy pixels from each quadrant. If the there are fewer than three noisy pixels in the level2.evt file, extra rows are filled as -1
| Pixel properties | Quadrant properties | ||||||
|---|---|---|---|---|---|---|---|
| Quadrant | DetID | PixID | Counts | Sigma | Mean | Median | Sigma |
| A | 15 | 222 | 1941342 | 17095.08 | 561 | 551 | 113.5 |
| A | 10 | 83 | 318430 | 2799.98 | 561 | 551 | 113.5 |
| A | 12 | 189 | 13340 | 112.65 | 561 | 551 | 113.5 |
| B | 5 | 255 | 181518 | 1644.25 | 584 | 571 | 110.0 |
| B | 0 | 229 | 48373 | 434.37 | 584 | 571 | 110.0 |
| B | 5 | 172 | 43305 | 388.32 | 584 | 571 | 110.0 |
| C | 0 | 10 | 361375 | 2724.81 | 572 | 576 | 132.4 |
| C | 15 | 214 | 214039 | 1612.1 | 572 | 576 | 132.4 |
| C | 1 | 23 | 25190 | 185.89 | 572 | 576 | 132.4 |
| D | 2 | 249 | 725113 | 5223.2 | 573 | 558 | 138.7 |
| D | 2 | 153 | 219361 | 1577.32 | 573 | 558 | 138.7 |
| D | 13 | 249 | 80780 | 578.31 | 573 | 558 | 138.7 |
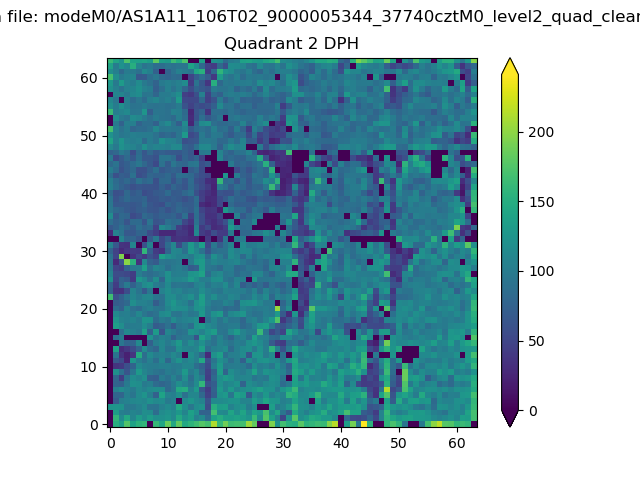
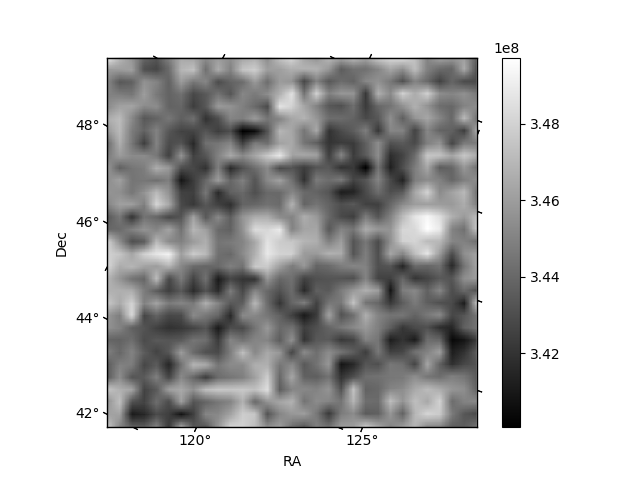
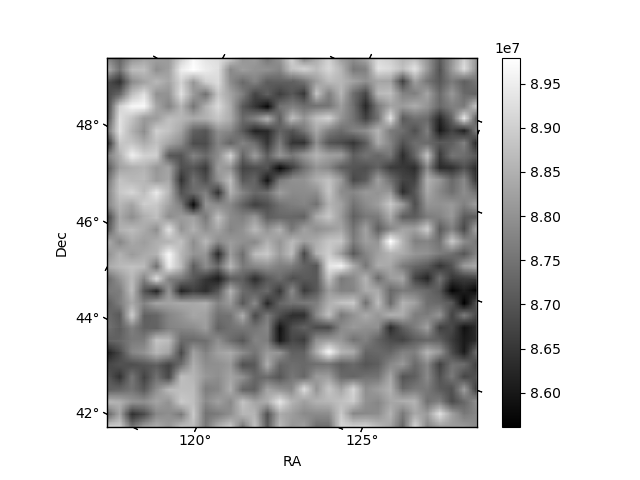
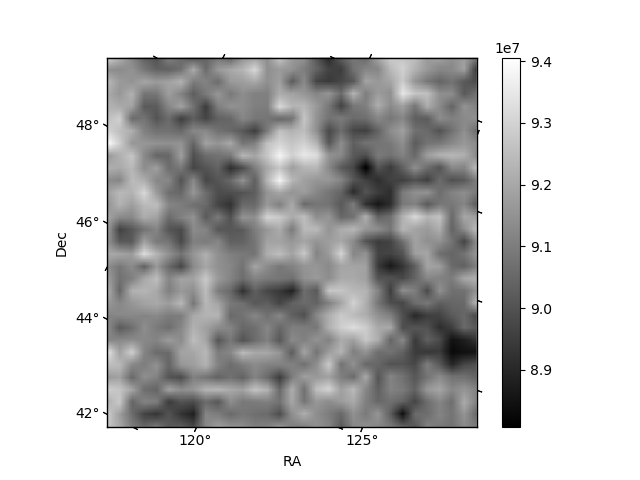
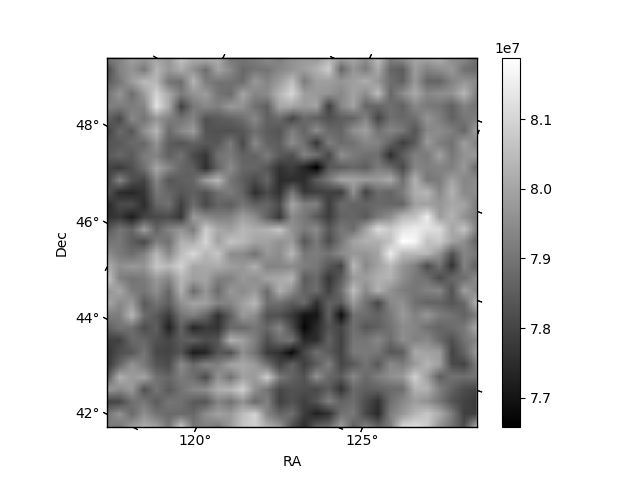
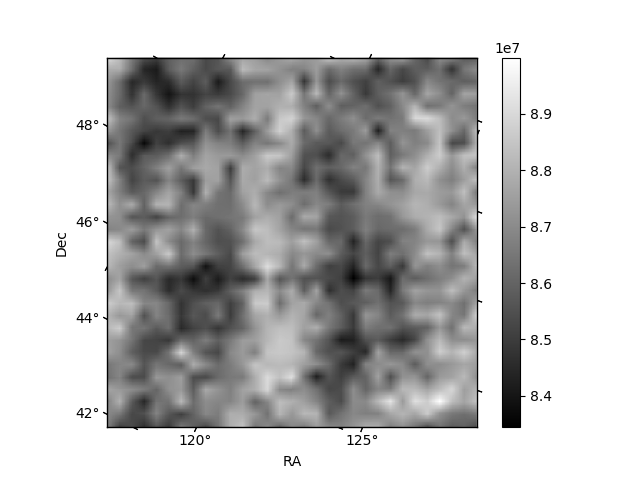
Histogram calculated using DETX and DETY for each event in the final _common_clean file
| Quadrant A | 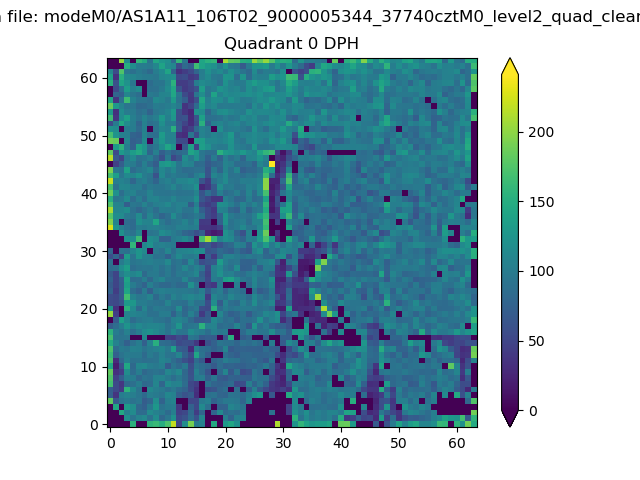 |
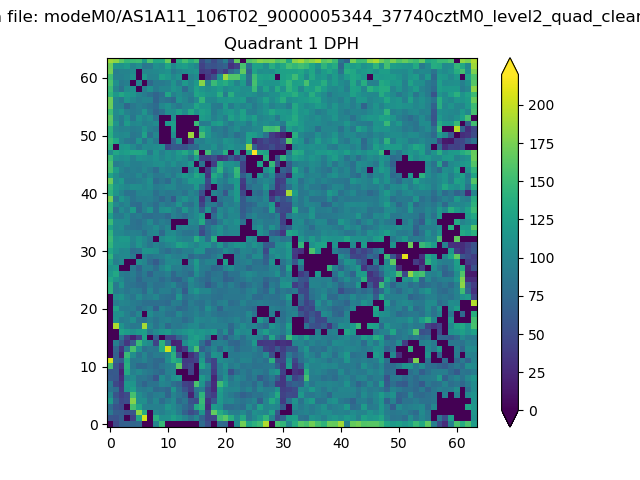 |
Quadrant B |
|---|---|---|---|
| Quadrant D | 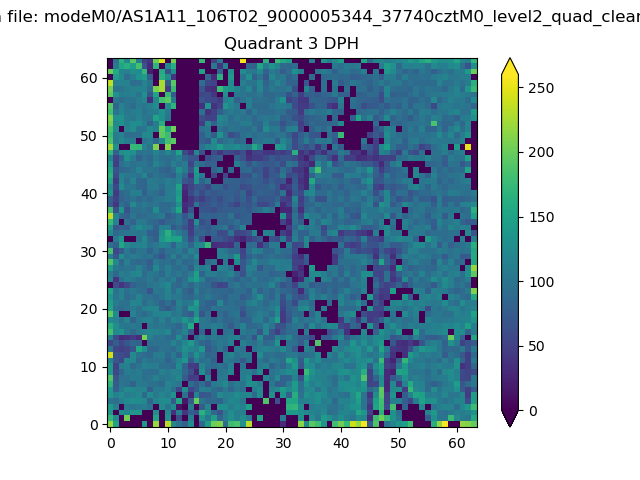 |
 |
Quadrant C |
| Plot type | Count rate plots | Images |
|---|---|---|
| Comparison with Poisson distribution Blue bars denote a histogram of data divided into 1 sec bins. Red curve is a Poisson curve with rate = median count rate of data. |
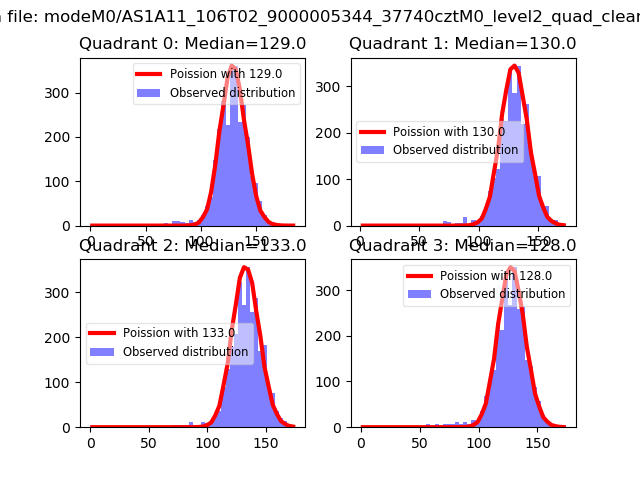 |
 |
| Quadrant-wise count rates Data is divided into 100 sec bins |
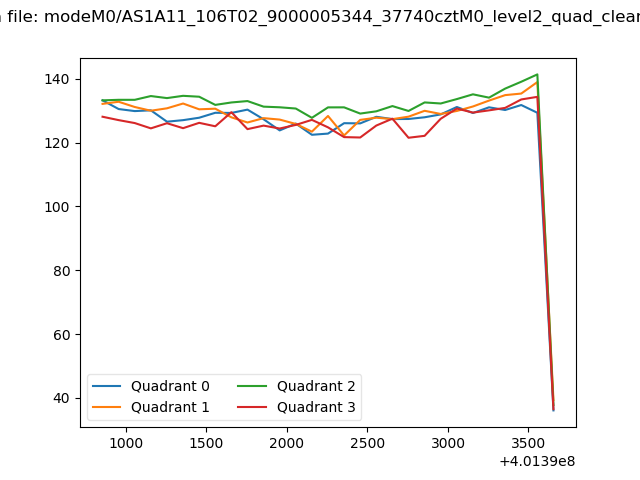 |
|
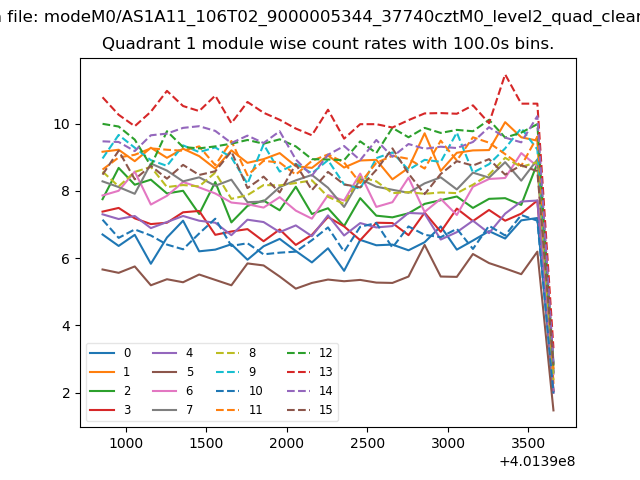
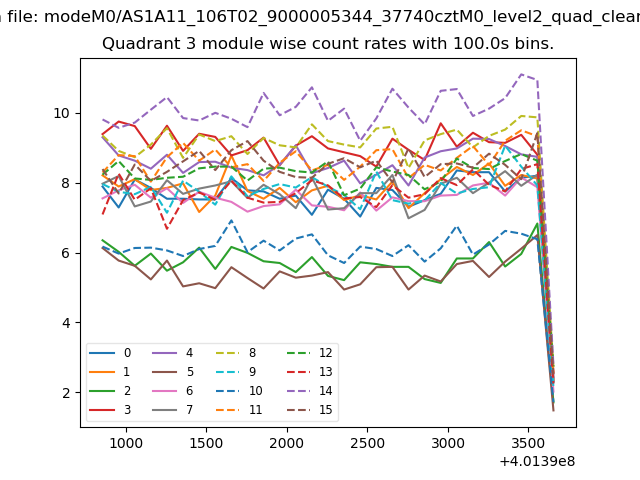
| Module-wise count rates for Quadrant A Data is divided into 100 sec bins |
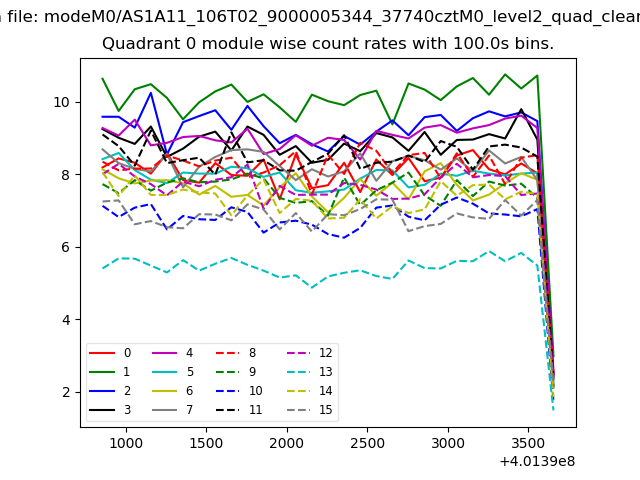 |
 |
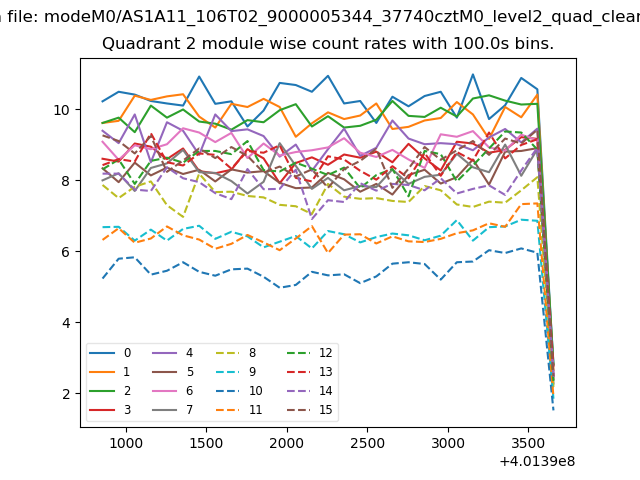
| Module-wise count rates for Quadrant B Data is divided into 100 sec bins |
 |
 |
| Module-wise count rates for Quadrant C Data is divided into 100 sec bins |
 |
 |
| Module-wise count rates for Quadrant D Data is divided into 100 sec bins |
 |
 |
| Parameter | Plot |
|---|---|
| CZT HV Monitor | 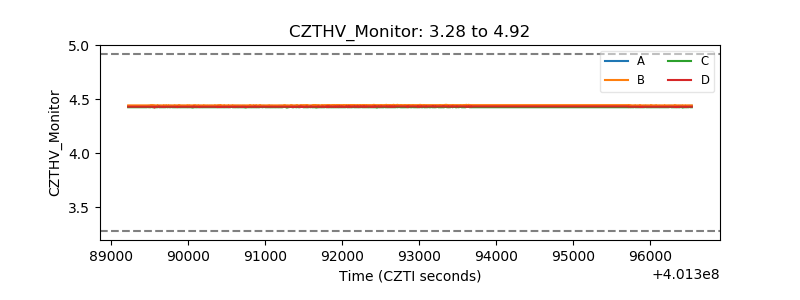 |
| D_VDD | 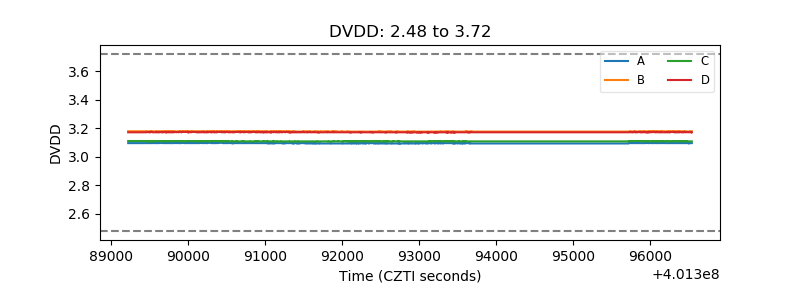 |
| Temperature 1 | 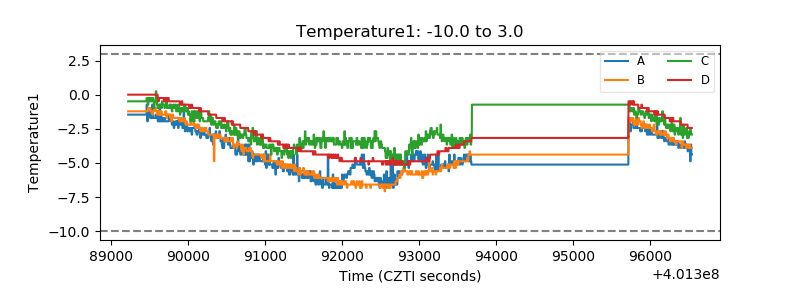 |
| Veto HV Monitor | 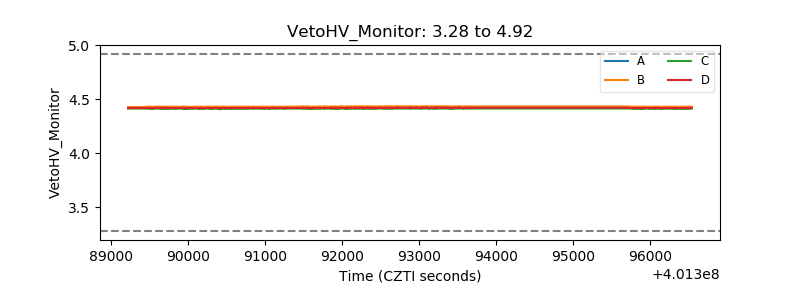 |
| Veto LLD | 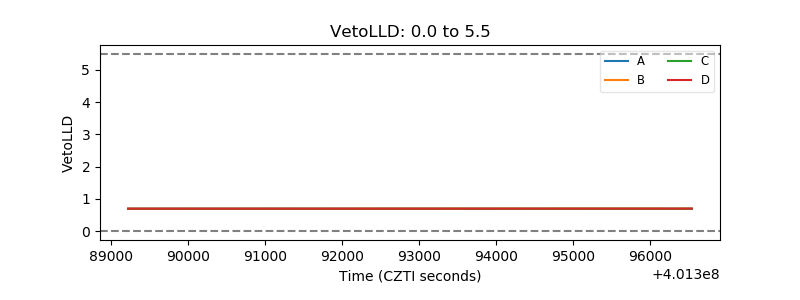 |
| Alpha Counter | 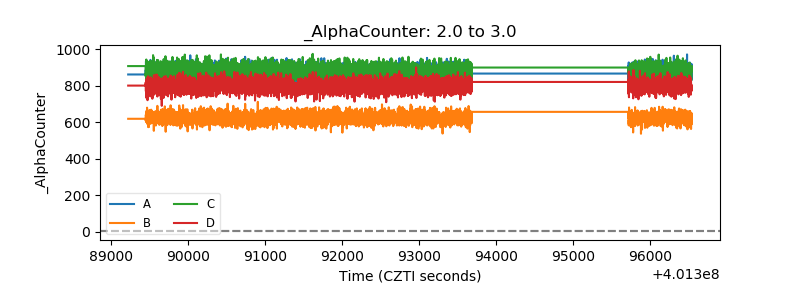 |
| _CPM_Rate | 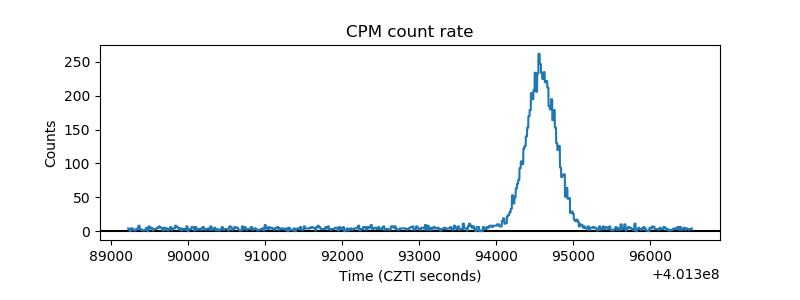 |
| CZT Counter | 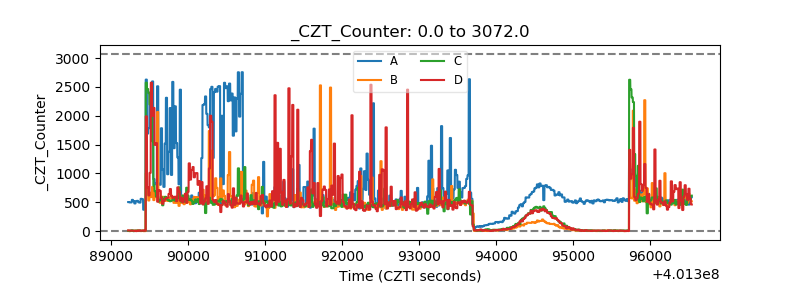 |
| +2.5 Volts monitor |  |
| +5 Volts monitor | 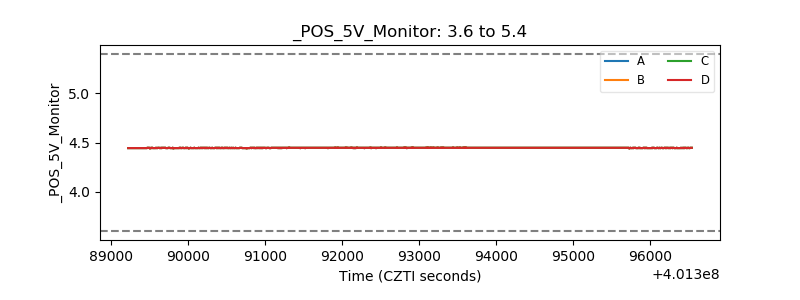 |
| _ROLL_ROT | 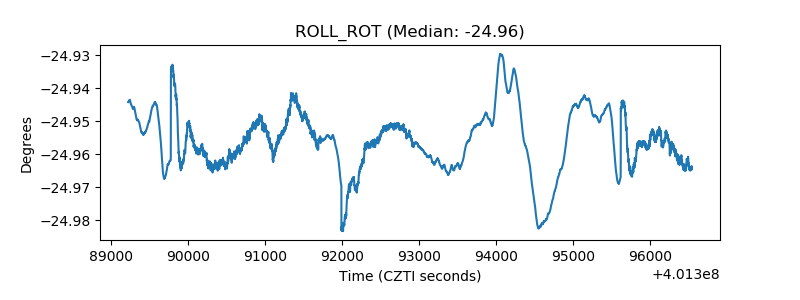 |
| _Roll_DEC | 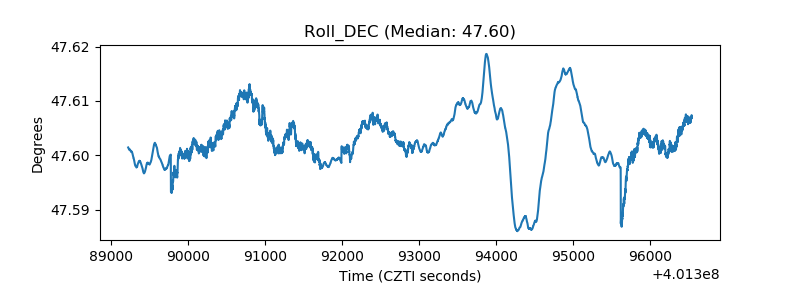 |
| _Roll_RA | 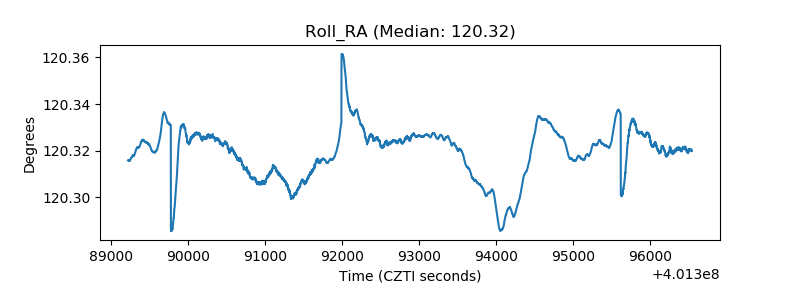 |
| Veto Counter | 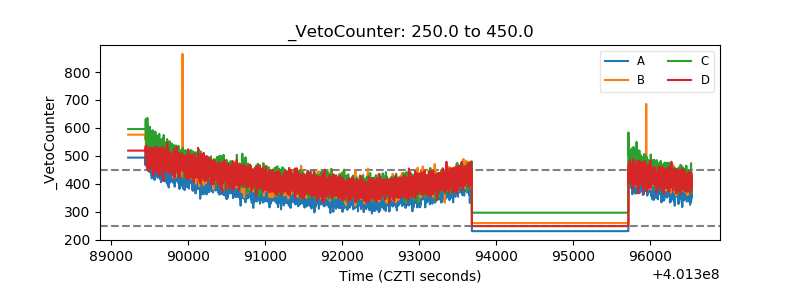 |